By WUWT regular “Just The Facts”
I am often amused by claims that we understand Earth’s climate system, are able to accurately measure its behavior, eliminate all potential variables except CO2 as the primary driver of Earth’s temperature and make predictions of Earth’s temperature decades into the future, all with a high degree of confidence. I have been studying Earth’s climate system for several years and have found it to be a ridiculously complex, continually evolving and sometimes chaotic beast. Furthermore, our understanding of Earth’s climate system is currently rudimentary at best, our measurement capabilities are limited and our historical record is laughably brief. To help demonstrate the complexity of Earth’s climate system I have been compiling a list of all of the variables potentially involved in Earth’s climate system. This is a work in progress so additions, recommendations, corrections, questions etc. are most welcome. Once I develop this further and polish it up a bit I plan to convert it into a new WUWT Reference Page.
UPDATED: This list has undergone significant revisions and improvements based upon crowdsourcing the input of an array of very intelligent and knowledgeable contributors below. Additionally, this list was posted in comments in WUWT a few times previously, receiving input from a number of other very intelligent and knowledgeable contributors. This thread, along with links to the precursor threads below, will thus serve as the bibliography for the forthcoming WUWT Potential Climatic Variables reference page (unless someone can up with a better name for it…:)
1. Earth’s Rotational Energy;
http://en.wikipedia.org/wiki/Rotational_energy
http://en.wikipedia.org/wiki/Earth%27s_rotation
http://www.physicalgeography.net/fundamentals/6h.html
results in day and night;
http://wiki.answers.com/Q/Why_does_rotation_cause_day_and_night
causes the Coriolis Effect;
http://en.wikipedia.org/wiki/Coriolis_effect
imparts Planetary Vorticity on the oceans;
http://oceanworld.tamu.edu/resources/ocng_textbook/chapter12/chapter12_01.htm
and manifests as Ocean Gyres;
http://en.wikipedia.org/wiki/Ocean_gyre
the Antarctic Circumpolar Current;
http://en.wikipedia.org/wiki/Antarctic_Circumpolar_Current
http://en.wikipedia.org/wiki/File:Conveyor_belt.svg
Arctic Ocean Circulation;
http://www.whoi.edu/page.do?pid=12455&tid=441&cid=47170&ct=61&article=20727
http://www.john-daly.com/polar/flows.jpg
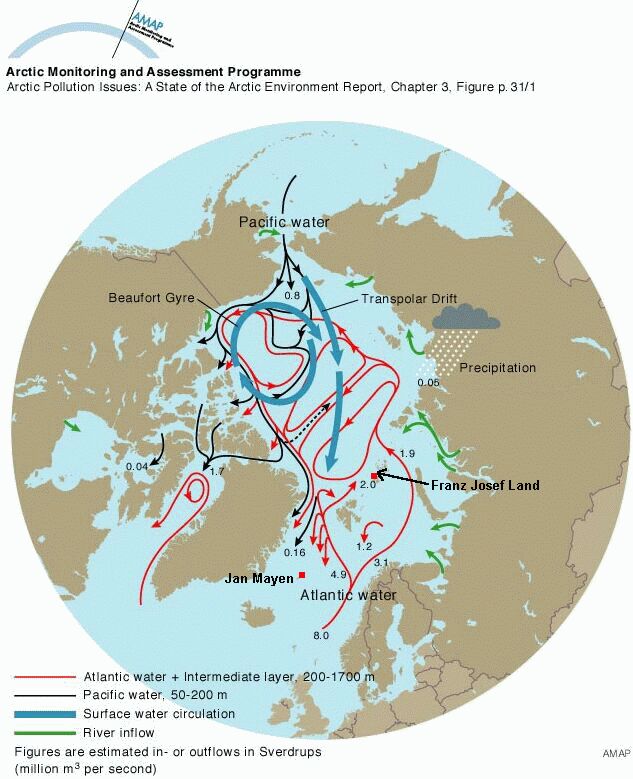
can result in the formation of Polynya;
http://en.wikipedia.org/wiki/Polynya
and causes the Equatorial Bulge:
http://en.wikipedia.org/wiki/Equatorial_bulge
Earth’s Rotational Energy influences Atmospheric Circulation;
http://en.wikipedia.org/wiki/Atmospheric_circulation
including the Jet Stream;
http://en.wikipedia.org/wiki/Jet_stream
Westerlies;
http://en.wikipedia.org/wiki/Westerlies
Tradewinds;
http://en.wikipedia.org/wiki/Trade_wind
Geostrophic Wind;
http://en.wikipedia.org/wiki/Geostrophic_wind
Surface Currents;
http://www.windows2universe.org/earth/Water/ocean_currents.html h
http://en.wikipedia.org/wiki/Ocean_current
through Ekman Transport;
http://en.wikipedia.org/wiki/Ekman_transport
http://oceanmotion.org/html/background/ocean-in-motion.htm
Tropical Cyclones;
http://en.wikipedia.org/wiki/Tropical_cyclone
Tornadoes:
http://en.wikipedia.org/wiki/Tornado
and Polar Vortices;
http://en.wikipedia.org/wiki/Polar_vortex
which “are caused when an area of low pressure sits at the rotation pole of a planet. This causes air to spiral down from higher in the atmosphere, like water going down a drain.”
http://www.universetoday.com/973/what-venus-and-saturn-have-in-common/
Here’s an animation of the Arctic Polar Vortex in Winter 2008 – 09:
When a Polar Vortex breaks down it causes a Sudden Stratospheric Warming:
http://en.wikipedia.org/wiki/Sudden_stratospheric_warming
Earth’s Rotational Energy influences Plate Tectonics;
http://en.wikipedia.org/wiki/Plate_tectonics
“By analyzing the minute changes in travel times and wave shapes for each doublet, the researchers concluded that the Earth’s inner core is rotating faster than its surface by about 0.3-0.5 degrees per year.
That may not seem like much, but it’s very fast compared to the movement of the Earth’s crust, which generally slips around only a few centimeters per year compared to the mantle below, said Xiaodong Song, a geologist at the University of Illinois at Urbana-Champaign and an author on the study.
http://www.livescience.com/9313-earth-core-rotates-faster-surface-study-confirms.html
The surface movement is called plate tectonics. It involves the shifting of about a dozen major plates and is what causes most earthquakes”:
http://en.wikipedia.org/wiki/Earthquake
Volcanoes;
http://en.wikipedia.org/wiki/Volcano
and Mountain Formation;
http://en.wikipedia.org/wiki/Mountain_formation
which can influence the creation of Atmospheric Waves:
http://en.wikipedia.org/wiki/Atmospheric_wave
Lastly, Rotational Energy is the primary driver of Earth’s Dynamo;
http://en.wikipedia.org/wiki/Dynamo_theory
which generates Earth’s Magnetic Field;
http://en.wikipedia.org/wiki/Earth%27s_magnetic_field
and is primarily responsible for the Earthy behaviors of the Magnetosphere;
http://en.wikipedia.org/wiki/Magnetosphere
with certain secular variations in Earth’s magnetic field originating from ocean flow/circulation;
http://news.nationalgeographic.com/news/2009/06/090622-earths-core-dynamo.html
http://iopscience.iop.org/1367-2630/11/6/063015/fulltext
though Leif Svalgaard notes that these are minor variations, as the magnetic field originating from ocean flow/circulation “is 1000 times smaller than the main field generated in the core.”
Also of note, “Over millions of years, [Earth’s] rotation is significantly slowed by gravitational interactions with the Moon: see tidal acceleration.
http://en.wikipedia.org/wiki/Tidal_acceleration
“The presence of the moon (which has about 1/81 the mass of the Earth), is slowing Earth’s rotation and lengthening the day by about 2 ms every one hundred years.”
“However some large scale events, such as the 2004 Indian Ocean earthquake, have caused the rotation to speed up by around 3 microseconds.[21] Post-glacial rebound, ongoing since the last Ice age, is changing the distribution of the Earth’s mass thus affecting the Moment of Inertia of the Earth and, by the Conservation of Angular Momentum, the Earth’s rotation period.”
http://en.wikipedia.org/wiki/Earth%27s_rotation
2. Orbital Energy, Orbital Period, Elliptical Orbits (Eccentricity), Tilt (Obliquity) and Wobble (Axial precession):
http://en.wikipedia.org/wiki/Specific_orbital_energy
http://en.wikipedia.org/wiki/Synodic
http://www.physicalgeography.net/fundamentals/6h.html
creates Earth’s seasons;
http://en.wikipedia.org/wiki/Season
which drives annual changes in Arctic Sea Ice;
and Antarctic Sea Ice;
the freezing and melting of which helps to drive the Thermohaline Circulation;
http://en.wikipedia.org/wiki/Thermohaline_circulation
and can result in the formation of Polynyas:
http://en.wikipedia.org/wiki/Polynya
Earth’s orbit around the Sun, Earth’s tilt, Earth’s wobble and the Moon’s orbit around Earth, Earth’s Rotation, and the gravity of the Moon, Sun and Earth, act in concert to determine the constantly evolving Tidal Force on Earth:
http://en.wikipedia.org/wiki/Tidal_force
This Tidal Force is influenced by variations in Lunar Orbit;
http://en.wikipedia.org/wiki/Orbit_of_the_Moon
as seen in the Lunar Phases;
http://en.wikipedia.org/wiki/Lunar_phase
Lunar Precession;
http://en.wikipedia.org/wiki/Lunar_precession
Lunar Node;
http://en.wikipedia.org/wiki/Lunar_node
Saros cycles;
http://en.wikipedia.org/wiki/Saros_cycle
and Inex cycles:
http://en.wikipedia.org/wiki/Inex
The combined cycles of the Saros and Inex Cycles can be visualized here:
http://eclipse.gsfc.nasa.gov/SEsaros/image/SEpanoramaGvdB-big.JPG
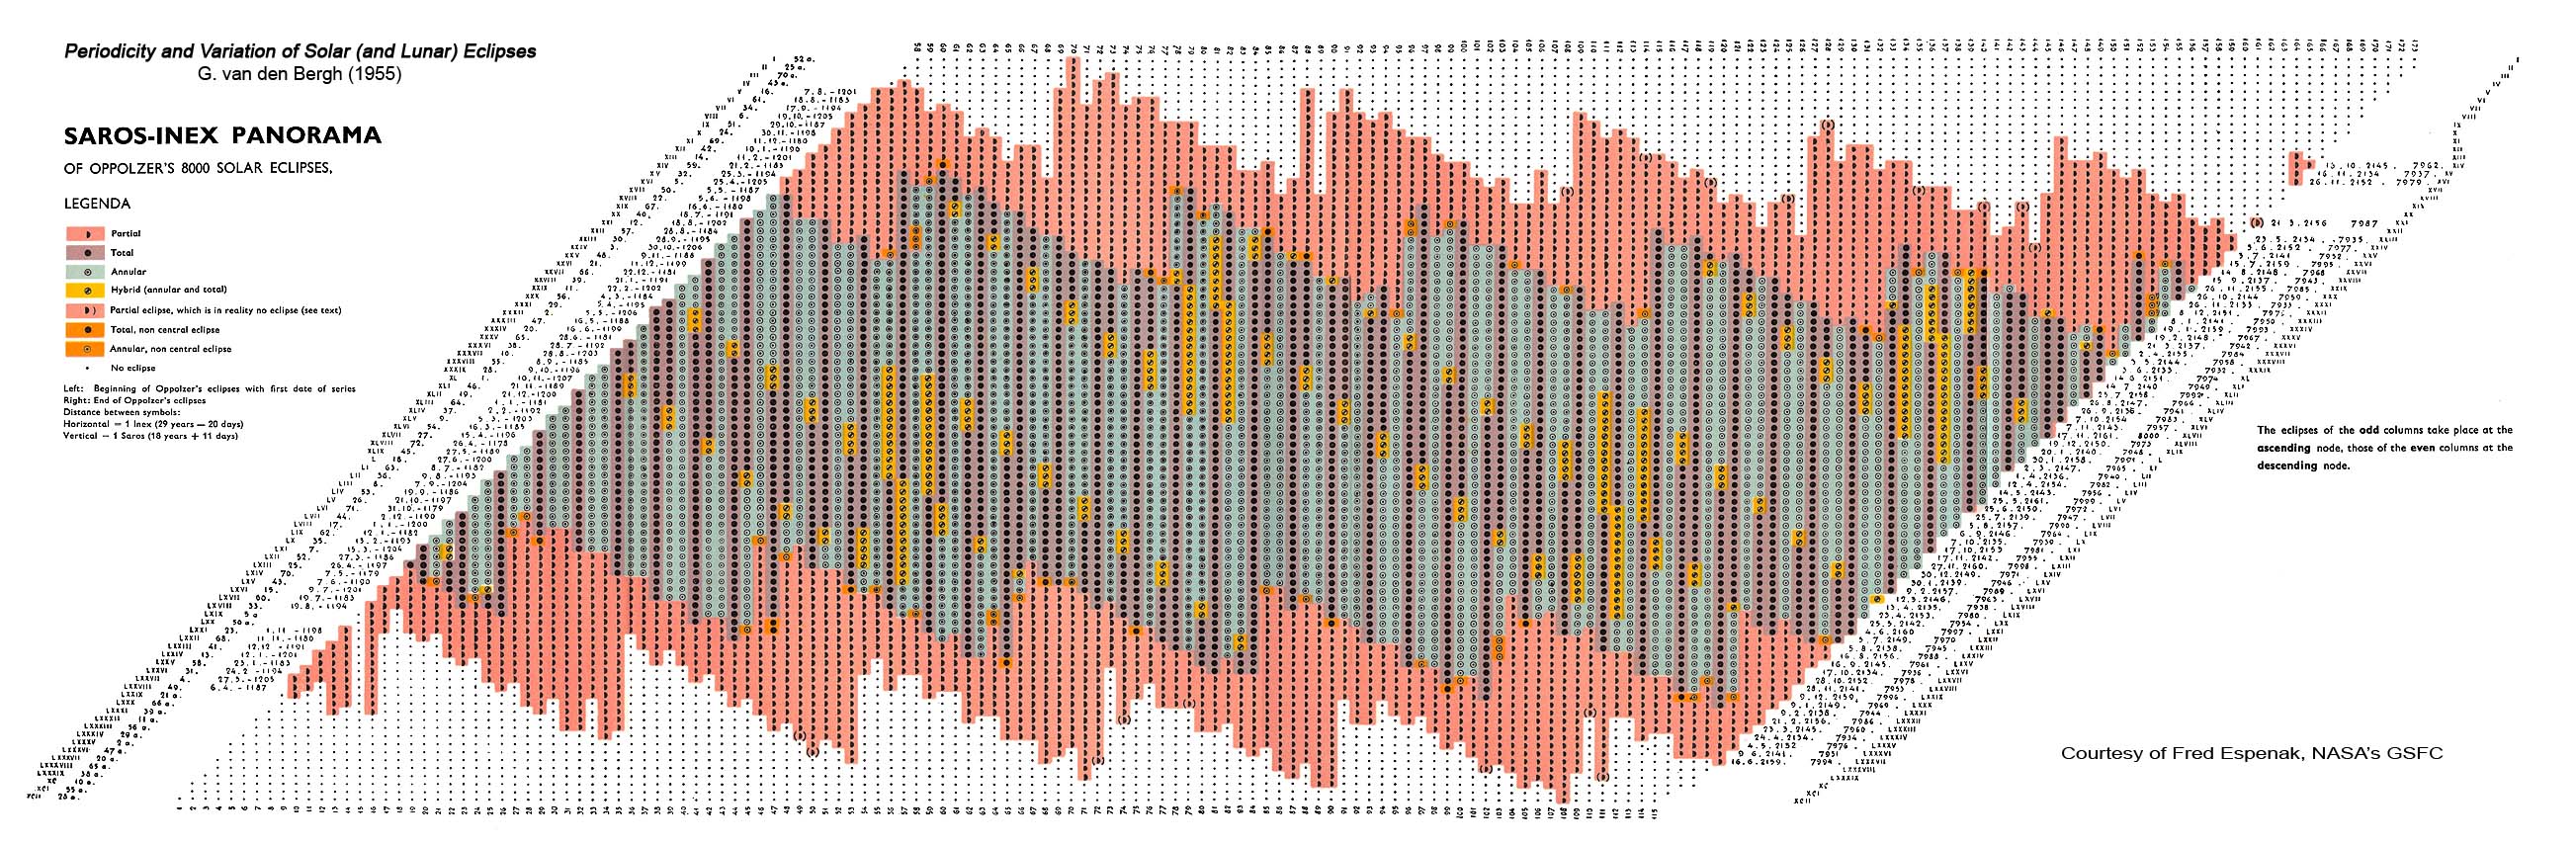
Over longer time frames changes to Earth’s orbit, tilt and wobble called Milankovitch cycles;
http://en.wikipedia.org/wiki/Milankovitch_cycles
may be responsible for the periods of Glaciation (Ice Ages);
http://www.homepage.montana.edu/~geol445/hyperglac/time1/milankov.htm
that Earth has experienced for the last several million years of its climatic record:
http://en.wikipedia.org/wiki/Ice_age
Also of note, over very long time frames, “the Moon is spiraling away from Earth at an average rate of 3.8 cm per year”;
http://en.wikipedia.org/wiki/Lunar_distance_%28astronomy%29
http://curious.astro.cornell.edu/question.php?number=124
3. Gravitation:
http://en.wikipedia.org/wiki/Gravitation
The gravity of the Moon, Sun and Earth, Earth’s rotation, Earth’s orbit around the Sun, Earth’s tilt, Earth’s wobble and the Moon’s orbit around Earth act in concert to determine the constantly evolving Tidal Force on Earth:
http://en.wikipedia.org/wiki/Tidal_force
This tidal force results in that result in Earth’s Ocean Tide;
http://en.wikipedia.org/wiki/Tide
http://www.themcdonalds.net/richard/astro/papers/602-tides-web.pdf
Atmospheric Tide;
http://en.wikipedia.org/wiki/Atmospheric_tide
and Magma Tide:
http://www.springerlink.com/content/h7005r0273703250/
Earth’s Gravity;
http://en.wikipedia.org/wiki/Convection#Gravitational_or_buoyant_convection
http://visibleearth.nasa.gov/view_rec.php?id=205
in concert with Tidal Forces, influence Earth’s Ocean Circulation;
http://www.eoearth.org/article/Ocean_circulation
which influences Oceanic Oscillations including El Niño/La Niña;
http://en.wikipedia.org/wiki/El_Ni%C3%B1o-Southern_Oscillation
the Pacific Decadal Oscillation (PDO);
http://en.wikipedia.org/wiki/Pacific_Decadal_Oscillation
the Atlantic Multi-Decadal Oscillation (AMO);
http://en.wikipedia.org/wiki/Atlantic_Multidecadal_Oscillation
the Indian_Ocean_Dipole (IOD)/Indian Ocean Oscillation (IOO) and;
http://en.wikipedia.org/wiki/Indian_Ocean_Dipole
can result in the formation of Polynyas:
http://en.wikipedia.org/wiki/Polynya
Gravity Waves;
http://en.wikipedia.org/wiki/Gravity_wave
which may be partially responsible for the Quasi-Biennial Oscillation (QBO);
http://en.wikipedia.org/wiki/Quasi-biennial_oscillation
“on an air–sea interface are called surface gravity waves or Surface Waves”;
http://en.wikipedia.org/wiki/Surface_wave
“while internal gravity waves are called Inertial Waves”:
http://en.wikipedia.org/wiki/Inertial_waves
“Rosby Waves;
http://en.wikipedia.org/wiki/Rossby_waves
Geostrophic Currents
http://en.wikipedia.org/wiki/Geostrophic
and Geostrophic Wind
http://en.wikipedia.org/wiki/Geostrophic_wind
are examples of inertial waves. Inertial waves are also likely to exist in the core of the Earth”
Earth’s gravity is the primary driver of Plate Tectonics;
http://en.wikipedia.org/wiki/Plate_tectonics
“The Slab Pull;
http://en.wikipedia.org/wiki/Slab_pull
force is a tectonic plate force due to subduction. Plate motion is partly driven by the weight of cold, dense plates sinking into the mantle at trenches. This force and the slab suction force account for most of the overall force acting on plate tectonics, and the Ridge Push;
force accounts for 5 to 10% of the overall force.”
Plate Tectonics drive “cycles of ocean basin growth and destruction, known as Wilson cycles;
http://csmres.jmu.edu/geollab/fichter/Wilson/Wilson.html
involving continental rifting;
http://en.wikipedia.org/wiki/Rift
seafloor-spreading;
http://en.wikipedia.org/wiki/Seafloor_spreading
subduction;
http://en.wikipedia.org/wiki/Subduction
and collision.”:
http://en.wikipedia.org/wiki/Continental_collision
“Climate change on ultra-long time scales (tens of millions of years) are more than likely connected to plate tectonics.”
“Through the course of a Wilson cycle continents collide and split apart, mountains are uplifted and eroded, and ocean basins open and close. The re-distribution and changing size and elevation of continental land masses may have caused climate change on long time scales”;
http://www.pbs.org/wgbh/nova/ice/chill.html
a process called the Supercontinent Cycle:
http://en.wikipedia.org/wiki/Supercontinent_cycle
Earth’s gravity is responsible for Katabatic Wind:
http://en.wikipedia.org/wiki/Katabatic_wind
4. Solar Energy;
http://en.wikipedia.org/wiki/Solar_energy
results is Solar Radiation/Sunlight;
http://en.wikipedia.org/wiki/Solar_radiation
which varies based upon 11 and 22 year cycles:
http://en.wikipedia.org/wiki/Solar_cycle
Total Solar Irradiance (TSI);
http://www.ngdc.noaa.gov/stp/solar/solarirrad.html
appears to fluctuate “by approximately 0.1% or about 1.3 Watts per square meter (W/m2) peak-to-trough during the 11-year sunspot cycle”:
http://en.wikipedia.org/wiki/Solar_variation
Solar Energy also drives the Hydrological/Water Cycle;
http://en.wikipedia.org/wiki/Hydrological_cycle
within the Hydrosphere;
http://en.wikipedia.org/wiki/Hydrosphere
as Total Solar Irradiance (TSI) causes evaporation;
http://en.wikipedia.org/wiki/Evaporation
that drives cloud formation;
http://en.wikipedia.org/wiki/Cloud
results in precipitation;
http://en.wikipedia.org/wiki/Precipitation_%28meteorology%29
that results in the Water Distribution on Earth;
http://en.wikipedia.org/wiki/Water_distribution_on_Earth
creates surface runoff;
http://en.wikipedia.org/wiki/Runoff_%28water%29
which result in rivers;
http://en.wikipedia.org/wiki/River
and drives erosion:
http://en.wikipedia.org/wiki/Erosion
Solar energy is also “The driving force behind atmospheric circulation is solar energy, which heats the atmosphere with different intensities at the equator, the middle latitudes, and the poles.”
http://www.scienceclarified.com/As-Bi/Atmospheric-Circulation.html
Atmospheric Circulation;
http://en.wikipedia.org/wiki/Atmospheric_circulation
includes Hadley Cells;
http://en.wikipedia.org/wiki/Hadley_cell
Ferrel Cells;
http://en.wikipedia.org/wiki/Atmospheric_circulation#Ferrel_cell
Polar Cells;
http://en.wikipedia.org/wiki/Polar_cells
and Polar Vortexes:
http://en.wikipedia.org/wiki/Polar_cells
all of which help to create Wind;
http://en.wikipedia.org/wiki/Wind
that influence Surface Currents;
http://www.windows2universe.org/earth/Water/ocean_currents.html
http://en.wikipedia.org/wiki/Ocean_current
through Ekman Transport;
http://en.wikipedia.org/wiki/Ekman_transport
http://oceanmotion.org/html/background/ocean-in-motion.htm
and also cause Langmuir circulations
http://en.wikipedia.org/wiki/Langmuir_circulation
Solar energy is also a driver of the Brewer-Dobson Circulation
http://en.wikipedia.org/wiki/Brewer-Dobson_circulation
Atmospheric Waves;
http://en.wikipedia.org/wiki/Atmospheric_wave
including Atmospheric Tides
http://en.wikipedia.org/wiki/Atmospheric_tide
as well as evaporation and condensation may help to drive changes in Atmospheric Pressure:
http://en.wikipedia.org/wiki/Atmospheric_pressure
http://www.atmos-chem-phys-discuss.net/10/24015/2010/acpd-10-24015-2010.pdf
Solar Ultraviolet (UV) radiation;
http://en.wikipedia.org/wiki/Ultraviolet
appears to vary by approximately 10% during the solar cycle;
http://www.nasa.gov/topics/solarsystem/features/solarcycle-sorce.html
has been hypothesized to influence Earth’s climate;
http://wattsupwiththat.com/2011/04/05/courtillot-on-the-solar-uv-climate-connection/
however Leif Svalgaard argues that,
This is well-trodden ground. Nothing new to add, just the same old, tired arguments. Perhaps a note on EUV: as you can see here (slide 13)
http://lasp.colorado.edu/sorce/news/2008ScienceMeeting/doc/Session1/S1_03_Kopp.pdf the energy in the EUV band [and other UV bands] is very tiny; many orders of magnitude less than what shines down on our heads each day. So a larger solar cycle variation of EUV does not make any significant difference in the energy budget.
http://wattsupwiththat.com/2011/04/05/courtillot-on-the-solar-uv-climate-connection/#comment-636477
Additionally variations in Ultraviolet (UV) radiation may influence the break down of Methane;
(Source TBD)
Infrared Radiation;
http://en.wikipedia.org/wiki/Infrared
Solar – Wind;
http://science.nasa.gov/science-news/science-at-nasa/1999/ast13dec99_1/
Solar – Coronal Holes;
http://helios.gsfc.nasa.gov/chole.html
Solar – Solar Energetic Particles (SEP);
http://helios.gsfc.nasa.gov/sep.html
Solar – Coronal Mass Ejection;
http://www.esa.int/esaSC/SEMF75BNJTF_index_0.html
http://www.ratedesi.com/video/v/8AuCE_NNEaM/Sun-Erupts-to-Life-Unleashes-a-Huge-CME-on-13-April-2010
Solar Magnetosphere Breach;
Solar Polar Field Reversal;
http://science.nasa.gov/science-news/science-at-nasa/2001/ast15feb_1/
Solar Sector Boundary;
http://science.nasa.gov/heliophysics/focus-areas/magnetosphere-ionosphere/
Grand Minimum;
Leif Svalgaard says: February 6, 2011 at 8:26 pm
If L&P are correct and sunspots become effectively] invisible [not gone] it might mean another Grand Minimum lasting perhaps 50 years. During this time the solar cycle is still operating, cosmic rays are still modulated, and the solar wind is still buffeting the Earth.”
“It will lead to a cooling of a couple of tenths of a degree.”
Solar Influences on Climate:
http://www.leif.org/EOS/2009RG000282.pdf
Statistical issues about solar–climate relations
http://www.leif.org/EOS/Yiou-565-2010.pdf
5. Geothermal Energy;
http://en.wikipedia.org/wiki/Geothermal_energy
influences Earth’s climate especially when released by Volcanoes;
http://en.wikipedia.org/wiki/Volcano
“which are generally found where tectonic plates are diverging;
http://en.wikipedia.org/wiki/Divergent_boundary
or converging”;
http://en.wikipedia.org/wiki/Convergent_boundary
however, “intraplate volcanism has also been postulated to be caused by mantle plumes”:
http://en.wikipedia.org/wiki/Mantle_plume
“These so-called “hotspots”;
http://en.wikipedia.org/wiki/Hotspot_%28geology%29
for example Hawaii, are postulated to arise from upwelling diapirs;
http://en.wikipedia.org/wiki/Diapir
from the core-mantle boundary, 3,000 km deep in the Earth.”
Volcanoes have been shown to influence Earth’s climate;
http://www.geology.sdsu.edu/how_volcanoes_work/climate_effects.html
http://www.longrangeweather.com/global_temperatures.htm
including in the infamous Year Without a Summer;
http://en.wikipedia.org/wiki/Year_Without_a_Summer
which was partially caused by the 1815 eruption of Mount Tambora;
http://en.wikipedia.org/wiki/1815_eruption_of_Mount_Tambora
and is called a Volcanic Winter:
http://en.wikipedia.org/wiki/Volcanic_winter
“Volcanic Ash;
http://en.wikipedia.org/wiki/Volcanic_ash
particles have a maximum residence time in the troposphere of a few weeks.
The finest Tephera;
http://en.wikipedia.org/wiki/Tephra
remain in the stratosphere for only a few months, they have only minor climatic effects, and they can be spread around the world by high-altitude winds. This suspended material contributes to spectacular sunsets.
“The greatest volcanic impact upon the earth’s short term weather patterns is caused by sulfur dioxide gas;”
http://en.wikipedia.org/wiki/Sulfur_dioxide
“In the cold lower atmosphere, it is converted to Sulfuric Acid;
http://en.wikipedia.org/wiki/Sulfuric_acid
sulfuric acid by the sun’s rays reacting with stratospheric water vapor to form sulfuric acid aerosol layers. The aerosol remains in suspension long after solid ash particles have fallen to earth and forms a layer of sulfuric acid droplets between 15 to 25 kilometers up. Fine ash particles from an eruption column fall out too quickly to significantly cool the atmosphere over an extended period of time, no matter how large the eruption.
Sulfur aerosols last many years, and several historic eruptions show a good correlation of sulfur dioxide layers in the atmosphere with a decrease in average temperature decrease of subsequent years. The close correlation was first established after the 1963 eruption of Agung volcano in Indonesia when it was found that sulfur dioxide reached the stratosphere and stayed as a sulfuric acid aerosol.
Without replenishment, the sulfuric acid aerosol layer around the earth is gradually depleted, but it is renewed by each eruption rich in sulfur dioxide. This was confirmed by data collected after the eruptions of El Chichon, Mexico (1982) and Pinatubo, Philippines (1991), both of which were high-sulfur compound carriers like Agung, Indonesia.”
http://volcanology.geol.ucsb.edu/gas.htm
There is also some evidence that if “volcanic activity was high enough, then a water vapor anomaly would be introduced into the lower stratosphere before the anomaly due to the previous eruption had disappeared. The result would be threefold in the long term: stratospheric cooling, stratospheric humidification, and surface warming due to the positive radiative forcing associated with the water vapor.”
See: http://journals.ametsoc.org/doi/pdf/10.1175/1520-0442(2003)016%3C3525%3AAGSOVE%3E2.0.CO%3B2#h1
Geothermic Energy can also warm the atmosphere through Hot Springs;
http://en.wikipedia.org/wiki/Hot_springs
Or warm the ocean through Hydrothermal Vents:
http://en.wikipedia.org/wiki/Hydrothermal_vent
Which can be a factor in Hydrothermal Circulations:
http://en.wikipedia.org/wiki/Hydrothermal_circulation
6. Outer Space/Cosmic/Galactic Influences;
http://en.wikipedia.org/wiki/Outer_space
http://en.wikipedia.org/wiki/Cosmos
http://en.wikipedia.org/wiki/Galaxy
including Asteroids;
http://en.wikipedia.org/wiki/Asteroid
Meteorites;
http://en.wikipedia.org/wiki/Meteorite
and Comets;
http://en.wikipedia.org/wiki/Comet
can all significantly impact Earth’s climate upon impact.
It has been hypothesized that Galactic Cosmic Rays;
http://en.wikipedia.org/wiki/Galactic_cosmic_ray
http://en.wikipedia.org/wiki/Cosmic_ray
modulated by Solar Wind, may influence cloud formation on Earth:
Galactic Magnetic Fields also result in the;
http://www.scholarpedia.org/article/Galactic_magnetic_fields
Galactic Tide;
http://en.wikipedia.org/wiki/Galactic_tide
which may influence the hypothesized Oort cloud;
http://en.wikipedia.org/wiki/Oort_Cloud
“Besides the galactic tide, the main trigger for sending comets into the inner Solar System is believed to be interaction between the Sun’s Oort cloud and the gravitational fields of near-by stars or giant molecular clouds.”
7. Magnetic Forces;
http://en.wikipedia.org/wiki/Earth%27s_magnetic_field
Earth Core Changes:
http://physicsworld.com/cws/article/news/42580
“appears to be generated in the Earth’s core by a dynamo process, associated with the circulation of liquid metal in the core, driven by internal heat sources”
impact the Magnetosphere;
http://en.wikipedia.org/wiki/Magnetosphere
including movement of the Geomagnetic Poles:
http://www.ngdc.noaa.gov/geomag/GeomagneticPoles.shtml
http://news.nationalgeographic.com/news/2009/12/091224-north-pole-magnetic-russia-earth-core.html
8. Atmospheric Composition
http://en.wikipedia.org/wiki/Atmosphere_of_Earth
Nitrogen (N2) represents approximately 780,840 ppmv or 78.084% of Earth’s Atmosphere;
http://en.wikipedia.org/wiki/Nitrogen
Oxygen (O2) represents approximately 209,460 ppmv or 20.946%;
http://en.wikipedia.org/wiki/Oxygen
Argon (Ar) represents approximately 9,340 ppmv or 0.9340%;
http://en.wikipedia.org/wiki/Argon
Carbon Dioxide (CO2) represents approximately 390 ppmv or 0.039%;
http://en.wikipedia.org/wiki/Carbon_dioxide
contributes to the Greenhouse Effect;
?
and
influences the rate of Plant Growth;
http://www.sjsu.edu/faculty/watkins/CO2plants.htm
Neon (Ne) represents approximately18.18 ppmv or 0.001818%;
http://en.wikipedia.org/wiki/Neon
Helium (He) represents approximately 5.24 ppmv (0.000524%);
http://en.wikipedia.org/wiki/Helium
Krypton (Kr) represents approximately 1.14 ppmv (0.000114%);
http://en.wikipedia.org/wiki/Krypton
Methane (CH4) represents approximately 1.79 ppmv (0.000179%);
http://en.wikipedia.org/wiki/Methane
contributes to the Greenhouse Effect;
?
Hydrogen (H2) represents approximately 0.55 ppmv (0.000055%);
http://en.wikipedia.org/wiki/Hydrogen
Nitrous Oxide (N2O) represents approximately 0.3 ppmv (0.00003%);
http://en.wikipedia.org/wiki/Nitrous_oxide
contributes to the Greenhouse Effect;
?
Ozone (O3) represents approximately 0.0 to 0.07 ppmv (0 to 7×10⁻⁶%);
http://en.wikipedia.org/wiki/Ozone
Nitrogen Dioxide (NO2) represents approximately 0.02 ppmv (2×10⁻⁶%) (0.000002%);
http://en.wikipedia.org/wiki/Nitrogen_dioxide
Iodine (I2) represents approximately 0.01 ppmv (1×10⁻⁶%) (0.000001%) and;
http://en.wikipedia.org/wiki/Iodine
Ammonia (NH3) represents a trace amount of Earth’s Atmosphere:
http://en.wikipedia.org/wiki/Ammonia
Additional atmosphere components includes Water vapor (H2O) that represents approximately 0.40% over full atmosphere, typically 1%-4% at surface.
http://en.wikipedia.org/wiki/Water_vapor;
Aerosols;
http://en.wikipedia.org/wiki/Aerosol
that “act as cloud condensation nuclei, they alter albedo (both directly and indirectly via clouds) and hence Earth’s radiation budget, and they serve as catalysts of or sites for atmospheric chemistry reactions.”
“Aerosols play a critical role in the formation of clouds;
http://en.wikipedia.org/wiki/Clouds
Clouds form as parcels of air cool and the water vapor in them condenses, forming small liquid droplets of water. However, under normal circumstances, these droplets form only where there is some “disturbance” in the otherwise “pure” air. In general, aerosol particles provide this “disturbance”. The particles around which cloud droplets coalesce are called cloud condensation nuclei (CCN) or sometimes “cloud seeds”. Amazingly, in the absence of CCN, air containing water vapor needs to be “supersaturated” to a humidity of about 400% before droplets spontaneously form! So, in almost all circumstances, aerosols play a vital role in the formation of clouds.”
http://www.windows2universe.org/earth/Atmosphere/aerosol_cloud_nucleation_dimming.html
Particulates;
http://en.wikipedia.org/wiki/Particulates
including Soot/Black Carbon;
http://en.wikipedia.org/wiki/Soot
http://en.wikipedia.org/wiki/Black_carbon
Sand;
http://en.wikipedia.org/wiki/Sand
Dust
http://en.wikipedia.org/wiki/Dust
“Volcanic Ash;
http://en.wikipedia.org/wiki/Volcanic_ash
particles have a maximum residence time in the troposphere of a few weeks.
The finest Tephera;
http://en.wikipedia.org/wiki/Tephra
remain in the stratosphere for only a few months, they have only minor climatic effects, and they can be spread around the world by high-altitude winds. This suspended material contributes to spectacular sunsets.
The major climate influence from volcanic eruptions is caused by gaseous sulfur compounds, chiefly Sulfur Dioxide;
http://en.wikipedia.org/wiki/Sulfur_dioxide
which reacts with OH and water in the stratosphere to create sulfate aerosols with a residence time of about 2–3 years.”
“Emission rates of [Sulfur Dioxide] SO2 from an active volcano range from 10 million tonnes/day according to the style of volcanic activity and type and volume of magma involved. For example, the large explosive eruption of Mount Pinatubo on 15 June 1991 expelled 3-5 km3 of dacite magma and injected about 20 million metric tons of SO2 into the stratosphere. The sulfur aerosols resulted in a 0.5-0.6°C cooling of the Earth’s surface in the Northern Hemisphere.”
http://volcanoes.usgs.gov/hazards/gas/index.php
“The 1815 eruption [of Mount Tambora] is rated 7 on the Volcanic Explosivity Index, the only such eruption since the Lake Taupo eruption in about 180 AD. With an estimated ejecta volume of 160 cubic kilometers, Tambora’s 1815 outburst was the largest volcanic eruption in recorded history.”
“The eruption created global climate anomalies that included the phenomenon known as “volcanic winter”;
http://en.wikipedia.org/wiki/Volcanic_winter
1816 became known as the “Year Without a Summer”;
http://en.wikipedia.org/wiki/Year_Without_a_Summer
because of the effect on North American and European weather. Agricultural crops failed and livestock died in much of the Northern Hemisphere, resulting in the worst famine of the 19th century.”
http://en.wikipedia.org/wiki/Mount_Tambora
“In the spring and summer of 1816, a persistent “dry fog” was observed in the northeastern US. The fog reddened and dimmed the sunlight, such that sunspots were visible to the naked eye. Neither wind nor rainfall dispersed the “fog”. It has been characterized as a stratospheric sulfate aerosol veil.”
“The greatest volcanic impact upon the earth’s short term weather patterns is caused by sulfur dioxide gas;”
http://en.wikipedia.org/wiki/Sulfur_dioxide
“In the cold lower atmosphere, it is converted to Sulfuric Acid;
http://en.wikipedia.org/wiki/Sulfuric_acid
sulfuric acid by the sun’s rays reacting with stratospheric water vapor to form sulfuric acid aerosol layers. The aerosol remains in suspension long after solid ash particles have fallen to earth and forms a layer of sulfuric acid droplets between 15 to 25 kilometers up. Fine ash particles from an eruption column fall out too quickly to significantly cool the atmosphere over an extended period of time, no matter how large the eruption.
Sulfur aerosols last many years, and several historic eruptions show a good correlation of sulfur dioxide layers in the atmosphere with a decrease in average temperature decrease of subsequent years. The close correlation was first established after the 1963 eruption of Agung volcano in Indonesia when it was found that sulfur dioxide reached the stratosphere and stayed as a sulfuric acid aerosol.
Without replenishment, the sulfuric acid aerosol layer around the earth is gradually depleted, but it is renewed by each eruption rich in sulfur dioxide. This was confirmed by data collected after the eruptions of El Chichon, Mexico (1982) and Pinatubo, Philippines (1991), both of which were high-sulfur compound carriers like Agung, Indonesia.”
http://volcanology.geol.ucsb.edu/gas.htm
There is also some evidence that if “volcanic activity was high enough, then a water vapor anomaly would be introduced into the lower stratosphere before the anomaly due to the previous eruption had disappeared. The result would be threefold in the long term: stratospheric cooling, stratospheric humidification, and surface warming due to the positive radiative forcing associated with the water vapor.”
See: http://journals.ametsoc.org/doi/pdf/10.1175/1520-0442(2003)016%3C3525%3AAGSOVE%3E2.0.CO%3B2#h1
9. Albedo
http://en.wikipedia.org/wiki/Albedo
“or reflection coefficient, is the diffuse reflectivity or reflecting power of a surface. It is defined as the ratio of reflected radiation from the surface to incident radiation upon it. Being a dimensionless fraction, it may also be expressed as a percentage, and is measured on a scale from zero for no reflecting power of a perfectly black surface, to 1 for perfect reflection of a white surface.”
Clouds
http://en.wikipedia.org/wiki/Clouds
Aerosols
http://en.wikipedia.org/wiki/Aerosol
“act as cloud condensation nuclei, they alter albedo (both directly and indirectly via clouds) and hence Earth’s radiation budget, and they serve as catalysts of or sites for atmospheric chemistry reactions.”
“Aerosols play a critical role in the formation of clouds. Clouds form as parcels of air cool and the water vapor in them condenses, forming small liquid droplets of water. However, under normal circumstances, these droplets form only where there is some “disturbance” in the otherwise “pure” air. In general, aerosol particles provide this “disturbance”. The particles around which cloud droplets coalesce are called cloud condensation nuclei (CCN) or sometimes “cloud seeds”. Amazingly, in the absence of CCN, air containing water vapor needs to be “supersaturated” to a humidity of about 400% before droplets spontaneously form! So, in almost all circumstances, aerosols play a vital role in the formation of clouds.”
http://www.windows2universe.org/earth/Atmosphere/aerosol_cloud_nucleation_dimming.html
Snow
Ice
Water
Particulates
http://en.wikipedia.org/wiki/Particulates
Soot/Black Carbon
http://en.wikipedia.org/wiki/Soot
http://en.wikipedia.org/wiki/Black_carbon
Algae (Ocean Surface)
10. Biology
http://en.wikipedia.org/wiki/Biology
“Phototrophs
http://en.wikipedia.org/wiki/Photoautotroph
are the organisms (usually plants) that carry out photosynthesis;
http://en.wikipedia.org/wiki/Photosynthesis
to acquire energy. They use the energy from sunlight to convert carbon dioxide and water into organic materials to be utilized in cellular functions such as biosynthesis and respiration.” “In plants, algae, and cyanobacteria, photosynthesis uses carbon dioxide and water, releasing oxygen as a waste product.”
Chemoautotrophs;
http://en.wikipedia.org/wiki/Chemotroph
are “organisms that obtain carbon through Chemosynthesis;
http://en.wikipedia.org/wiki/Chemosynthesis
are phylogenetically diverse, but groups that include conspicuous or biogeochemically-important taxa include the sulfur-oxidizing gamma and epsilon proteobacteria, the Aquificaeles, the Methanogenic archaea and the neutrophilic iron-oxidizing bacteria.”
Bacteria – TBD
Fungi – TBD
Protozoa – TBD
Chromista – TBD
Animal – Anthropogenic including:
Carbon Dioxide;
http://en.wikipedia.org/wiki/Carbon_dioxide
contributes to the Greenhouse Effect;
?
and
influences the rate of plant growth ;
http://www.sjsu.edu/faculty/watkins/CO2plants.htm
Methane
http://en.wikipedia.org/wiki/Methane
Nitrous Oxide
Ozone
Particulates, especially Black Carbon/Soot
Aerosols
Icebreakers/Arctic Shipping/Fishing/Cruise-Line Transits
Contrails
Nuclear Power Generation – Including Ships
Land Use Changes – Including De and Re-Forestation
Urban Heat Islands
Run Off From Asphalt/Urban Heat Islands
Fossil Fuel Energy Generation Waste Heat –
Renewables – Wind Farms, Solar Arrays, Dams and Ethanol
Sewage/Wastewater Treatment Discharge
etc.
Animal – Non-Anthropogenic including
Plankton
Beaver (Genus Castor)
http://en.wikipedia.org/wiki/Beaver
etc.
11. Chemical
Fossil Fuels:
Coal
Oil shale
Petrochemicals
– Petroleum
– Mineral Oil
Asphalt
Tar Pits/Sands
Methane
http://en.wikipedia.org/wiki/Methane
etc.
“Photosynthesis;
http://en.wikipedia.org/wiki/Photosynthesis
is a chemical process that converts carbon dioxide into organic compounds, especially sugars, using the energy from sunlight.”
“Chemosynthesis;
http://en.wikipedia.org/wiki/Chemosynthesis
is the biological conversion of one or more carbon molecules (usually carbon dioxide or methane) and nutrients into organic matter using the oxidation of inorganic molecules (e.g. hydrogen gas, hydrogen sulfide) or methane as a source of energy, rather than sunlight, as in photosynthesis.”
Reactions:
Combustion
– Forest Fires
– Fossil Fuels
– – Methane
http://en.wikipedia.org/wiki/Methane
etc.
Conversion of Methane, CO2, etc.
12. Physics – Other
Temperature
http://en.wikipedia.org/wiki/Temperature
Pressure
http://en.wikipedia.org/wiki/Pressure
States of Matter
http://en.wikipedia.org/wiki/State_of_matter
Heat Conduction
http://en.wikipedia.org/wiki/Heat_conduction
Convection
http://en.wikipedia.org/wiki/Convection
Thermal Radiation
http://en.wikipedia.org/wiki/Thermal_radiation
Thermodynamics
http://en.wikipedia.org/wiki/Laws_of_thermodynamics
-Entropy
http://en.wikipedia.org/wiki/Entropy
General summaries of the potential variables involved in Earth’s climate system;
http://www.physicalgeography.net/fundamentals/7y.html
http://oceanservice.noaa.gov/education/pd/climate/factsheets/whatfactors.pdf
Talking about the Arctic ; didn’t Morano tell us that the Arctice has rebounced ? Oh yes. Here it is :
http://www.climatedepot.com/a/11606/a/2226/a/2226/r/9706/Arctic-Ice-Volume-Has-Increased-26-Over-The-Last-Three-Years
Mmmm. funny that the links to the Arctic has rebounced point back to itself.
That seems so indicative of the sorry state of the self-proclaimed ‘skeptics’.
Don’t you guys have ANY science to back up your increasingly irrelevant opinion ?
Rob says: July 20, 2011 at 2:54 am
Talking about the Arctic… Don’t you guys have ANY science to back up your increasingly irrelevant opinion ?
You seem to be struggling to comprehend and respond to the question I posed, let’s try again. There is ample evidence that, “perennial sea ice covering the Arctic Ocean decreased by 23 percent during the past two winters as strong winds swept more Arctic ice than usual out Fram Strait near Greenland. The study relied on 50 years of data from the International Arctic Buoy Program, currently directed by Ignatius Rigor of the UW’s Applied Physics Laboratory, and eight years of data from NASA’s QuikScat satellite, a review of which was led by Son Nghiem of NASA’s Jet Propulsion Laboratory.”
“The most important thing about this paper is that it foretells this summer’s record minimum ice extent in the Arctic,” Rigor, a research scientist and co-author on the paper, says. “While the total area of ice cover in recent winters has remained about the same, during the past two years an increased amount of older, thicker perennial sea ice was swept by winds out of the Arctic Ocean into the Greenland Sea. What grew in its place in the winters between 2005 and 2007 was a thin veneer of first-year sea ice, which simply has less mass to survive the summer melt.”
http://uwnews.washington.edu/ni/article.asp?articleID=36894
Here’s the paper;
http://seaice.apl.washington.edu/
it states that “The winter AO-index explains as much as 64% of the variance in summer sea-ice extent in the Eurasian sector, but the winter and summer AO-indices combined explain less than 20% of the variance along the Alaskan coast, where the age of sea-ice explains over 50% of the year-to year variability. If this interpretation is correct, low summer sea-ice extents are likely to persist for at least a few years. However, it is conceivable that, given an extended interval of low-index AO conditions, ice thickness and summertime sea-ice extent could gradually return to the levels characteristic of the 1980′s.”
This 2011 paper submitted to The Cryosphere L. H. Smedsrud, et al.;
http://www.the-cryosphere-discuss.net/5/1311/2011/tcd-5-1311-2011-print.pdf
used “geostrophic winds derived from reanalysis data to calculate the Fram Strait ice area export back to 1957, finding that the sea ice area export recently is about 25 % larger than during the 1960’s.”
This paper;
http://journals.ametsoc.org/doi/abs/10.1175/1520-0442%282001%29014%3C3508%3AFSIFAA%3E2.0.CO%3B2
found that;
“Observations reveal a strong correlation between the ice fluxes through the Fram Strait and the cross-strait air pressure difference.”
“Although the 1950s and 1990s stand out as the two decades with maximum flux variability, significant variations seem more to be the rule than the exception over the whole period considered.”
“A noticeable fall in the winter air pressure of 7 hPa is observed in the Fram Strait and the Barents Sea during the last five decades.”
“The corresponding decadal maximum change in the Arctic Ocean ice thickness is of the order of 0.8 m. These temporal wind-induced variations may help explain observed changes in portions of the Arctic Ocean ice cover over the last decades. Due to an increasing rate in the ice drainage through the Fram Strait during the 1990s, this decade is characterized by a state of decreasing ice thickness in the Arctic Ocean.”
Even the Guardian reported that, “Much of the record breaking loss of ice in the Arctic ocean in recent years is down to the region’s swirling winds and is not a direct result of global warming, a new study reveals.”
http://www.guardian.co.uk/environment/2010/mar/22/wind-sea-ice-loss-arctic
Do you agree that the majority of the decrease in Arctic Sea Ice during the last decade wasn’t caused by Global Warming?
Atticus Dogsbody says: July 19, 2011 at 8:40 pm
I’ve read the thread
Did you learn anything?
Wikipedia still doesn’t count.
Count for what? It is simply an information source, and, as any other, should be viewed with healthy skepticism.
If you aren’t prepared to back up your assertions with real research and honest reporting
Hilarious, I researched and posted a list of climatic variables. This post and associated comments are the most link saturated I have ever seen. I’ve also built a number of WUWT’s reference pages;
http://wattsupwiththat.com/reference-pages/
so that the facts are readily available to anyone who wants to see them. Can you provide a link to what you consider to be an article that is backed up with “real research and honest reporting”?
then don’t expect to convince anybody who doesn’t inhabit your echo chamber.
You couldn’t have read this thread. Go read every comment in this thread by Leif Svalgaard and then please provide your definition of an “echo chamber”.
Leif Svalgaard says:
July 17, 2011 at 6:35 pm
The purpose of the exercise was to teach you about volumes. Let me repeat: take a bag with a volume of 1 cubic meter …
No, please don’t. I get so very bored with you avoiding the points I’m making, and am quite saddened there there are some who can’t see that this is what you are doing. There was a discussion not long ago where someone was saying about either Gavin or Trenberth or of their ilk, that they never answered the question asked of them, but would always sidestep it, tweak it around in a make-believe that the question was being answered, but it never was, exactly what you and some others I’ve come across do in these discussions.. You’re doing it here. To remind you for the last time, it is I who am teaching you about volumes, specifically, that real gases have this and you keep describing an imaginary world of ideal gas which doesn’t.. You have clearly shown zilch understanding of this because you’re confusing an imaginary ideal gas scenario of ideal gases taking up no room in empty space unconstrained except by mixing by bouncing off each other while travelling at great speeds, with the real physical world where gases have real volume which interact and are subject to constraints.
A f[*]rt does not travel across a room because of the imaginary movement of dimensionless molecules randomly bouncing off each other in all directions in empty space, but by convection through a fluid gas Air which has volume and weight because each gas molecule comprising it has volume and weight.
Encarta : volume 1. PHS SPACE INSIDE AN OBJECT the size of a three-dimensional space enclosed within or occupied by an object.
Encarta: weight 4. PHS FORCED CAUSED BY GRAVITY the vertical force experienced by a mass because of gravity.
COD: weight 1. Force with which body tends to centre of attraction, esp. (of terrestrial things) degree of downward tendency in body produced as resultant of earth’s gravitation and centrifugal force (the weight of a body varies with latitude and altitude but its mass does not)
Unless something is moving it the volume which is an individual gas molecule of or in Air is constrained by gravity and by the other volumes of molecules around it. Limitations imposed on movement or action, constraint, are relative.
Compare your descriptions of molecules with no properties taking only minutes to spread throughout a room as if ideal gases in empty space with the very clear description of Air as volumes of molecules coming back to rest after a sound wave has set them in motion. They do not move at great speeds through empty space, but are constrained by the volumes and weights of the other molecules adjacent to them. They may well be moving at great speeds on the spot, but not through the barrier of the very real physical volumes of gas molecules around them.
It takes work, energy, force, to set the individual volumes of molecules in motion through Air. The force which is weight of the heavier than air carbon dioxide volume displaces the air around it, it forces its way to the ground. It stays there unless a greater force moves it.
[Language. Robt]
Myrrh says:
July 21, 2011 at 8:33 pm
They do not move at great speeds through empty space, but are constrained by the volumes and weights of the other molecules adjacent to them. They may well be moving at great speeds on the spot, but not through the barrier of the very real physical volumes of gas molecules around them.
They are constrained by collisions with other molecules. As I demonstrated in the real gas Nitrogen, the volumes of all the molecules in one cubic meter is 0.00175 cubic meter, the rest , 0.99825 cubic meter, is empty space. For an ideal gas the volume of the molecules would have been 0.00000 cubic meter, the rest, 1.00000 cubic meter would have been empty space. So, you can see how close the real gas Nitrogen is to being ideal.
It takes work, energy, force, to set the individual volumes of molecules in motion
The correct statement is ‘to set the individual molecules in motion’ as it are the molecules that move, not their volume. And the molecules have that energy because they are not at absolute zero, in fact, one molecule has the energy 20.7 yJ per degree Kelvin of temperature. Here you can see the movements: http://upload.wikimedia.org/wikipedia/commons/6/6d/Translational_motion.gif
I’ve built out section “8. Atmospheric Composition”, detailed below. Please let me know any suggested additions, deletions or improvements:
8. Atmospheric Composition
http://en.wikipedia.org/wiki/Atmosphere_of_Earth
Nitrogen (N2) represents approximately 780,840 ppmv or 78.084% of Earth’s Atmosphere
http://en.wikipedia.org/wiki/Nitrogen
Oxygen (O2) represents approximately 209,460 ppmv or 20.946%:
http://en.wikipedia.org/wiki/Oxygen
Argon (Ar) represents approximately 9,340 ppmv or 0.9340%:
http://en.wikipedia.org/wiki/Argon
Carbon Dioxide (CO2) represents approximately 390 ppmv or 0.039%:
http://en.wikipedia.org/wiki/Carbon_dioxide
contributes to the Greenhouse Effect:
?
and
influences the rate of plant growth:
http://www.sjsu.edu/faculty/watkins/CO2plants.htm
Neon (Ne) represents approximately18.18 ppmv or 0.001818%;
http://en.wikipedia.org/wiki/Neon
Helium (He) represents approximately 5.24 ppmv (0.000524%);
<a href="http://en.wikipedia.org/wiki/Helium” rel=”nofollow”>http://en.wikipedia.org/wiki/Helium
Krypton (Kr) represents approximately 1.14 ppmv (0.000114%);
<a href="http://en.wikipedia.org/wiki/Krypton” rel=”nofollow”>http://en.wikipedia.org/wiki/Krypton
Methane (CH4) represents approximately 1.79 ppmv (0.000179%);
http://en.wikipedia.org/wiki/Methane
Hydrogen (H2) represents approximately 0.55 ppmv (0.000055%);
http://en.wikipedia.org/wiki/Hydrogen
Nitrous Oxide (N2O) represents approximately 0.3 ppmv (0.00003%);
http://en.wikipedia.org/wiki/Nitrous_oxide
Ozone (O3) represents approximately 0.0 to 0.07 ppmv (0 to 7×10⁻⁶%);
http://en.wikipedia.org/wiki/Ozone
Nitrogen Dioxide (NO2) represents approximately 0.02 ppmv (2×10⁻⁶%) (0.000002%);
http://en.wikipedia.org/wiki/Nitrogen_dioxide
Iodine (I2) represents approximately 0.01 ppmv (1×10⁻⁶%) (0.000001%) and;
http://en.wikipedia.org/wiki/Iodine
Ammonia (NH3) represents a trace amount of Earth’s Atmosphere:
http://en.wikipedia.org/wiki/Ammonia
Additional atmosphere components includes Water vapor (H2O) that represents approximately 0.40% over full atmosphere, typically 1%-4% at surface.
http://en.wikipedia.org/wiki/Water_vapor;
Aerosols;
http://en.wikipedia.org/wiki/Aerosol
that “act as cloud condensation nuclei, they alter albedo (both directly and indirectly via clouds) and hence Earth’s radiation budget, and they serve as catalysts of or sites for atmospheric chemistry reactions.”
“Aerosols play a critical role in the formation of clouds. Clouds form as parcels of air cool and the water vapor in them condenses, forming small liquid droplets of water. However, under normal circumstances, these droplets form only where there is some “disturbance” in the otherwise “pure” air. In general, aerosol particles provide this “disturbance”. The particles around which cloud droplets coalesce are called cloud condensation nuclei (CCN) or sometimes “cloud seeds”. Amazingly, in the absence of CCN, air containing water vapor needs to be “supersaturated” to a humidity of about 400% before droplets spontaneously form! So, in almost all circumstances, aerosols play a vital role in the formation of clouds.”
http://www.windows2universe.org/earth/Atmosphere/aerosol_cloud_nucleation_dimming.html
Particulates;
http://en.wikipedia.org/wiki/Particulates
including Soot/Black Carbon;
http://en.wikipedia.org/wiki/Soot
http://en.wikipedia.org/wiki/Black_carbon
Sand;
http://en.wikipedia.org/wiki/Sand
Dust
http://en.wikipedia.org/wiki/Dust
“Volcanic Ash;
http://en.wikipedia.org/wiki/Volcanic_ash
particles have a maximum residence time in the troposphere of a few weeks.
The finest Tephera;
http://en.wikipedia.org/wiki/Tephra
remain in the stratosphere for only a few months, they have only minor climatic effects, and they can be spread around the world by high-altitude winds. This suspended material contributes to spectacular sunsets.
The major climate influence from volcanic eruptions is caused by gaseous sulfur compounds, chiefly Sulfur Dioxide;
http://en.wikipedia.org/wiki/Sulfur_dioxide
which reacts with OH and water in the stratosphere to create sulfate aerosols with a residence time of about 2–3 years.”
“Emission rates of [Sulfur Dioxide] SO2 from an active volcano range from 10 million tonnes/day according to the style of volcanic activity and type and volume of magma involved. For example, the large explosive eruption of Mount Pinatubo on 15 June 1991 expelled 3-5 km3 of dacite magma and injected about 20 million metric tons of SO2 into the stratosphere. The sulfur aerosols resulted in a 0.5-0.6°C cooling of the Earth’s surface in the Northern Hemisphere.”
http://volcanoes.usgs.gov/hazards/gas/index.php
“The 1815 eruption [of Mount Tambora] is rated 7 on the Volcanic Explosivity Index, the only such eruption since the Lake Taupo eruption in about 180 AD. With an estimated ejecta volume of 160 cubic kilometers, Tambora’s 1815 outburst was the largest volcanic eruption in recorded history.”
“The eruption created global climate anomalies that included the phenomenon known as “volcanic winter”;
http://en.wikipedia.org/wiki/Volcanic_winter
1816 became known as the “Year Without a Summer”;
http://en.wikipedia.org/wiki/Year_Without_a_Summer
because of the effect on North American and European weather. Agricultural crops failed and livestock died in much of the Northern Hemisphere, resulting in the worst famine of the 19th century.”
http://en.wikipedia.org/wiki/Mount_Tambora
“In the spring and summer of 1816, a persistent “dry fog” was observed in the northeastern US. The fog reddened and dimmed the sunlight, such that sunspots were visible to the naked eye. Neither wind nor rainfall dispersed the “fog”. It has been characterized as a stratospheric sulfate aerosol veil.”
Sulfur
http://en.wikipedia.org/wiki/Sulfur
and Sulfuric Acid
http://en.wikipedia.org/wiki/Sulfuric_acid
justthefactswuwt – re the ? mark carbon dioxide and global warming contribution – I attempted an analysis here, http://wattsupwiththat.com/2011/05/30/skeptic-strategy-for-talking-about-global-warming/#comment-673855 to show that the basic AGW meme ‘that greenhouse gases cause warming’ is false, and even where there is acknowledgement that the main greenhouse gas is water vapour and its main role is in cooling our planet Earth, explanations are written in such a sleight of hand that this is obscured.
The meme as it is presented is that the earth would be colder without ‘greenhouse gases’, but the figure that is actually used for that comes from the Earth without an atmosphere, i.e. the classic science picture of all the gases in our atmosphere including oxygen and nitrogen comprising Earth’s Greenhouse and what the temp would be without this. Taking water out of this would give a temp of 67°C. cooling the Earth not warming it – and the difference with and without water is remarkable. Whatever ‘warming’ carbon dioxide is capable of – surely it can’t match the Sun’s heat and water shrugs that off…
Leif – you’re talking gibberish. Molecules take up space, real molecules that is. Earth’s atmosphere at the surface is at 15°C is 78% nitrogen 21% oxygen dry air, so less with water included. It is not empty space, it is not nothing. I’ve just had a thought, are you confused because gases are compressible?
Anyway, your and AGWScience’s imagining an atmosphere based on ideal gas properties, i.e., none, leads to the nonsense that keeps getting spouted by ‘warmists’ that gases can’t stratify and spontaneously thoroughly mix and can’t be unmixed for example above, clearly not what is observed in the real world. That these peculiar ideas exist at all in our day and age is a sad consequence of AGWScience influence in the education system especially in the last couple of decades. It’s from this use of ideal gas law mangling out of context of real world physical properties and deliberate exclusion of the full history of scientific knowledge to date, here van der Waals, elsewhere Arrenhius, which shows the duplicity of AGWScience. And shows that without the real basic understanding of properties and processes and relationships a warmist can’t get to grips with how weather systems work, in which such aspects as convection and thermodynamics are essential knowledge..
Myrrh says:
July 24, 2011 at 7:34 pm
Leif – you’re talking gibberish. Molecules take up space, real molecules that is.
Perhaps you cannot read.
Leif Svalgaard says:
July 17, 2011 at 6:35 pm
“Recall that one molecule has a volume of 6.54E-29 cubic meter, so the total volume of all the molecules in that 1 cubic meter becomes 2.7E+25*6.54E-29 = 0.00175 cubic meter.”
So the real N2 molecule takes up 6.54E-29 cubic meter of space. Agree?
The volumes [=space] of all the molecules in one cubic meter of N2 is thus 0.00175 cubic meter. Agree?
“Meaning that there is 1 – 0.00175 = 0.99825 cubic meters not occupied by any molecules or by anything else, i.e. is empty.”
Agree?
“This matches well what the link to Van der Waals said about a real gas: ” In general, at normal laboratory temperatures and pressures, the atoms or molecules of a gas only occupy about 1/1000 of the volume of the gas, the rest being empty space”.”
Agree?
Leif – you’re talking gibberish, as usual, because you’re doing everything possible to detract from the point I’m making. Which is, that AGWScience is fiction. That its scenarios are built by taking laws out of context, of misattributing properties and processes and so on. You can’t argue for AGW as if its based on real science fact because its ‘scienc’e is fantasy., All I’m doing here, as you well know, is pointing out where izen’s particular nonsense came from. And, as usual, you have no answer for that.
http://wattsupwiththat.com/2011/06/30/earths-climate-system-is-ridiculously-complex-with-draft-link-tutorial/#comment-693457
izen says: The molecules of gas are moving at around 500m/s or about a THOUSAND miles an hour. There is no way with those velocities you will get gases stratifying out by weight within the first few miles of the atmosphere. If they did… O2 heaver than N2, we would be walking in a few inches of CO2 and with our heads in pure oxygen!
Not only does real life prove him wrong, well known in traditional science and industry that he is wrong, but still taught to juniors by experiments they can do themselves to know he is wrong.
http://wiki.answers.com/Q/Why_do_gases_have_weight
http://www.elmhurst.edu/~chm/vchembook/123Adensitygas.html density of gases
So there are two things of great importance here, the first is that izen believes in a science fiction fantasy world created by the AGWScience magisterium, actually believes it to be our physical reality, and the second, that because of this, izen has zilch appreciation of the actual real physical world around him.
And you, as you’ve shown here, can’t deal with that demonstrable truth either. What a waste, it seems to me, of an otherwise intelligent mind.
Myrrh says:
July 25, 2011 at 12:32 pm
Leif – you’re talking gibberish
A technical argument [especially with numbers and math] may to the unwashed masses look like gibberish…
where izen’s particular nonsense came from
izen is absolutely correct. Balloons and high-flying aircraft show that CO2 is well mixed up to at least 30 km altitude, regardless of what anybody [izen, you, me, …] think is going on.
But that and the issue about ideal vs. real gases are totally disconnected from AGW. Have nothing to do with AGW and is not a fiction invented by AGW people as this is basic physics known for a century.
Now,many people have problems with an argument chain with more than one link. So perhaps we take it one link at a time. You admitted that a real molecule has volume. I showed you that a real N2 molecule has a volume of 6.54E-29 cubic meter and asked you if you agreed. You avoided the question, so I ask again. If you disagree with the number I gave, what volume do you think the molecule has, if any?
justthefactswuwt – http:wattsupwiththat.com/reference-pages/enso/
Global Mean Sea Level Change Map with a “Correction” of 0.3 mm/year added May, 5th 2011, due to a “Glacial Isostatic Adjustment (GIA)” – 1993 to Present
Comes up page not found on the link to site – http://sealevel.colorado.edu/current/sl_noib.jpg (and not visible on your page).
Have you captured it anywhere?
A search in colorado.edu on all and variations in the title came up blank, google produced this page from colorado.edu http://sealevel.colorado.edu/
and some others from the time
http://radio4scienceboards.proboards.com/index.cgi?board=witter&action=display&thread=116&page=4
[REPLY – I think the link you want is http://sealevel.colorado.edu/current/sl_noib_global.jpg
if I have understood you correctly. It comes up OK when I click on the graph. Don’t know why it didn’t work for you. Let us know if it still doesn’t work. – mj]
From the last site there’s a link to Steve Nerem’s announcement in May: http://sealevel.colorado.edu/content/new-web-site-new-sea-level-release
Well, that is weird. I can get your link, with its extra “global” in the url, but I’ve just tried again and I still get http://sealevel.colorado.edu/current/sl_noib.jpg when clicking directly on the empty space ..
I think you’re Ira Glickstein and you’re still interfering with my posting here as you began to do in your last discussion, abusing author privileges. Here, I have to painfully wait several seconds for each character to appear on the screen, elsewhere posting on WUWT I don’t…
So, it’s probably you responsible for the background tweaks, such as making this thread disappear from search, now re-instated since I mentioned it above, and my back links to posts in your discussions from other boards come up 404…?
Anthony has always appeared to me to be completely genuine – oblivious to how others see both Ira and Leif. I can’t believe he knows or fully appreciates the extent of this hijacking of his site. Or just how poisonous an influence they can be masquerading as friends..
I don’t know if this is something others with disagreements with either of these have perienced? Remind me Leif, who was it complained of your screwing up their website?
This interference in my posting is costing me money, I pay for access to the net, as well as stealing my time. This last sentence has taken around three minutes to appear, including correction time..
Myrrh says:
July 26, 2011 at 4:08 am
Remind me Leif, who was it complained of your screwing up their website?
Since I don’t screw up websites, I ignore such paranoid complaints.
Hmm, iirc, it was Vukcevic.
As for the rest of your inability to understand volumes in context of the point I’m making – sound doesn’t travel in your world of empty space and like the imaginary ideal gases that make it up, it only exists between your ears.
Myrrh says:
July 26, 2011 at 4:10 pm
Hmm, iirc, it was Vukcevic.
Can’t take him seriously on that.
As for the rest of your inability to understand volumes in context of the point I’m making – sound doesn’t travel in your world of empty space and like the imaginary ideal gases that make it up, it only exists between your ears.
Yes, sound does travel in both ideal and real gases by molecules getting a kick from some impulse and transmitting that kick to the next molecule it collides with [trillions of time per second]
Now back to your understanding of volume and space.
You admitted that a real molecule has volume. I showed you that a real N2 molecule has a volume of 6.54E-29 cubic meter and asked you if you agreed. You avoided the question, so I ask again. If you disagree with the number I gave, what volume do you think the molecule has, if any?
You avoided the question again. Either you don’t know or don’t like the answer. Which is it? or better yet: answer the simple question. Do you deny that a real N2 molecule has a volume of 6.54E-29 cubic meter?
Do stop pretending that you know what you’re talking about Leif, you’ve already shown you don’t understand volumes earlier here, when you said “air is a very high approximation to an ideal gas” and described “all gases are molecules/atoms that move around at typically 1000 miles/hour through empty space” and “It is moving at that speed all the time between collisions with other molecules which happens billions of times per second. These collisions change the direction of the molecules all the time so it takes some time to actually get to your window, but it will get there, and the speed would still be 1414 mph [at 15C]”
For anyone still thinking Leif knows what he’s talking about.. This is a description straight out of AGWscience’s manipulation of real science, AGWScience fiction taking ideal gas descriptions out of context..
What is so difficult to understand that the air around you is not empty space, but filled cheek by jowl with molecules taking up empty space? Real molecules have volume, you are describing movement of imaginary ideal gas molecules which don’t have volume, that is, they take up no space so imagined to have empty space all around them. These imaginary molecules don’t have weight, or interactions as attraction with other molecules, that’s why they’re described as bouncing off other molecules and so ‘mixing’ or ‘travelling’. Real gas molecules do not travel across the room from bumping into each other! That’s just stupid! Because they have real volume, real weight, are subject to real gravity, have real interactions with each other, attraction, not bouncing off each other like volumeless ideal imaginary gases, real gases don’t move at those speeds across a room. Real air is a volume of fluid, not empty space. The individual molecules are constrained by the volume of the molecules around them. There’s one ton/sq ft of this volume of liquid gas air pressing down on you now, and flowing around you whenever it is windy..
As I’ve given before, please, anyone still thinking Leif knows what he’s talking about, read the link, look at the pictures, understand that air is a fluid gaseous mass made up of real molecules with volume and not empty space – or we would not hear any sounds: http://www.mediacollege.com/audio/01/sound-waves.html
Until you, generic AGWScience believers, get to grips with the simple fact that the air around you is not empty space, but a real fluid gaseous entity with volume and weight, you will not be able to understand convection and so how heat is transferred through convection in our atmosphere of the fluid gas Air, and without that understanding you will not be able to appreciate how winds are formed, which are volumes of the gas Air on the move. And without that knowledge you won’t be able to understand that volumes of Air do not cross hemispheres, ‘winds’ do not thoroughly mix the gas molecules, etc. any more than the imaginary movement of ‘volumeless ideal gas molecules in empty space’ do. And if you can’t appreciate that simple physical real world basic, what the h*ll do you think are you are doing pontificating about climate?
AGWScience fiction has delibately confused you here. Don’t be confused further by self-professed ‘expert teachers’ who show as Leif does here, that he can’t deal with the true physical nature of our atmosphere, so spends his time obfuscating.
Izen, you can prove for yourself that heavier than air gases sink through air, and lighter than air gases rise in air – so you can see for yourself that your claim, the meme you’ve got from AGWScience fiction, that gases do not separate out –
The molecules of gas are moving at around 500m/s or about a THOUSAND miles an hour. There is no way with those velocities you will get gases stratifying out by weight within the first few miles of the atmosphere.
is nonsense.
Methane layers at the ceiling in mines, a well known hazard in this industry. Carbon dioxide layers at the ground, a well known hazard around volcanic vents and in brewing, and used in fire extinguishers because it will sink and displace the oxygen need to keep a fire burning. Real life, and real industry, applied science, contradicts the fictional world created by AGWScience.
The Carbon dioxide because heavier than air displaced all the oxygen and suffocated people and animals. It flowed, fluid gas, back down the slopes hugging the ground. This is a typical hazard around volcanic vents, such as in Hawaii, the carbon dioxide flows down into hollows where it will stay, because heavier than air, until another force moves it, such as wind. Each individual molecule does this, it is when there are many such molecules together doing this that they present a hazard.
This AGW science fiction world is a deliberate creation to dumb down the general population – there are too many such manipulations of basic physical knowledge for it to be a co-incidence. It takes a very good knowledge of real physics to be able to create these subtle tweaks by cherry picking properties and processes and history out of context. If that doesn’t make you angry, then you don’t fully appreciate the con.
The end.
Myrrh says:
July 27, 2011 at 3:14 am
Do stop pretending that you know what you’re talking about Leif
You can demonstrate that you know what you are talking about by responding to my probe:
“You admitted that a real molecule has volume. I showed you that a real N2 molecule has a volume of 6.54E-29 cubic meter and asked you if you agreed. You avoided the question, so I ask again. If you disagree with the number I gave, what volume do you think the molecule has, if any?
You avoided the question again. Either you don’t know or don’t like the answer. Which is it? or better yet: answer the simple question. Do you deny that a real N2 molecule has a volume of 6.54E-29 cubic meter?”
That you do not is telling enough.
All your examples are irrelevant to the debate. If left long enough all these gases would be mixed throughout the lower atmosphere by convection and eddy diffusion. The distinction between ideal and real gases is irrelevant for AGW as air is very close to an ideal gas.
Hello Leif
What are your thoughts on this one?:
Siliggy says: July 1, 2011 at 12:48 am
“appears to be generated in the Earth’s core by a dynamo process, associated with the circulation of liquid metal in the core, driven by internal heat sources”
or could be generated by the movement of sea water:
http://news.nationalgeographic.com/news/2009/06/090622-earths-core-dynamo.html
Here’s the associated paper:
http://iopscience.iop.org/1367-2630/11/6/063015/fulltext
Brent Hargreaves says: July 1, 2011 at 12:57 am
If you don’t mind I will send a hard copy to the UK government Chief Scientific Advisor. It’ll reduce him to tears.
Permission granted to all parties to print, copy, reproduce and distribute this document.
justthefactswuwt says:
July 28, 2011 at 9:24 pm
“What are your thoughts on this one?:
“appears to be generated in the Earth’s core by a dynamo process, associated with the circulation of liquid metal in the core, driven by internal heat sources”
or could be generated by the movement of sea water
There are electric current in sea water that create a magnetic field, but that field is 1000 times smaller than the main field generated in the core.
Siliggy says: July 1, 2011 at 12:48 am
“appears to be generated in the Earth’s core by a dynamo process, associated with the circulation of liquid metal in the core, driven by internal heat sources”
or could be generated by the movement of sea water:
http://news.nationalgeographic.com/news/2009/06/090622-earths-core-dynamo.html
It is not really a climate variable per se, but it is interesting and helpful in understanding magnetic field generation, thus I gave it an honorable mention under section “1. Earth’s Rotational Energy”;
Lastly, Rotational Energy is the primary driver of Earth’s Dynamo;
http://en.wikipedia.org/wiki/Dynamo_theory
which generates Earth’s Magnetic Field;
http://en.wikipedia.org/wiki/Earth%27s_magnetic_field
and is primarily responsible for the Earthy behaviors of the Magnetosphere;
http://en.wikipedia.org/wiki/Magnetosphere
with certain secular variations in Earth’s magnetic field originating from ocean flow/circulation;
http://news.nationalgeographic.com/news/2009/06/090622-earths-core-dynamo.html
http://iopscience.iop.org/1367-2630/11/6/063015/fulltext
though Leif Svalgaard notes that these are minor variations, as the magnetic field originating from ocean flow/circulation “is 1000 times smaller than the main field generated in the core.”
http://wattsupwiththat.com/2011/06/30/earths-climate-system-is-ridiculously-complex-with-draft-link-tutorial/#comment-707971
Espen says: July 1, 2011 at 1:26 am
My recent pet theory is that the whole idea of cooling from volcanoes may be wrong – their net effect may even be warming! What got me interested, is that the stratosphere showed a very clear stepwise cooling as an aftereffect of the stratospheric warming the El Chichon and Pinatubo eruptions: http://www.ssmi.com/data/msu/graphics/tls/plots/sc_Rss_compare_TS_channel_tls_v03_3.png
Interesting, the spikes in the lower stratosphere temperature record certainly correlate well with the drop in Apparent Atmospheric Transmission of Solar Radiation associated with the El Chichon and Pinatubo eruptions:
http://www.esrl.noaa.gov/gmd/webdata/grad/mloapt/mlo_transmission.gif
And the stepwise nature of the changes is visually apparent and apparently well recognized, e.g. “Stepwise changes in stratospheric temperature”:
http://europa.agu.org/?uri=/journals/gl/98GL51534.xml&view=article
I was wondering if this was due to destruction of ozone as the atmosphere “cleaned itself” after the eruptions, but yesterday I found a paper that may offer an explanation: One longer-time effect of the volcano eruptions was increased stratospheric water vapor.
”If the frequency of volcanic activity was high enough, then a water vapor anomaly would be introduced into the lower stratosphere before the anomaly due to the previous eruption had disappeared. The result would be threefold in the long term: stratospheric cooling, stratospheric humidification, and surface warming due to the positive radiative forcing associated with the water vapor.”
See: http://journals.ametsoc.org/doi/pdf/10.1175/1520-0442(2003)016%3C3525%3AAGSOVE%3E2.0.CO%3B2#h1
There appears to be ample evidence that Volcanoes release a lot of water vapor, i.e.; “Water vapor constitutes 70 to 95 percent of all eruption gases.”
http://volcanology.geol.ucsb.edu/gas.htm
and “A frost point hygrometer designed for aircraft operation was included in the complement of instruments assembled for the NASA U-2 flights through the plume of Mount St. Helens. Measurements made on the 22 May flight showed the water vapor to be closely associated with the aerosol plume. The water vapor mixing ratio by mass in the plume was as high as 40 x 10–6. This compares with values of 2 x 10⁻⁶to 3 x 10⁻⁶outside of the plume.”
http://www.sciencemag.org/content/211/4484/823.abstract
Additionally there does appear to be research that shows “a stratospheric cooling in regions of H2O increase, of magnitude similar to that due to stratospheric ozone loss indicating a significant additional cause of observed stratospheric temperature decreases. Radiative forcings are derived and it is found that global average radiative forcing due to stratospheric water vapour changes probably lies in the range 0.12 to 0.20 Wm(-2)decade(-1). This could have more than compensated for the negative radiative forcing due to decadal ozone loss.”
http://cel.webofknowledge.com/InboundService.do?SID=N18eGOad4FOh1mIa21f&product=CEL&UT=000166291200047&SrcApp=Highwire&Init=Yes&action=retrieve&SrcAuth=Highwire&customersID=Highwire&mode=FullRecord
This paper found that “Stratospheric water vapor concentrations decreased by about 10% after the year 2000. Here we show that this acted to slow the rate of increase in global surface temperature over 2000–2009 by about 25% compared to that which would have occurred due only to carbon dioxide and other greenhouse gases. More limited data suggest that stratospheric water vapor probably increased between 1980 and 2000, which would have enhanced the decadal rate of surface warming during the 1990s by about 30% as compared to estimates neglecting this change. These findings show that stratospheric water vapor is an important driver of decadal global surface climate change.”
http://www.sciencemag.org/content/327/5970/1219.full#ref-3
However, “The greatest volcanic impact upon the earth’s short term weather patterns is caused by sulfur dioxide gas;”
http://en.wikipedia.org/wiki/Sulfur_dioxide
“In the cold lower atmosphere, it is converted to Sulfuric Acid;
http://en.wikipedia.org/wiki/Sulfuric_acid
sulfuric acid by the sun’s rays reacting with stratospheric water vapor to form sulfuric acid aerosol layers. The aerosol remains in suspension long after solid ash particles have fallen to earth and forms a layer of sulfuric acid droplets between 15 to 25 kilometers up. Fine ash particles from an eruption column fall out too quickly to significantly cool the atmosphere over an extended period of time, no matter how large the eruption.
Sulfur aerosols last many years, and several historic eruptions show a good correlation of sulfur dioxide layers in the atmosphere with a decrease in average temperature decrease of subsequent years. The close correlation was first established after the 1963 eruption of Agung volcano in Indonesia when it was found that sulfur dioxide reached the stratosphere and stayed as a sulfuric acid aerosol.
Without replenishment, the sulfuric acid aerosol layer around the earth is gradually depleted, but it is renewed by each eruption rich in sulfur dioxide. This was confirmed by data collected after the eruptions of El Chichon, Mexico (1982) and Pinatubo, Philippines (1991), both of which were high-sulfur compound carriers like Agung, Indonesia.”
http://volcanology.geol.ucsb.edu/gas.htm
Per the Bulletin of the Global Volcanism Network (Atmospheric Effects);
http://www.volcano.si.edu/reports/bulletin/contents.cfm?issue=atmospheric
and Lidar measurements at Mauna Loa Observatory;
http://www.esrl.noaa.gov/gmd/images/mlo_lidar.jpg
both seem to indicate a large and lingering aerosol impact after the eruptions of El Chichón and Pinatubo.
Another factor in the the Bulletin of the Global Volcanism Network deserves attention, i.e. ” Major stratospheric warming evaporates aerosols”: http://www.volcano.si.edu/reports/bulletin/contents.cfm?issue=atmospheric#sean_1001
which was caused by the breakdown of the Southern Polar Vortex;
http://en.wikipedia.org/wiki/Sudden_stratospheric_warming
There seems to be evidence that Polar Vortices and Sudden Stratospheric Warming events can have a significant impact on water vapor, i.e. “A sudden and unexplained drop in the amount of water vapor present high in the atmosphere almost a decade ago has substantially slowed the rate of warming at Earth’s surface in recent years, scientists say.
In late 2000 and early 2001, concentrations of water vapor in a narrow slice of the lower stratosphere dropped by 0.5 parts per million, or about 10 percent, and have remained relatively stable since then. Because the decline was noted by several types of instruments, including some on satellites and others lofted on balloons, the sharp decrease is presumed to be real, says Karen Rosenlof, a meteorologist at NOAA’s Earth System Research Laboratory in Boulder, Colo.
And because water vapor is a powerful greenhouse gas, the decline has slowed the increase of global temperatures, Rosenlof, Susan Solomon, also of NOAA in Boulder, and their colleagues report online January 28 and in an upcoming Science.”
According to this paper on the Final Warming Date of the Antarctic Polar Vortex and Influences on its Interannual Variability;
http://findarticles.com/p/articles/mi_7598/is_20091115/ai_n42654411/
“several studies (including Waugh and Randel 1999; Waugh et al. 1999; Karpetchko et al. 2005; Black and McDaniel 2007) have indicated a trend over the 1980s and 1990s toward a later vortex breakdown.”
This is a good paper exploring the Polar Vortices;
http://www.columbia.edu/~lmp/paps/waugh+polvani-PlumbFestVolume-2010.pdf
and the chart on page 10 shows the vortex break-up dates for the Northern Hemisphere since 1960 and Southern Hemisphere since 1979.
This paper summarizes some of the differences between having a coalesced and uncoalesed polar vortex:
http://www.ace.uwaterloo.ca/publications/Manney-ExtremeArcticWinters_ACP.pdf
“The first three Arctic winters of the ACE mission represented two extremes of winter variability: Stratospheric sudden warmings (SSWs) in 2004 and 2006 were among the strongest, most prolonged on record; 2005 was a record cold winter.”
“Temperature and vortex evolution was very similar in the two years [2004 and 2006], with the vortex breaking down throughout the stratosphere, reforming quickly in the upper stratosphere, while remaining weak in the middle and (especially) lower stratosphere.”
“2005 was the coldest winter on record in the lower stratosphere, but with an early final warming in mid-March.”
“Disparate temperature profile structure and vortex evolution resulted in much lower (higher) temperatures in the upper (lower) stratosphere in 2004 and 2006 than in 2005. Satellite temperatures agree well with lidar data up to 50–60 km, and ACE-FTS, MLS and SABER show good agreement in high-latitude temperatures throughout the winters. Consistent with a strong, cold upper stratospheric vortex and enhanced radiative cooling after the SSWs, MLS and ACE-FTS trace gas measurements show strongly enhanced descent in the upper stratospheric vortex in late January through March 2006 compared to that in 2005.”
So could part of the warming in the 80s and 90s actually be caused by – and only briefly counteracted by! – the El Chichon and Pinatubo eruptions? I think so (but in the meantime AGW proponents are using volcano cooling for what it’s worth and even ignore the step change and talk about a downward “trend” in stratosphere temperatures as a “proof of AGW theory).
I think a “part of the warming in the 80s and 90s”could “be caused by – and only briefly counteracted by! – the El Chichon and Pinatubo eruptions”, but think that there is much more work to be done to figure out how big this part might be.
Just wanted to throw in yet another effect that may add to the complexity 😉
Most appreciated, under section “5. Geothermal Energy;” and ” 8. Atmospheric Composition” I adjusted the Volcano entries to read;
“Volcanic Ash;
http://en.wikipedia.org/wiki/Volcanic_ash
particles have a maximum residence time in the troposphere of a few weeks.
The finest Tephera;
http://en.wikipedia.org/wiki/Tephra
remain in the stratosphere for only a few months, they have only minor climatic effects, and they can be spread around the world by high-altitude winds. This suspended material contributes to spectacular sunsets.
“The greatest volcanic impact upon the earth’s short term weather patterns is caused by sulfur dioxide gas;”
http://en.wikipedia.org/wiki/Sulfur_dioxide
“In the cold lower atmosphere, it is converted to Sulfuric Acid;
http://en.wikipedia.org/wiki/Sulfuric_acid
sulfuric acid by the sun’s rays reacting with stratospheric water vapor to form sulfuric acid aerosol layers. The aerosol remains in suspension long after solid ash particles have fallen to earth and forms a layer of sulfuric acid droplets between 15 to 25 kilometers up. Fine ash particles from an eruption column fall out too quickly to significantly cool the atmosphere over an extended period of time, no matter how large the eruption.
Sulfur aerosols last many years, and several historic eruptions show a good correlation of sulfur dioxide layers in the atmosphere with a decrease in average temperature decrease of subsequent years. The close correlation was first established after the 1963 eruption of Agung volcano in Indonesia when it was found that sulfur dioxide reached the stratosphere and stayed as a sulfuric acid aerosol.
Without replenishment, the sulfuric acid aerosol layer around the earth is gradually depleted, but it is renewed by each eruption rich in sulfur dioxide. This was confirmed by data collected after the eruptions of El Chichon, Mexico (1982) and Pinatubo, Philippines (1991), both of which were high-sulfur compound carriers like Agung, Indonesia.”
http://volcanology.geol.ucsb.edu/gas.htm
There is also some evidence that if “volcanic activity was high enough, then a water vapor anomaly would be introduced into the lower stratosphere before the anomaly due to the previous eruption had disappeared. The result would be threefold in the long term: stratospheric cooling, stratospheric humidification, and surface warming due to the positive radiative forcing associated with the water vapor.”
See: http://journals.ametsoc.org/doi/pdf/10.1175/1520-0442(2003)016%3C3525%3AAGSOVE%3E2.0.CO%3B2#h1
Espen says: July 1, 2011 at 7:17 am
Do you know if there are any publicly available plotted time series of tropospheric water vapor? I can’t find any.
I haven’t seen a tropospheric time series, but this is a stratospheric water vapor time series
http://www.esrl.noaa.gov/gmd/images/water_vapor.jpg
based on NOAA’s Earth System Research Laboratory balloon program:
http://www.esrl.noaa.gov/gmd/ozwv/wvap/
The program measures Water Vapor Vertical Profiles in three locations, including Boulder, Colorado;
http://www.esrl.noaa.gov/gmd//webdata/ozwv/wvap/bld/iadv/2011-06-29.A.png
ftp://ftp.cmdl.noaa.gov/ozwv/water_vapor/Boulder_New/
Lauder, New Zealand;
http://www.esrl.noaa.gov/gmd/dv/iadv/graph.php?code=LDR&program=wvap&type=vp
ftp://ftp.cmdl.noaa.gov/ozwv/water_vapor/Lauder_New/
and Hilo, Hawaii:
http://www.esrl.noaa.gov/gmd/dv/iadv/graph.php?code=HIH&program=wvap&type=vp
ftp://ftp.cmdl.noaa.gov/ozwv/water_vapor/Hilo_New/
This paper, “Stratospheric water vapor trends over Boulder, Colorado: Analysis of the 30 year Boulder record”;
http://www.agu.org/pubs/crossref/2011/2010JD015065.shtml
notes that there is a “well-examined but unattributed 1980–2000 period of stratospheric water vapor growth. Trends are determined for five 2 km stratospheric layers (16–26 km) utilizing weighted, piecewise regression analyses. Stratospheric water vapor abundance increased by an average of 1.0 ± 0.2 ppmv (27 ± 6%) during 1980–2010 with significant shorter-term variations along the way. Growth during period 1 (1980–1989) was positive and weakened with altitude from 0.44 ± 0.13 ppmv at 16–18 km to 0.07 ± 0.07 ppmv at 24–26 km. Water vapor increased during period 2 (1990–2000) by an average 0.57 ± 0.25 ppmv, decreased during period 3 (2001–2005) by an average 0.35 ± 0.04 ppmv, then increased again during period 4 (2006–2010) by an average 0.49 ± 0.17 ppmv. The diminishing growth with altitude observed during period 1 is consistent with a water vapor increase in the tropical lower stratosphere that propagated to the midlatitudes. In contrast, growth during periods 2 and 4 is stronger at higher altitudes, revealing contributions from at least one mechanism that strengthens with altitude, such as methane oxidation. The amount of methane oxidized in the stratosphere increased considerably during 1980–2010, but this source can account for at most 28 ± 4%, 14 ± 4%, and 25 ± 5% of the net stratospheric water vapor increases during 1980–2000, 1990–2000, and 1980–2010, respectively.”