This simple visual analogy that Ron House has designed can help readers not familiar with a contentious atmospheric modeling issue get a primer on the it. While not a perfect analogy (and by definition analogies often aren’t) it does help convey an important point: the predicted red spot has not appeared. For the more technically inclined, or for those wanting more, Steve McIntyre posted an interesting discussion at Climate Audit. – Anthony
Guest Post by Ron House July 29, 2009
Let’s say it’s a cold night and Fred climbs into bed:
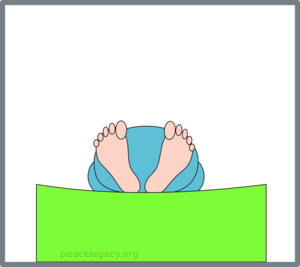 (A) Fred in bed.
Will Fred use a blanket to keep warm? If so, the air will heat up close to Fred because his body warms the air and the blanket prevents it from moving away. On the other hand, as the night progresses, the air beyond the blanket will cool:
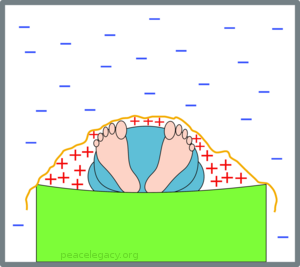 (B) With a blanket, the warm air collecting around Fred warms him up.
In the picture, the “+” signs show air that becomes warmer, and the “-” signs air that becomes cooler.
Now what if Fred (forgetful Fred) didn’t use a blanket? The warm air escapes and tends to rise (warm air being less dense than cold air):
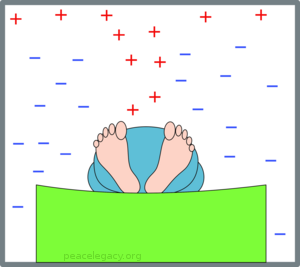 (C) With no blanket, warm air escapes and Fred shivers.
Poor Fred gets colder as the night wears on. But now we come to the point of the exercise: How do we know whether Fred used, or did not use, a blanket?
“Easy,” you say: “Take a look!” But let’s suppose that Fred is a very light sleeper, we dare not put on the light, so there’s no way we can see if there’s a blanket. But—surprise!—we just happen to have an infra-red scanner that can tell us the temperature of the air at various spots throughout the room. Depending on whether Fred uses a blanket, the temperature change in the room follows one of the two characteristic patterns we saw above; so if we check where the air gets colder and where it gets warmer as the night wears on, we know, for a fact, whether or not Fred used a blanket, even without being able to see it. If Fred did use a blanket, our scanner should show results like this (note how we can’t see the blanket, but we can be sure that it is there):
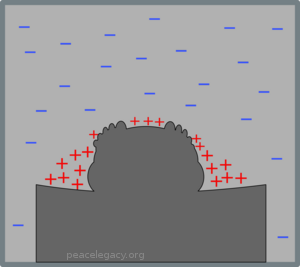 (D) Warm air collects in a contained region, so there must be a blanket.
On the other hand, if he does not use a blanket, we will see the temperature change in a pattern something like this:
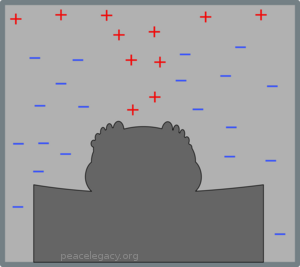 (E) Warm air escapes upwards, so we are sure there is no blanket.
Once again, there is no doubt at all what is going on. In science, nothing is absolutely certain, but depending on which temperature pattern develops, we can be very, very sure indeed of the answer to the question: Did Fred use a blanket?
Now we can turn to the global warming question, whether the Earth is surrounded by a ‘blanket’ of anthropogenic (human-generated) greenhouse gas stoking up the temperature of the planet. The physics of a real blanket (as with Fred in the fable above) and a gaseous ‘blanket’ around the Earth differ, but just the same, different heat dissipation (or retention) processes will result in different characteristic patterns of temperature change. Just as Fred will be surrounded by something roughly resembling one of two quite different patterns of air temperatures, so likewise will temperature changes around the Earth have a quite definite pattern, depending on which climate theory is right. Scientists whose paycheck does not depend on agreeing with global warming alarmism will all agree with this simple statement. It’s part of the basic skill of having a ‘nose’ for physics.
What, then, are our main competing climate theories? The IPCC’s reports are based on results from a collection of climate computer models; they have nothing else. These are simply computer programs that, in essence, contain a computerised version of the assumptions and beliefs of the climate modeller as to how the climate of the planet works. Whether these assumptions are well-founded is another question, but the key point is that whatever these assumptions may be, when the climate model is run, it generates its ‘predictions’ by calculation of hypothetical futures for the behaviour of the atmosphere. These ‘futures’ contain, as an essential element, predictions of the changes of atmospheric temperatures at various heights above the planet and the various latitudes all the way from south pole to north pole.
The indisputable fact about these atmospheric temperature predictions is that if the pattern doesn’t happen, the model is wrong. Just as Fred won’t warm up if he isn’t surrounded by warm air, likewise the effects on the Earth of global warming cannot happen if the cause of the warming —the warm air—isn’t there.
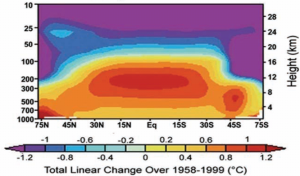
So now we come to the graphs that clinch the matter. All global warming models predict some sort of developing ‘hotspot’ in the atmosphere above the tropics. Here is the graph for one of the models, but they all look roughly similar:
(F) Model predicts air above the tropics heats up. from the NIPCC Report p. 107
This picture shows the air from 75 degrees north to 75 degrees south (the equator in the middle) and up to 30 km above the Earth. We can think of this air pattern as corresponding to the pattern in Fred’s bedroom when Fred used a blanket: although the actual mechanism is different, something is ‘keeping the heat in’, so to speak. Just as we did with Fred in bed, we can compare reality with this picture. Is the heat in the real atmosphere doing what the model predicts? Here is the temperature trend in the real world:
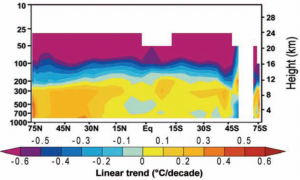 (G) Real world trend develops no hotspot. from the NIPCC Report p. 106
What have we actually proved here? Well, proved, without possibility of error, nothing, of course: no question at all about the real world ever has a complete perfect proof as an answer, so don’t be misled if someone says the world still might be heating due to CO2 despite the absence of the warm spot that is supposed to do the warming. Of course anything might be happening; but how likely is it? Well how likely is it that Fred has a blanket, but the air around him is getting colder just as if he had no blanket, and yet Fred is warming up despite that? The two questions have the same answer: not very.
Yet surprisingly, some proponents of global warming alarmism actually resort to this very strategy. “True,” they say, “the hot spot isn’t developing. But that is because the heat is being stored up elsewhere—it’s “in the pipeline”—and one day it will burst forth with even greater severity and vengeance.”
What can we make of that claim? Well, thinking back to Fred again, it amounts to this: We use our temperature probe in Fred’s darkened bedroom and we see a pattern like that in (E) above, corresponding to no blanket: Fred should be freezing! But actually, the heat has all gone into Fred’s body, despite the complete absence of the hot air which is the mechanism for making it do so. In other words, Fred got warmer by disobeying the second law of thermodynamics—in other words, by magic. Likewise, if someone says heat is being secretly stored somewhere by global warming, despite the absence of the very mechanism that does the warming, they are saying global warming is happening by magic. That is the harsh truth of the matter.
One thing I have learned whilst studying the global warming question is that, like many other physical systems, the climate is constrained by limits that can be understood by any intelligent person willing to learn some simple physics. The ‘hotspot’ is one of them. Anyone talking down to you and telling you you have to take the word of some mythical ‘consensus’ of ‘experts’ is trying to hoodwink you.
Let’s say it’s a cold night and Fred climbs into bed:
 (A) Fred in bed.
Will Fred use a blanket to keep warm? If so, the air will heat up close to Fred because his body warms the air and the blanket prevents it from moving away. On the other hand, as the night progresses, the air beyond the blanket will cool:
 (B) With a blanket, the warm air collecting around Fred warms him up.
In the picture, the “+” signs show air that becomes warmer, and the “-” signs air that becomes cooler.
Now what if Fred (forgetful Fred) didn’t use a blanket? The warm air escapes and tends to rise (warm air being less dense than cold air):
 (C) With no blanket, warm air escapes and Fred shivers.
Poor Fred gets colder as the night wears on. But now we come to the point of the exercise: How do we know whether Fred used, or did not use, a blanket?
“Easy,” you say: “Take a look!” But let’s suppose that Fred is a very light sleeper, we dare not put on the light, so there’s no way we can see if there’s a blanket. But—surprise!—we just happen to have an infra-red scanner that can tell us the temperature of the air at various spots throughout the room. Depending on whether Fred uses a blanket, the temperature change in the room follows one of the two characteristic patterns we saw above; so if we check where the air gets colder and where it gets warmer as the night wears on, we know, for a fact, whether or not Fred used a blanket, even without being able to see it. If Fred did use a blanket, our scanner should show results like this (note how we can’t see the blanket, but we can be sure that it is there):
 (D) Warm air collects in a contained region, so there must be a blanket.
On the other hand, if he does not use a blanket, we will see the temperature change in a pattern something like this:
 (E) Warm air escapes upwards, so we are sure there is no blanket.
Once again, there is no doubt at all what is going on. In science, nothing is absolutely certain, but depending on which temperature pattern develops, we can be very, very sure indeed of the answer to the question: Did Fred use a blanket?
Now we can turn to the global warming question, whether the Earth is surrounded by a ‘blanket’ of anthropogenic (human-generated) greenhouse gas stoking up the temperature of the planet. The physics of a real blanket (as with Fred in the fable above) and a gaseous ‘blanket’ around the Earth differ, but just the same, different heat dissipation (or retention) processes will result in different characteristic patterns of temperature change. Just as Fred will be surrounded by something roughly resembling one of two quite different patterns of air temperatures, so likewise will temperature changes around the Earth have a quite definite pattern, depending on which climate theory is right. Scientists whose paycheck does not depend on agreeing with global warming alarmism will all agree with this simple statement. It’s part of the basic skill of having a ‘nose’ for physics.
What, then, are our main competing climate theories? The IPCC’s reports are based on results from a collection of climate computer models; they have nothing else. These are simply computer programs that, in essence, contain a computerised version of the assumptions and beliefs of the climate modeller as to how the climate of the planet works. Whether these assumptions are well-founded is another question, but the key point is that whatever these assumptions may be, when the climate model is run, it generates its ‘predictions’ by calculation of hypothetical futures for the behaviour of the atmosphere. These ‘futures’ contain, as an essential element, predictions of the changes of atmospheric temperatures at various heights above the planet and the various latitudes all the way from south pole to north pole.
The indisputable fact about these atmospheric temperature predictions is that if the pattern doesn’t happen, the model is wrong. Just as Fred won’t warm up if he isn’t surrounded by warm air, likewise the effects on the Earth of global warming cannot happen if the cause of the warming —the warm air—isn’t there.
So now we come to the graphs that clinch the matter. All global warming models predict some sort of developing ‘hotspot’ in the atmosphere above the tropics. Here is the graph for one of the models, but they all look roughly similar:
 (F) Model predicts air above the tropics heats up. from the NIPCC Report p. 107
This picture shows the air from 75 degrees north to 75 degrees south (the equator in the middle) and up to 30 km above the Earth. We can think of this air pattern as corresponding to the pattern in Fred’s bedroom when Fred used a blanket: although the actual mechanism is different, something is ‘keeping the heat in’, so to speak. Just as we did with Fred in bed, we can compare reality with this picture. Is the heat in the real atmosphere doing what the model predicts? Here is the temperature trend in the real world:
 (G) Real world trend develops no hotspot. from the NIPCC Report p. 106
What have we actually proved here? Well, proved, without possibility of error, nothing, of course: no question at all about the real world ever has a complete perfect proof as an answer, so don’t be misled if someone says the world still might be heating due to CO2 despite the absence of the warm spot that is supposed to do the warming. Of course anything might be happening; but how likely is it? Well how likely is it that Fred has a blanket, but the air around him is getting colder just as if he had no blanket, and yet Fred is warming up despite that? The two questions have the same answer: not very.
Yet surprisingly, some proponents of global warming alarmism actually resort to this very strategy. “True,” they say, “the hot spot isn’t developing. But that is because the heat is being stored up elsewhere—it’s “in the pipeline”—and one day it will burst forth with even greater severity and vengeance.”
What can we make of that claim? Well, thinking back to Fred again, it amounts to this: We use our temperature probe in Fred’s darkened bedroom and we see a pattern like that in (E) above, corresponding to no blanket: Fred should be freezing! But actually, the heat has all gone into Fred’s body, despite the complete absence of the hot air which is the mechanism for making it do so. In other words, Fred got warmer by disobeying the second law of thermodynamics—in other words, by magic. Likewise, if someone says heat is being secretly stored somewhere by global warming, despite the absence of the very mechanism that does the warming, they are saying global warming is happening by magic. That is the harsh truth of the matter.
One thing I have learned whilst studying the global warming question is that, like many other physical systems, the climate is constrained by limits that can be understood by any intelligent person willing to learn some simple physics. The ‘hotspot’ is one of them. Anyone talking down to you and telling you you have to take the word of some mythical ‘consensus’ of ‘experts’ is trying to hoodwink you.
I think I’ve got it!
If you put a blanket on a corpse it will NOT warm up. 🙂
Pamela Gray (19:25:47) :
I like your analogy of DB and whether GHG AGW is additive. Having earnt my living as a musician, if you have 2 trombones it is louder than 1. However, if 1 trombone is really going for it there are a lot of instruments that no matter how loud they are in themselves you won’t hear them, and more importantly the Trombone won’t be any louder.
So I think that whether 2 different sources of heat are additive is conditional.
“That laughable statement tells me straight away that you’ve never read any IPCC reports.”
Every time I’ve looked, the evidence that CO2 induced warming will be amplified by water vapor feedback has seemed to consist of models (generally computer simulations) which (1) assume a lot of feedback; and (2) fit some historical measurements.
Of course that’s not real evidence. But if you have some real evidence, I would be very interested to see it.
M. Simon (19:55:39) : I don’t know of any immediate cure for envy. A deadly sin – according to some.
Aha, it hadn’t occurred to me some greenies could be motivated by plain envy, but it makes sense.
Glug,
I don’t know any more about McIntyres paper other than what I read on his website:
http://www.climateaudit.org/?cat=129
The Santer paper seems to be a rebuttal of Douglass et al who claimed model predictions diverged from observed data. Santer refer to this as the H2 hypothesis and claims that it does in fact conform to models because the observations lie within 2 sd of the observations. I do not find their findings convincing because all they are saying is effectively that model outputs are so varied that we can’t say they are inconsistent from observations. Yet their result rests right on the edge of 2 standard deviations. It seems to me that if you remove the outlier model and repeat the test then the observations would lie outside of the 2 standard deviations. McIntyre has also found that they terminated their observations in 1999 and if you use a more up to date dataset the H2 hypothesis is rejected.
Have you ever seen somebody lick the chutney spoon in an Indian Restaurant and put it back? This would never have happened under the Tories.
This info on the atmosphere is really good if you have not looked at the compostion, pressure profile and temperature profile of the atmosphere.
http://apollo.lsc.vsc.edu/classes/met130/notes/chapter1/history.html
**************************
Bob D (19:32:52) :
Jim (17:37:02) :Hey Stevo: …Convection produced clouds only go to the top of the troposphere. The temperature decreases steadily from the ground up to the tropopause. The temperature increases above that, but there is not much if any convection there that I can see any cause for at least.
This site has quite a good explanation of what Stevo is saying:
Greenhouse effect
****************************
Ok, the explanation given at the link at least makes some sense. This ***stuff*** about pressure (as in compression) causing the heating at the surface seems like BS to me. If the Earth were without atmosphere and suddenly the atmosphere fell on to the Earth, the atmosphere would heat due to the compression. But then it would cool off. The pressure would go down somewhat as it cooled but obviously the pressure before vs. after the event would be greater than zero.
Can the process explained at the link be modeled easily, i.e. from first physical principles?
I just realized I responded to the wrong person on an earlier post (I’m still learning here folks so please bear with me).
John F. Hultquist (08:45:50) :
Let me take a repeated stab at an explanation…
Consider the impact of CO2 alone. The earth absorbs energy from the Sun mostly in the visible part of the spectrum. Call this amount G. Earth’s temperature increases as a result. Anything with a temperature above 0 K emits power proportional to its absolute temperature to the fourth power. A steady earth “mean” temperature obtains when the emitted power (in the IR bands) equals the absorbed power from the Sun. In other words G is absorbed and G is radiated away. At present this “mean” temperature is about 288K or so.
Add CO2 or some other gas that absorbs heat radiation but is transparent to visible. Suppose the amount of heat radiation the CO2 absorbs is X. This absorption warms the gas until it also emits X, and the gas now reaches a steady temperature. The gas emits one-half of this X toward space and one-half toward earth. We can now look at the situation from two perspectives, either of which describes why the Earth becomes warmer.
1) The amount of downward power reaching the earth is now G+one-half X, which is larger than without CO2, so the earth must warm to emit the increased power and reach a new, slightly higher steady temperature.
2) With CO2 in place the absorbed solar power is still G, but the outgoing thermal power above the CO2 layer is G minus one-half of X. So there is an imbalance and the earth must increase its temperature to emit a little bit more power and achieve a balance again.
What Mr. House says here, in effect, is that all sorts of other processes go on beneath and within the CO2 “blanket” but the distribution of resulting temperature might provide a reasonable “fingerprint” of CO2 as a cause, yet no one can really be pinned down to say that “such and such” is a “fingerprint” of AGW and that it would provide a definitive test of the hypothesis.
==================
There have been several postings on this thread that the maximum Delta T occurs in Mid troposphere because of water vapor feedback, and wouldoccur in the presense of any cause. It is therefore not a true “fingerprint”. If anyone is still out there, I have a question.
Is the warming an effect of latent heat, which ties it firmly to water vapor, or is it the result of the new radiation balance in the atmosphere, which means it must also occur with lesser amplitude with just CO2?
I suppose I can go make several runs of MODTRAN at UofChicago to answer this, but I’d like to hear what someone thinks, or what they have read.
Steve in SC (18:17:14) :
> The atmosphere is essentially transparent.
Not true, at least not true at some IR and UV wavelengths. (Why would we evolve sensitivity to wavelengths that don’t illuminate the ground?)
True if you’re talking about visible wavelengths, opaque if you’re talking about the wavelengths in the CO2 and H2O absorption bands. Overall, only 15-30% of upward going thermal radiation makes it out on the first try.
See http://www.globalwarmingart.com/wiki/Image:Atmospheric_Transmission_png hanging off of my http://wermenh.com/climate/science.html
The whole mechanism of the greenhouse effect depends on the atmosphere _not_ being transparent!
Jim (05:17:42) : Can the process explained at the link be modeled easily, i.e. from first physical principles? I’ll take a stab at it, I may not have the semantics you want though. I think of it this way, all molecules above absolute zero have motion, or a mean free path if you will, that describes the space between the molecules. If you shrink this space (compression), the molecules collide more, creating friction and more heat.
The chinook winds show this, with a high pressure system west of the rockies and a low on the east side, the air is sucked over the mountains toward the low. The air is compressed as it descends the eastern slope and warms 4-5°F per 1000′ of descent.
Kevin Kilty (06:23:09) :
Is the warming an effect of latent heat, which ties it firmly to water vapor, or is it the result of the new radiation balance in the atmosphere, which means it must also occur with lesser amplitude with just CO2?
I suppose I can go make several runs of MODTRAN at UofChicago to answer this, but I’d like to hear what someone thinks, or what they have read.
Try realclimate.com
There was a spate of calculations that the hot spot should appear for any strong warming,
Apologies for length/multiplicity. It seems I have several comments to answer.
Jim,
“OK, I’ll bite. So you add 200 ppm to the atmosphere. The average emission altitude goes up. So what?”
The air at the average emission altitude settles at -24 C, to balance the heat coming from the sun. Above or below that altitude, the temperature changes at a constant rate. The further away from the average emission altitude you are, the warmer or cooler it is. So if the emission altitude moves further away from the surface, the surface will get warmer.
Doubling CO2 raises the emission altitude by about 160 m which changes the temperature at the surface by about 1 C. Changing CO2 by 40% changes temperature by about half that – ignoring all feedbacks and approximations.
“The extra 200 ppm of CO2 won’t add any significant pressure due to the extra gas.”
Correct.
It’s not CO2 that changes the pressure, it’s the altitude. The higher you go, the thinner the air is.
“If you are saying the extra CO2 will heat the air and thereby increase the pressure, OK.”
No, I’m not.
“Why doesn’t the convection upwards take away as much heat as was deposited by the sinking gas?”
It takes away more. But you have to be careful here because in thermodynamics ‘heat’ is not the same thing as ‘temperature’. In fact, the changes in temperature I’m talking about take place without adding or removing any heat – that’s what the word “adiabatic” means. The temperature changes because the compression does “work” on the gas. But I need to be very careful here because these words have technical meanings in thermodynamics that don’t exactly match their everyday meanings.
The air at the surface absorbs heat from it. It rises upwards, changing temperature but not exchanging any heat. And then it radiates the heat to outer space, cooling it even further.
“So just what is it about CO2; and how about CH4, that is assymmetrical. Explain how this assymetry is any different from the assymetry of O2 and N2.”
Sorry. I was trying to keep it simple.
Molecules can contain thermal energy in a number of ways. Translation, rotation, stretching/contracting, bending, or by different parts of the molecule rotating with respect to other parts. Each sort of motion has a set of characteristic frequencies, and all the motions contribute to its absorption/emission spectrum.
If you take an N2 molecule, it can translate, stretch, or rotate about two axes. But rotating about the long axis doesn’t change anything, and you can’t bend it.
CO2 has three atoms in a straight chain, which can also bend. The carbon atom can be off-centre from the straight line between the oxygen atoms. And the two bonds can stretch independently.
H2O has three atoms in a bent chain, which means that rotating it about the third axis is also meaningful.
A molecule interacts with an electromagnetic wave via the charge distribution around it. For example, in H2O the oxygen has a negative charge compared to the hydrogens, so an electric field will pull the oxygen one way while pushing the hydrogens the other. Similarly, in CO2 the oxygens tend to be more negative than the carbon. Essentially, the asymmetry in this case is that the molecule contains atoms of different elements instead of all the same element. Figuring out exactly what sort of motion corresponds to what absorption line is a bit technical. But as a general rule, the more “messy” – big, complicated, asymmetrical – a molecule is, the more ways it can move and therefore the more likely it is to absorb/emit. There are greater and lesser degrees of symmetry.
jim,
“Stevo – what you have said is interesting. If you would suffer one more questsion. I thought sunlight mostly passed through the atmosphere and was absorbed by the surface of the Earth, including the oceans – even there it eventually goes dark at some depth.”
Correct. It does.
“So the sunlight is absorbed and heats the Earth. I thought that is why the surface of the Earth is hot.”
The heat comes in, and almost exactly the same amount of heat goes out. Think of a river, flowing down into a lake behind a dam, and then over the spillway of the dam to continue down to the sea. The amount of water entering the lake is the same as the amount leaving it. If river flow in increased, the spillway flow out would increase too. The height of the lake surface depends on the height of the dam.
It’s actually a bit more complicated than that. I’m going to try to extend the analogy a bit, but if this doesn’t work for you, ignore it and stick with the basic dam.
Imagine that the river flowing in spins the lake water around in a whirlpool, so the water level is lower in the centre than at the edge. The outlet pipe sticks up into the lake about halfway between centre and edge. The water flows out of the lake through the pipe when the water at that point is higher than its top.
You are sat at the edge of the lake, and the water where you are is a lot higher than the top of the pipe, because of the whirlpool effect. But it’s stable, because if more water comes in, more will flow out through the pipe.
But now imagine that without changing its height, somebody moves the pipe nearer the centre of the lake. The whirling water is lower here, so it will stop flowing out until it has topped up a little. This will raise the water level throughout the lake, including at the edge where you are.
The whirl of the water acts like pressure, the variation in lake height is like the greenhouse effect, the pipe is like radiation of heat to space, the outside of the lake is the ground, and the centre is the top of the troposphere, and moving the pipe is like adding greenhouse gases.
“Again, why do you say it is pressure?
Pressure is the reason the surface is warmer than -24 C, which is the average temperature it would be if we had the same sun, but no atmosphere. It’s the average temperature on the moon, for example.
jim,
“Convection produced clouds only go to the top of the troposphere. The temperature decreases steadily from the ground up to the tropopause. The temperature increases above that, but there is not much if any convection there that I can see any cause for at least.”
Quite correct. The temperature rises partly because of the absorption of ultraviolet radiation by ozone, and partly because the outward heat flow is no longer strong enough to drive convection, so the old principle of hot air rising to the top applies.
Virtually all the heat emitted from the Earth (and hence all greenhouse effect physics) comes from the lowest layers. The upper layers don’t take much part because, while hotter, they’re much less dense. It’s essentially a hot vacuum, by human standards.
—-
Steven,
“Well, let’s give Stevo some credit here. Frankly, it’s the first time I’ve seen an AGW argument with a plausible mechanism and some data to support it.”
I think at this point I should firmly state that I’m a sceptic on catastrophic AGW. That CO2 will in principle raise temperatures is not really controversial – the question is whether it is significant compared to all the other natural drivers, whether it is the explanation of the observed warming, and whether feedbacks and delays mean it could be catastrophic. I disagree with the IPCC on all of that.
All I’m trying to do here is to correctly state the theory the IPCC et al are actually proposing – something they themselves are shockingly bad at. It’s possibly because doing so means changing their story, and opens up a whole new set of attacks, like is the adiabatic lapse rate really a constant? (The answer being: of course not.)
All the further questions about feedbacks and hotspots are still valid.
—-
Bob,
“This site has quite a good explanation of what Stevo is saying:
Greenhouse effect”
I only glanced at it, but I can tell you that their section on the “runaway greenhouse” is wrong. There’s no such thing. The surface of Venus is hot because it’s got high level opaque clouds, and an atmospheric pressure more than 90 times that on Earth. See my “fictional planet” above.
Incidentally, because the clouds on Venus reflect more light back, the total heat input from the sun is less there than it is on Earth, despite being closer in.
I think they get quite a lot of the rest of the explanation wrong, too. But a few bits are right. 🙂
>> Kevin Kilty (06:23:09) :
. . .
There have been several postings on this thread that the maximum Delta T occurs in Mid troposphere because of water vapor feedback, and wouldoccur in the presense of any cause. It is therefore not a true “fingerprint”. If anyone is still out there, I have a question.
Is the warming an effect of latent heat, which ties it firmly to water vapor, or is it the result of the new radiation balance in the atmosphere, which means it must also occur with lesser amplitude with just CO2?
I suppose I can go make several runs of MODTRAN at UofChicago to answer this, but I’d like to hear what someone thinks, or what they have read. <<
I like Kiehl and Trenberth (Earth’s Annual Global Mean Energy Budget) 1997, not because the numbers are particularly accurate, but because it represents the quintessential model of the Earth’s average energy flows. So according to Kiehl et al., the atmosphere receives 67 W/m^2 directly from the Sun, 24 W/m^2 from sensible heat flux, 78 W/m^2 from latent heat flux, and 350 W/m^2 from the surface. (The surface radiates 390 W/m^2 which is what a blackbody radiates at a temperature of 288K, and the other 40 W/m^2 escapes through the IR window.) This adds up to 519 W/m^2 that the atmosphere absorbs on average. The atmosphere doesn’t radiate one-half to space and one-half towards the surface. It’s more like two-fifths (195 W/m^2) upward to three-fifths (324 W/m^2) downward.
The latent and sensible heat fluxes are also called the Earth’s air conditioners, because they cool the surface and dump the energy directly into the atmosphere (increasing its temperature in the process).
Adding GHGs to the atmosphere primarily affects the IR window and may affect the upward-downward radiating ratio. Narrowing the IR window causes the surface temperature to rise, but the atmosphere’s temperature must rise faster (the hotspot). This is just the required response of the physical setup. For a surface temperature increase of x, the atmosphere’s temperature must increase at a minimum of 1.39x. If we apply the bulk aerodynamic formula to the sensible heat flux (as Kiehl et al. do) and increase the latent heat flux by the same percentage increase as the surface temperature, then the atmosphere’s temperature must increase by more than 1.60x.
By narrowing the IR window, I avoid all the arguments as to which GHG is doing the absorbing. Any GHG will narrow the IR window.
What this model is saying is that the current surface warming can’t be due to GHGs.
Jim
>> Ric Werme (06:54:24) :
Overall, only 15-30% of upward going thermal radiation makes it out on the first try. <<
According to Kiehl and Trenberth (1997), it’s more like 10% (40/390); however their calculation is badly flawed. Correcting their error, I get an IR window of about 22% (87/390). I can only find references to Kiehl et al. The default value for the IR window appears to be 40 W/m^2. Do you have another source for this value? I doubt that 40 W/m^2 is valid.
Jim
anna v (10:55:03) :
Kevin Kilty (06:23:09) :
Is the warming an effect of latent heat, which ties it firmly to water vapor, or is it the result of the new radiation balance in the atmosphere, which means it must also occur with lesser amplitude with just CO2?
I suppose I can go make several runs of MODTRAN at UofChicago to answer this, but I’d like to hear what someone thinks, or what they have read.
Try realclimate.com
Thanks, OK, I did, and as someone else on this thread said the issue is a change to the wet pseudo-adiabat. It thus involves additional water vapor which means that anything that causes the climate to warm, will, eventually, produce this signature, because water vapor (in the absolute measure) will increase. So, if we were to not observe this signature it would indicate that no real warming had occurred–for example, if the observed warming were the result of instrumentation errors.
Good analogy.
Here’s a question for you though regarding pressure (I’ve thought about this for a while and it confuses me) – If there was an atmosphere but no GHGs, wouldn’t the average emission level be at the surface, since nothing is preventing the emission of IR to space from the surface? Wouldn’t that then imply a surface temp of about 255K (ie: Ts=Te assuming e=0 by Stefan-Boltzmann), to ensure radiative balance? And wouldn’t that then determine the pressure (and volume) by PV=nR(255) because the atmosphere is free to expand or contract, in principle?
Maybe I’m missing something here. I’m aware the pressure (density) is partly determined (imposed) by gravity, so presumably the surface equilibrium temperature would end up higher than 255K, but then what about the radiative balance?
*****************************
Stevo (12:00:37) :
But you have to be careful here because in thermodynamics ‘heat’ is not the same thing as ‘temperature’. In fact, the changes in temperature I’m talking about take place without adding or removing any heat – that’s what the word “adiabatic” means. The temperature changes because the compression does “work” on the gas. But I need to be very careful here because these words have technical meanings in thermodynamics that don’t exactly match their everyday meanings.
***********************
Thanks, Stevo. I have had thermodynamics and do understand the meaning of adiabatic and heat vs. temperature. I still don’t get the pressure thing you talk about. I can see where adding some CO2 would raise the “zero point” where radiation in = radiation out (at least I think that is what you mean.) But I don’t see how that raises pressure. And even if you add 200 ppm CO2 suddenly and the atmosphere somehow compressed, the heat would eventually dissipate, the temperature and pressure would drop, then things would be in equilibrium again. That is, there would be no continuous compression – it would be a one off event.
It seems to me that once you have added enough carbon dioxide to make the atmosphere totally opaque in specific frequency ranges, you cannot make it more opaque in those bands by adding more CO2. All we can do is increase the thickness of the opaque zone.
According to the table presented by David Archibald, we have gotten almost all of the opacity from carbon dioxide that we will ever get. Even pure carbon dioxide gas is perfectly transparent to visible light.
There is a possibility that modern industrial activity is now adding other gasses that are extending the band of opacity. But so far, all the focus has been on controlling carbon dioxide.
BTW, William F. Ruddiman has presented a theory that greenhouse gasses generated at the onset of human farming, 8000 years ago, may have prevented a next scheduled ice age. Scientific American, March 2005.
P Wilson (14:19:07) :
“Stevo: I just had an email from the Met Office here in the UK in response to a question as to why temperatures plummeted during the solar eclipse. They categorically replied that “C02 doesn’t retain heat. It intercepts and transfers heat to the atmosphere” Therefore, despite C02 being the great climate driver, it tells the heat to go elsewhere, since C02 doesn’t seem to like absorbing heat.”
Is the Met Office suggesting that CO2 captures radiation from the sun (that has reached us through a vacuum and then passes that heat into the Nitrogen, Oxygen, water vapour and trace gases, so that the atmosphere warms? That flies in the face of the research of Count Rumford, a founder member of the Royal Institution, who designed efficient open fireplaces towards the end of the 18th century.
http://www.rumford.com/Rumford.html
Heat is transferred by conduction, convection and radiation. Rumford applied his knowledge of heat to the improvement of open fireplaces, so that fully 50% of the potential heat stored in timber was radiated out into the room. This radiation does NOT heat the air in the room, but warms solid items such as walls ceiling and floor, furniture and humans. Warmth imparted to the air happens by convection from warmed surfaces and these warmed surfaces such as a chair can also warm us by conduction, when we sit on it. That how bonfires warm us.
Infra red heating lamps do not heat the intervening airspace either, but you feel the heat on your body. Propane fired heaters radiate both visible light and infra red. Sunlight falling on solids and liquids warms them by radiation, with conduction transferring the heat in metals and convection in liquids. Theoretically, Mercury has both methods of heat transfer available to it.
This property of CO2 to capture radiated heat from the sun without itself heating up is astounding. By what mechanism is CO2 able to extract heat from sunlight passing through it, (a property that is not available to any other gas AFAIK). Then the CO2 gives this warmth to the other gases of the atmosphere!!!
I think we should rename this mighty overblown weather balloon of an organisation as the Meterological Office of Conitive Dissonance.
*********************
Bob D (17:06:35) :
Stevo (12:10:18) : The whirl of the water acts like pressure, the variation in lake height is like the greenhouse effect, the pipe is like radiation of heat to space, the outside of the lake is the ground, and the centre is the top of the troposphere, and moving the pipe is like adding greenhouse gases.
*************************
Actually, the analogy does not look so good to me, at least. When you move the pipe up in the dammed lake, you actually add mass to the vertical dimension. This accounts for the increase in pressure in the lake when the level gets higher. But moving the dynamic radiative equilibrium point higher in the atmosphere adds no mass. If you look at the ideal gas law, PV = nRT, an increase in temperature will result in an increase in the product of pressure and temperature. While the atmosphere is held down by gravity, it is not the same as being confined in a gas cylinder for example. So if T increases, V can increase and satisfy the ideal gas law. So you have not demonstrated that an increase in height of the radiative equilibrium point will increase pressure.
I found it! The missing red spot! Its on my nose from yesterday’s Sun! We can all rest now. CO2 has been proven.