From NOT A LOT OF PEOPLE KNOW THAT
By Paul Homewood

https://www.gov.uk/government/publications/electricity-generation-costs-2023
I asked DESNZ to send me their workings for the Levelised Generations Costs published last year. At the time, they put a cost of £114/MWh on CCGT, or £54/MWh excluding the irrelevant Carbon Cost).


I was particularly interested in what the costs would be based on current fuel costs.
The spreadsheet they sent me shows they have assumed operating efficiency of 53%. In other words to produce 1 MWh of electricity, you need to input 1.886 MWh of fuel.
Their original costings assumed a natural gas price of 64p/therm in 2025, falling to 56p in 2026, then rising back to 67p by 2049 (all at 2021 prices). The levelised costs are based on the cost over the 25-year lifetime of the plant.
The most recent DESNZ fossil fuel price assumptions, published in September, list a price next year of 75p, then dropping back to 70p. Prices after 2030 are highly subjective and should not really concern us, though DESNZ think they will drop further, notingthat increasing liquification capacity will put downward pressure on prices:
Remember these are all presented in real terms, at 2023 prices.

https://www.gov.uk/government/publications/fossil-fuel-price-assumptions-2024
If we plug in the 75p price for next year, we get a fuel cost of £48.29/MWh, compared to the figure of £43 in the Levelised Cost report.
Using 70p/therm, which looks to be representative of the next ten years or so, that cost drops to £45.07/MWh. That would indicate a total cost, excl Carbon Cost, of about £56/MWh.
Remember that the operational costs are still costed at 2021 prices, but they are small enough to make little difference.
It is these sort of costs that we need to be comparing with the known CfD prices for offshore wind, currently around £82/MWh.
Although I have dismissed Carbon Costs as not being a cost as such, it is worth noting that the Levelised Cost of £60/MWh for carbon implies a Carbon Price of about £174/tonne CO2. (Curiously the spreadsheet uses £83.03/tonne, giving a cost of £28.66/MWh.) Carbon Prices this year have been around £40/tonne, thus adding about £14/MWh to CCGT generation costs.
Given that gas power tends to set the wholesale market price of electricity, currently around £80/MWh, that £14 makes a big difference. Put another way, if the Carbon Pricing scheme was abolished, wholesale prices could potentially drop to £66/MWh.
I can email the spreadsheet to anybody interested.
DESNZ have not allowed for fuel costs when wind and solar are in unreliable mode i.e. 24/7/365 back up
Or, on the face of it, infrastructure costs, to move the power from where it’s generated to where it’s needed, which is often a much greater distance than existing technologies require.
When a solar “farm” was built next to my ‘hood in central Wokeachusetts, they needed to upgrade the power line to a main highway. (I fail to understand about power lines). For the new lines, running through the ‘hood, they needed new poles and they needed to cut down many large, old pine trees. Just an example on a small scale of the impact to people and their homes.
The fleet average efficiency is close on 50% according to the statistics. Chart includes coal and nuclear for comparison.
https://datawrapper.dwcdn.net/Br8Mc/2/
Peak efficiency will be somewhat higher (the best plants might manage over 60% run as baseload), but plant operates at reduced efficiency during ramping up and down to accommodate the solar duck curve and variable demand and wind output.
OCGT plant, which is the obvious low capital cost plant for covering peak demand, is around 37% efficient.
If the current green insanity continues, we will end up with diesel generators and OCGT plant being used to cover low renewables output with an overall increase in emissions.
What percentage effective utilisation have DESNZ used for solar and wind over their lifetime? This will have a large effect on the cost per MWh
Correct. I suspect they have failed to allow adequately for rising levels of curtailment as surpluses grow in size and frequency as more capacity is added. These can be highly damaging to output. For example, so far in 2024 the fairly new Seagreen wind farm has seen 2.4TWh of curtailment. That’s over 30% of its nominal capacity, and around 2/3rds of its potential output. So the real cost of the actual output in LCOE terms is around 3 times the nominal value.
This article is a confusing mess, and does not cover the A-to Z picture.
.
From:
BATTERIES IN NEW ENGLAND TO COUNTERACT A ONE-DAY WIND/SOLAR LULL FOR A MERE $456 BILLION
https://www.windtaskforce.org/profiles/blogs/batteries-in-new-england
.
Levelized Cost of Energy by US-EIA
Most people have no idea wind and solar systems need grid expansion/reinforcement and expensive support systems to exist on the grid.
.
With increased W/S percent on the grid, increased grid investments are needed, plus greater counteracting plant capacity, MW, especially when it is windy and sunny.
.
Increased counteracting of the variable W/S output, places an increased burden on the grid’s other generators, causing them to operate in an inefficient manner (more Btu/kWh, more CO2/kWh), which adds more cost/kWh to the offshore wind electricity cost of about 15 c/kWh, after 50% subsidies
.
The LCOE adders, for below items 2 through 5, are minimal until about 8% W/S on the grid, and become exponentially greater, with increased W/S on the grid
.
At about 25% W/S on the grid, these four LCOE adders total at least 5 c/kWh
.
The US-EIA, Lazard, Bloomberg, etc., and their phony LCOE “analyses”, are deliberately understating the cost of wind, solar and battery systems
.
Their LCOE “analyses” of W/S/B systems purposely exclude major LCOE items.
Their deceptions reinforced the popular delusion, W/S are competitive with fossil fuels, which is far from reality.
The excluded LCOE items are shifted to taxpayers, ratepayers, and added to government debts.
.
W/S would not exist without at least 50% subsidies
W/S output could not be physically fed into the grid, without the last four items. See list.
.
1) Subsidies equivalent to about 50% of project owning and operations cost,
2) Grid extension/reinforcement to connect remote W/S to load centers
3) A fleet of quick-reacting power plants to counteract the variable W/S output, on a less-than-minute-by-minute basis, 24/7/365, to avoid destabilizing the grid.
4) A fleet of power plants to provide electricity during low-W/S periods, and during high-W/S periods, when rotors are feathered and locked, to provide the electricity not produced by W/S systems, to meet demand.
5) Output curtailments to prevent overloading the grid relative to demand, i.e., paying owners for not producing what they could have produced
From your link:
Sounds like they ignorantly think with the batteries- the problem is solved. But since the battery power can’t last long- if it’s a major outage, then what? Just do without? For days, weeks or months? If that wouldn’t cause a revolution in the streets- nothing would.
A back of the envelope calculation shows that with a full wind/solar grid, the UK would’ve needed something like 650GWh of storage to make it through last Tuesday, and probably 4TWh for last week.
Cost of that above, roughly $195 billion and $1.2 trillion.
Clearly batteries cannot be the answer.
Hydrogen would be much worse than batteries, regardless of what the government idiots are saying, again A-to-Z basis
Same basic problem, they can’t do maths, I’m not great at the subject, but even with some simple addition/subtraction/multiplication, I still appear to understand the problem better than they do.
Just type convert 4TWh to kilotons into google…
Do you want te explosive power of a 4 megaton bomb sitting anywhere near you in a form that can be liberated extremely rapidly?
Coal is one think, inert uranium is another.
Even gas stored under the North sea is OK
But Batteries? Hydrogen? We’ve all seen what a small 100kWh battery can do in a bus.
4TWh simply doesn’t bear thinking about
BATTERIES IN NEW ENGLAND TO COUNTERACT A ONE-DAY WIND/SOLAR LULL FOR A MERE $456 BILLION
https://www.windtaskforce.org/profiles/blogs/batteries-in-new-england
I’ll give Elon Musk a call- he could probably cover half that. 🙂
From:
 ?itok=lxTa2SlF
BATTERY SYSTEM CAPITAL COSTS, OPERATING COSTS, ENERGY LOSSES, AND AGING
https://www.windtaskforce.org/profiles/blogs/battery-system-capital-costs-losses-and-aging
.
Utility-scale, battery system pricing usually is not made public, but for this system it was.
Neoen, in western Australia, has just turned on its 219 MW/ 877 MWh Tesla Megapack battery, the largest in western Australia.
Ultimately, it will be a 560 MW/2,240 MWh battery system, $1,100,000,000/2,240,000 kWh = $491/kWh, delivered as AC, late 2024 pricing. Smaller capacity systems will cost much more than $500/kWh
.
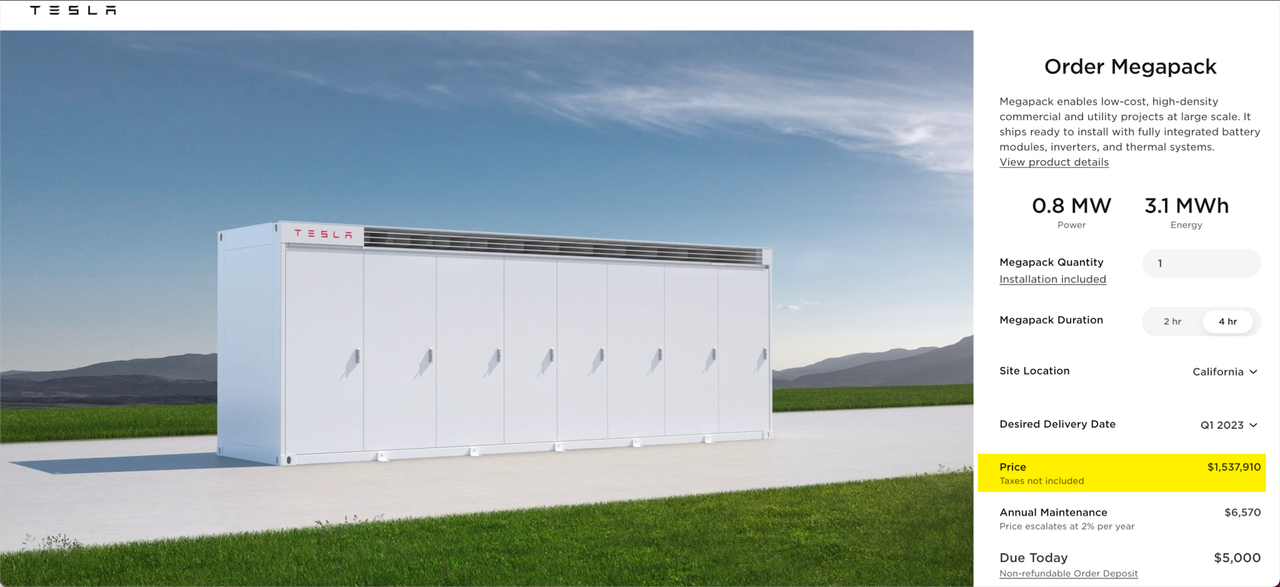
Example of Turnkey Cost of Large-Scale, Megapack Battery System, 2023 pricing
The system consists of 50 Megapack 2, rated 45.3 MW/181.9 MWh, 4-h energy delivery
Power = 50 Megapacks x 0.979 MW x 0.926, Tesla design factor = 45.3 MW
Energy = 50 Megapacks x 3.916 MWh x 0.929, Tesla design factor = 181.9 MWh
Estimate of supply by Tesla, $90 million, or $495/kWh. See URL
Estimate of supply by Others, $14.5 million, or $80/kWh
All-in, turnkey cost about $575/kWh; 2023 pricing
https://www.tesla.com/megapack/design
https://www.zerohedge.com/commodities/tesla-hikes-megapack-prices-commodity-inflation-soars
Annual Cost of Megapack Battery Systems; 2023 pricing
Assume a system rated 45.3 MW/181.9 MWh, and an all-in turnkey cost of $104.5 million, per Example 2
Amortize bank loan for 50% of $104.5 million at 6.5%/y for 15 years, $5.484 million/y
Pay Owner return of 50% of $104.5 million at 10%/y for 15 years, $6.765 million/y (10% due to high inflation)
Lifetime (Bank + Owner) payments 15 x (5.484 + 6.765) = $183.7 million
Assume battery daily usage for 15 years at 10%, and loss factor = 1/(0.9 *0.9)
Battery lifetime output = 15 y x 365 d/y x 181.9 MWh x 0.1, usage x 1000 kWh/MWh = 99,590,250 kWh to HV grid; 122,950,926 kWh from HV grid; 233,606,676 kWh loss
(Bank + Owner) payments, $183.7 million / 99,590,250 kWh = 184.5 c/kWh
Less 50% subsidies (ITC, depreciation in 5 years, deduction of interest on borrowed funds) is 92.3c/kWh
At 10% usage, (Bank + Owner) cost, 92.3 c/kWh
At 40% usage, (Bank + Owner) cost, 23.1 c/kWh
Excluded costs/kWh: 1) O&M; 2) system aging, 1.5%/y, 3) 19% HV grid-to-HV grid loss, 3) grid extension/reinforcement to connect battery systems, 5) downtime of parts of the system, 6) decommissioning in year 15, i.e., disassembly, reprocessing and storing at hazardous waste sites. The excluded costs add at least 15 c/kWh
COMMENTS ON CALCULATION
Almost all existing battery systems operate at less than 10%, per EIA annual reports i.e., new systems would operate at about 92.4 + 15 = 107.4 c/kWh. They are used to stabilize the grid, i.e., frequency control and counteracting up/down w/s outputs. If 40% throughput, 23.1 + 15 = 38.1 c/kWh.
A 4-h battery system costs 38.1 c/kWh of throughput, if operated at a duty factor of 40%.That is on top of the cost/kWh of the electricity taken from the HV grid to feed the batteries
Up to 40% could occur by absorbing midday solar peaks and discharging during late-afternoon/early-evening, which occur every day in California and other sunny states. The more solar systems, the greater the peaks.
See URL for Megapacks required for a one-day wind lull in New England
40% throughput is close to Tesla’s recommendation of 60% maximum throughput, i.e., not charging above 80% full and not discharging below 20% full, to achieve a 15-y life, with normal aging.
Tesla’s recommendation was not heeded by the Owners of the Hornsdale Power Reserve in Australia. They excessively charged/discharged the system. After a few years, they added Megapacks to offset rapid aging of the original system, and added more Megapacks to increase the rating of the expanded system.
http://www.windtaskforce.org/profiles/blogs/the-hornsdale-power-reserve-largest-battery-system-in-australia
Regarding any project, the bank and Owner have to be paid, no matter what. I amortized the bank loan and Owner’s investment
Divide total payments over 15 years by the throughput during 15 years, you get c/kWh, as shown.
There is about a 20% round-trip loss, from HV grid to 1) step-down transformer, 2) front-end power electronics, 3) into battery, 4) out of battery, 5) back-end power electronics, 6) step-up transformer, to HV grid, i.e., you draw about 50 units from the HV grid to deliver about 40 units to the HV grid, because of A-to-Z system losses. That gets worse with aging.
A lot of people do not like these c/kWh numbers, because they have been repeatedly told by self-serving folks, battery Nirvana is just around the corner.
Wikipedia says 64% for Thermal Efficiency of CCGT!
In base loaded mode, the 64% is possible, but not likely
In normal operating mode and W/S counteracting mode, the efficiency is less, say about 50%, still very good.
Turbines lose efficiency, if operated at part load; efficiency vs load is curving downward
And even at full load, gas turbines have a non-recoverable degradation over their lifetimes. You can recover some of the load loss with periodic overhauls, but they cannot recover all of the loss.
Every conversion has a loss
In propane fired, condensing heaters, at full load, the loss is about 5%, but on an annual average basis, the loss is about 15%
wilpost:
Agree.
As to LCOE, even the EIA admits you can’t really compare wind/solar with dispatchable sources.
Here is a quote from the EIA’s 2022 “Annual Energy Outlook”:
[ https://www.eia.gov/outlooks/aeo/electricity_generation.php ]
“Because load must be continuously balanced, generating units with the capability to vary output to follow demand (dispatchable technologies) generally have more value to a system than less flexible units that use intermittent resources to operate (resource-constrained technologies). We list the LCOE values for dispatchable and resource-constrained technologies separately because they require a careful comparison.”
“a careful comparison” indeed. That would only happen with a honest Red Team/Blue Team review.
Well that’s all fine and dandy except…
Gas Generation Plants last far longer than 25 years so…
They need to add replacement costs for both Wind (on and offshore) and Solar
That, and they also need to calculate the % of time that the gas plants are not running because renewables are. That % of the capex needs to be paid no matter what, usually in the form of higher prices from the gas operator. This is referred to as burdening the gas infrastructure without quite expaining what it means.
But if you want to get a true comparison, burden the renwables instead. Take that % of capex for idle gas and subtract it from the gas model. Add it to the renewables. Now you have recovery of capex based on gas to back up renewables. Then run a few scenarios. Gas is running 75% of the time, then 25% of the capex has to be burdened on renewables. If gas is running 25% of the time, then 75% of the capex must be added to renewables. If gas is running 5% of the time, then 95% of the capex must be added to renewables.
Which is why jurisidictions with high renewables penetration have high electricity costs. The more renewables you have, the higher the capex for the combined system must be,
Absolutely, that extra cost (fuel cost and idling costs) should be calculated with the cost of renewables because if renewables weren’t an option, the idling and associated portion of fuel costs wouldn’t be a factor.
In the UK grid we have the Capacity Market, which pays out for having capacity available to be called on. Recent auctions for capacity 4 years ahead have cleared around £70/kW/a, or £70m/GW/a, which should cover financing, depreciation and basic maintenance if a plant is allowed a full operation lifespan. Forecasts are that capacity market costs will exceed £4bn a year, which is a cost that should be accounted against renewables, I suspect it might run higher if plants are threatened with early closure in net zero by 2035 on the grid vanity.
Did you mean £70/MWh, instead of £70/kWh?
70/kWh would be grossly expensive. Using 1kWh per day £70/kWh would cost £2100 monthly
Neither. I meant what I wrote: £70/kW/a, or £70m/GW/a. A 1 GW plant would get £70m per year in payments for simply being available. It has nothing to do with how much it gets used or how much output it produces..
I see, thanks for splainin it
Fire up all fossil fuel and nuclear generators, build new fossil fuel and nuclear generators. Remove all wind and solar from the grid, remove all mandates for renewables. Keep the grid maintained and updated.
One of the main reasons, Europe is in such deep do-do, is the elites mistakenly thought W/S would be sufficient. They were advocating it for the whole world.
They knew storage would be expensive, and therefore kept minimizing needed storage capacity to get through W/S lulls
I pointed this out to numerous folks, with weather data, etc., and was laughed at, etc., way back in 2000.
Since 2020, the W/S system costs per installed MW have increased by at least 50 to 75%, plus grid extension/reinforcement, plus output counter-action, plus environmental damage, plus hazardous landfill .
W/S have become totally unaffordable!
It takes a long while for that reality to sink into the ossified brains of the bureaucrats, especially the ones in Brussels.
The UK is on a much higher level of stupidity than Brussels, but, as usual, they refuse to own up their stupidity; a mixture of stiff upper lip and not seeing the forest for the trees, for which no cure has been found yet.
A great ally for the US to get rid of…..
“That would indicate a total cost, excl Carbon Cost, of about £56/MWh.”
I don’t get this. The headline says:
“Updated CCGT Costs Confirmed As Much Cheaper Than Renewables”
But the figures for VRE are £44/MWh, £38/MWh, £41/MWh. How is that cheaper?
Maybe relative to the CfD bid price for offshore wind? Well, for a start you should compare on the same basis. A strike price for a CfD incorporates separate risk calculations. And offshore wind is the most expensive of the renewables.
You can always get the spreadsheets and do your own calculations
I’m not disputing Paul’s calculation (for now). But Paul has not produced a number that has gas cheaper than renewables. In fact, not one that is cheaper than the earlier DESNZ analysis.
Because currently operating CFDs pay over £150/MWh – and they will still be operating for some years yet, and the CFDs yet to come into operation are over £80/MWh for offshore wind (which is the bulk of the output). In any event, it is clear that DESNZ have failed to allow for curtailment. Just look at what happens to utility solar in Australia.
The CfDs cannot be compared with LCOE. LCOE, for example, does not include profit.
LCOE includes financing cost. That is often split between debt financing paying interest and equity finance, paying dividends. See for example this from Lazard, the high priests of LCOE fictions.
Those renewables need to be replaced 2-4 times over the potential life time of a gas generation plant which can be 60+ years with proper maintenance.
You give no backing for that claim. But construction and O&M are included, and make up almost the total of the renewable costs. For CCGT, cost of fuel is by far the largest part, and on its own matches the total cost of renewbles.
Sun and wind are free.
But harvesting them is expensive, and not just in monetary terms.
Yep, sun and wind are free. But both are fair weather dependant and can’t be depended on during inclement weather or Droll-Dums or, in the case of Solar, at night when the evening demand peaks.
Plus solar needs to be replaced with every bad Hail Storm so could be replaced more than 10 or more times over the lifespan of a Gas Facility.
Try looking at the internet, numerous estimates of wind turbine life and solar panel life are out there. Onshore wind claims seem to be 25-30 yrs, offshore wind 20-25. Solar claims up to 25-40 yrs, presumably where they don’t experience freak hail storms. There are also suggestions of gearboxes and blades not lasting that long. So 2-3 times is as good a guess as any for wind, taking the claims at face value, maybe 1.5-2.5 for solar.
LCOE calculations are works of fiction, and really not useful, especially as we move to higher levels of renewables penetration. They are also used to mask a host of assumptions that likely skew the results, such as plant life, mid life refurbishment costs, optimistic load factors etc. It makes a deal more sense to consider capital cost, annualised via a capital charge methodology, and any fixed maintenance cost, and then to consider output related costs for fuel and maintenance.
However, the reality is that dispatchable power will have a higher market value precisely because it can be produced with intermittent power is not sufficiently available. Renewables output will move from displacing dispatchable power for which it can claim equivalent value into increasing periods of being in worthless surplus, cannibalising revenues. The surplus will largely end up being curtailed, since it is far too costly to store more than a small amount as the consequence of trying to store more is that the storage turns over too infrequently to make a margin. The result is that the effective cost of renewables has to be measured against its actual useful output, which will be much less.
Add in all the additional costs for extra grid, stabilisation and balancing and renewables are seen to be no bargain at all.
Paul, please define an acronym the first time it is used in a story. I had no idea that CCGT meant “combined-cycle gas turbine” power plant until I looked it up. And if that is wrong, all the more reason to define your terms at the beginning of an article. And why not give us a little detail about what a CCGT power plant is? Educate us a little so we can better understand your point.
I guess those of us who have been involved in looking at energy for the last 30 years simply assume everyone knows what OCGT and CCGT mean.
Just as naughty Nicky Stokes assumes that everyone knows what LCOE means but not how it is distorted by selectively leaving out hidden costs.
He demonstrated that he doesn’t understand what is included in LCOE.
It’s hard to get excited about this when I don’t know what CCGT is. I suppose you could write the full name once before you start putting in letters instead to save yourself from all that extra typing and repetitive motion stress, I think they call it. I get it. Be good to your wrists and they will be good to you, Heaven knows typing all those extra letters even once can set you up for a lifetime of pain killers and physical therapy. Why take the risk? Still, it would be nice to know what you’re talking about. I’m sure it’s important, and you’ve gone to a lot of work to learn all this stuff this and tell us all about it so we can get mad about it too, but, well if someone asks me when I glue myself to a statue or something to protest and the reporter asks me when I’m being dragged away why I hate CCGT, I’d look kinda dumb if I couldn’t say because I don’t know—I mean more dumb, because gluing yourself on purpose to anything is flat out foolish. I know, because I accidentally glued my fingers to a curling iron and it took a week for it to come unstuck, so I had to take it with me to work and stuff which wasn’t the best week of my life because I’m not even a girl and how do you explain why you’re carrying a curling iron all of the time to people?
There’s a deal more to really understanding exactly what a combined cycle gas turbine is. Much easier to think of it as the most efficient design of gas fired power station for general operation. Other designs are lower cost to build, but lower efficiency, which makes them a choice for peaker plan tthat is only used when demand is high.
“I can email the spreadsheet to anybody interested.”
Yes please, I would be very interested in that.
Does that chart say onshore wind construction cost is less than 5% cheaper than offshore wind construction cost?
It’s worth bearing in mind that there has been around 25% inflation since 2021.
A quick look at the drop off in construction when subsidies are removed shows that all fossil fuel plants are cheaper than solar and wind.