I have had many posts on the soaring consumer electricity costs suffered by the residents of those jurisdictions that have proceeded furthest down the road to all-renewable power. These are places like Germany, the UK, and California, where consumer electricity prices are double to triple the U.S. average. But is that difference the result of their race to convert to wind and solar electricity generation, or does it stem instead from “bad luck,” or something else? Even as electricity prices in many of these places soar, advocates of wind and solar generation continue to claim that those resources are cheaper than the hydrocarbon alternatives. Do they have a point?
The latest back-and-forth has played out on the editorial pages of the Wall Street Journal. On August 20, Republican candidate for Vice President J.D. Vance had an op-ed with the online headline “Harris Wages War on U.S. Energy.” He argued:
“The net-zero project is already stifling investment in the coal, natural gas, and nuclear plants that Americans rely on for reliable, affordable ‘base load’ electricity.”
On August 28, the Journal ran a responsive letter to the editor from a guy named Mark Z. Jacobson. Jacobson is a professor at Stanford University, and is perhaps the most prominent advocate of transition to electricity generation from entirely renewable sources, what he calls “WWS” (wind, water, solar), with some sort of energy storage thrown in as back-up. Jacobson broke onto the scene back in 2011 with a paper in an Elsevier publication called Science Direct, and followed that up with a major opus in PNAS in 2015 titled “Low-cost solution to the grid reliability problem with 100% penetration of intermittent wind, water, and solar for all purposes.”The subsequent accumulation of evidence has not at all slowed Jacobson down. For example we have this piece in the Guardian from January 2023, key quote: “The influential academic says renewables alone can halt climate crisis. . . . Wind, water and solar can provide plentiful and cheap power, he argues, ending the carbon emissions driving the climate crisis.” And if I haven’t yet mentioned it, Jacobson is the driving force behind New York’s Climate Leadership and Community Protection Act, via his acolyte Robert Howarth of Cornell.
So let’s consider Jacobson’s August 28 WSJ letter. Here is the core of it:
South Dakota, Montana, Iowa, Kansas, Oklahoma, Wyoming, and North Dakota missed that problem [of expensive renewable power]. They are, aside from Montana, powered primarily by wind and are among the 12 states with the highest percentage of their electricity demand produced by clean, renewable sources. How do the 12 highly renewable states rank in terms of electricity prices? Ten of them are among the 19 states with the lowest electricity prices. Seven are among the 10 states with the lowest prices. South Dakota, with renewables supplying 95% of demand, has the ninth-lowest electricity price. North Dakota (52% renewables) has the lowest. More renewables mean lower prices.
Is there something to that? Well, let’s look at a few states, one at a time.
Jacobson lists South Dakota as his number one example. He says that renewables “supply[] 95% of demand,” yet the state has the “ninth-lowest electricity price.” Do publicly-available data back that up?
The answer is that publicly-available data for South Dakota are quite inconsistent and contradictory, but however you look at it they don’t come close to backing up Jacobson’s claim. Here is a page on South Dakota from the Department of Energy’s Energy Information Administration, with an update date of August 15, 2024. The data:
In 2023, wind provided 55% of South Dakota’s total electricity net generation. Wind surpassed the state’s previous leading electricity source, hydroelectric power, for the first time in 2021. Hydropower accounted for 21% of the state’s generation in 2023. . . . Renewable resources generated 77% of South Dakota’s total in-state electricity in 2023, almost all of it from wind and hydroelectric power.
So according to that, “renewables” provided 77% of SD’s generation, not the 95% claimed by Jacobson; and of the 77%, 21% came from hydro from dams on the Missouri River. Sorry if you don’t have a Missouri River running through your state to replicate that. Wind generated just 55%. Yes, that is better than El Hierro does in most years, but a long, long way from zero-emissions generation.
And now let’s take a look at the very different 2023 data from the South Dakota Public Utilities Commission. These data are for electricity “consumed” in South Dakota, rather than electricity “generated” in South Dakota, which may or may not explain the gigantic discrepancy. Here is the PUC’s pie graph:

Suddenly coal is by far the largest source, at 36.13%, which puts it at more than the “renewables” wind, solar, and hydro combined (32.35%). Maybe all the rest of that wind generation gets given away to neighboring states at times of excess generation when SD can’t use it. I have no way of figuring that out.
Now, where did our friend Jacobson come up with the statistic that South Dakota supplies “95% of [electricity] demand] from renewables”? I have no idea. Most likely he is relying on the principle that leftists and climate activists don’t get fact-checked.
For what it’s worth, here is EIA’s chart of “average price of electricity to utility customers” for June 2024 (most recent month available). The states are not ranked in price order, but if I’m counting correctly South Dakota has the 16th lowest residential electricity rates among the states, and the 22nd lowest rates for “all sectors” combined. Not bad, but also not close to the “ninth lowest” that Jacobson claims.
Shall we try another state? Next in Jacobson’s list is Montana. Jacobson concedes that Montana is not “powered primarily by wind,” but then he says it is “among the 12 states with the highest percentage of their electricity demand produced by clean, renewable sources.” Take a closer look, and once again it turns out that Montana’s secret is dams on the Missouri River. The EIA (cheerleaders for “renewables” without telling you which one they are talking about) has this to say:
In 2023, Montana ranked among the top 10 states with the largest share of electricity generated from renewables, about 50%. Coal-fired power plants provided the largest share of Montana’s electricity generation in 2023, accounting for 45% of in-state generation.
But how much of that 50% from “renewables” is hydropower from the Missouri River dams, how much is wind, and how much is something else? The best source for that that I can find is this Report from the Montana legislature with an issue date of 2023, but data going only through 2021. A chart on page 24 going to 2021 shows about 40% of electricity generation from coal, another 40% from hydro, and about 10% from wind. There is a substantial unspecified “other” category.
Again, for what it’s worth, on EIA’s June 2024 chart, Montana’s electricity rates appear to be 12th lowest among the states for residential, and 11th lowest for “all sectors.”
So Jacobson’s first two examples don’t come close to supporting his case. Looking at the other states he cites, I think the one that best supports his case is Iowa. So let’s look there.
Iowa, for better or worse, has gone farther than any other state in building wind turbines to supply its electricity. According to the EIA here, wind turbines generated 62% of Iowa’s electricity in 2022, which was the highest percentage of any state. From another EIA page here, Iowans purchased 54,203,955 MWh of electricity in 2022, which would make for average demand of 6188 MW (dividing by 8760). The Iowa Utilities Commission here tells us the generating resources that Iowa has deployed to meet this demand: 12,543 MW of wind capacity, 5543 of coal, 4148 of natural gas, 5253 of petroleum, and small amounts of others. What this tells us is that Iowa had plenty of generation resources to meet demand before it started building any wind turbines. It has more than a two-times overbuild of wind turbines alone as against average demand, and it has more than a four times overbuild if you count everything. Clearly, Iowa has a lot of generation resources sitting idle most of the time. And, whatever its average rates may be, they could be a lot lower if they stopped supporting large amounts of mostly-idle capital.
So where do Iowa’s rates rank nationally? According to that same EIA chart, they are 22nd lowest for residential rates, and 10th lowest for “all sectors.”
Two comments:
(1) At a 2x overbuild of wind turbine capacity and 62% of generation from wind, Iowa has pushed up against the limit of what it can get by just building more wind turbines. As of now, it has barely dipped its toe into the world of energy storage. Going forward, it will quickly find that more wind turbines can only marginally increase the percent of its electricity from wind, and buying batteries is completely uneconomic and not a viable solution.
(2) The prices of electricity from wind are wildly distorted by the myriad of tax benefits and subsidies available to wind turbine developers. Just for starters, there is the federal investment tax credit (30% of the capital value of the investment in wind turbines) and the federal production tax credit (2.75 cents per kWh of electricity produced). Then there is the complete exemption from property taxes for five years from the state of Iowa. There are multiple federal guaranteed loan programs providing subsidized interest rates. There are handouts of every sort from the likes of the Agriculture Department and the Rural Electrification Administration.
Now, how much are all these subsidies and handouts worth in consumer electricity rates? It’s all completely opaque. There’s no way for an informed citizen to figure it out. The subsidies are easily worth 5 cents per kWh, and probably more like 10 or even 15 cents per kWh. Add in the value of the subsidies, and Iowa would not be in the lower ranks for electricity prices, but rather well toward the top.
So when Jacobson recommends building wind turbines to lower electricity prices, he’s not really saying that they are economically cheaper; he’s just saying that sufficient subsidies are available to make the consumer prices appear cheaper. He’s using gkam accounting.
Anyway, we’ll see if Iowa and its co-enthusiasts for wind power can keep marching forward to the 100% zero-emissions future. I will be the first to congratulate them if they can pull it off. But let’s face it — they can’t. And as they start adding storage, their prices are set to go through the roof.
“Renewables: Are They Really Cheaper?”
So what is the answer? You can quibble about exact numbers, but it sounds like all those (red) states that have gone with renewables are doing pretty well.
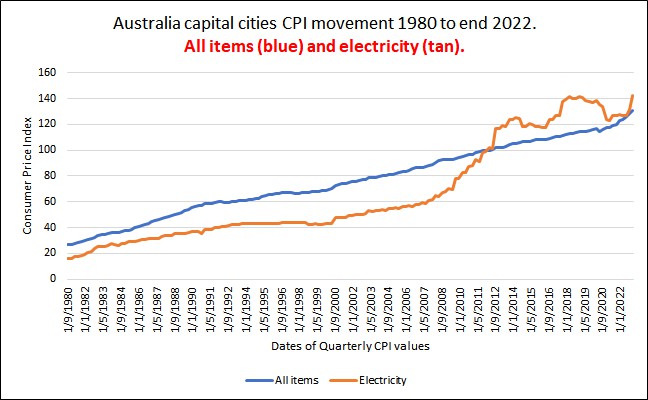
It’s the same story in Australia. NSW and Qld have largely stuck with coal; SA, Vic and Tas have invested more in renewables. Here is the wholesale price history:
The states with renewables have done better.
You didn’t read the lines about subsidies and overbuilding, did you?
Also just how much of it is hydro, which was already in place and works.
Instead of more windmills, they should build more hydro where features and water sources allow.
Would the Greens allow that?
As usual, quoting wholesale prices and completely ignoring the fact that South Australia has the highest domestic energy cost of all Australian states. It relies on its interconnector to other states , since its wind and solar cannot deliver enough power – the state is an overall energy importer.
And I see that some folks regularly claim that Tasmania is “100% renewable” WRT its electricity, despite the fact that they regularly import coal-produced power from Victoria, and also often have to turn on their diesels. It seems that their much-vaunted hydro energy is so limited that they have refused one major industry to even connect to the supply grid.
Wholesale prices reflect the actual costs of generation. Retail prices reflect as well
Neither has anything to do with generation costs.
Victoria used to have three coal fields with generators, and not much export. It then closed Hazelwood, built wind, and is a big exporter. Tasmania has adopted the profitable policy of using and importing cheap non-hydro renewable power when price is low and it wants to conserve water, so it can later sell hydro power at a higher price. It has been drier than usual there.
Yes, we know the costs to implementing unreliable supplies onto the grid is VERY HIGH.
Is that what you are trying to avoid saying . ?
—
“It has been drier than usual there.”
Are you telling us that Hydro is weather dependent ! 😉
At one stage Tasmania stupidly ran its hydro dams down selling power to the mainland, then had to bring in diesels to provide extra power. The state is still short of hydro power, and now wants to build wind “farms” in an area that is right on the flight path of endangered birds. It won’t dam any more of its rivers because the Greens won’t allow that. So the state limps along, dependent on money from other states to survive.
Using Hydro is Stupid in dry conditions. Damming Rivers has two higher priorities A) flood control and B) water storage for drinking water and irrigation.
Its one of the multitude of distortions / lie/misrepresentations in Jacobsons 100% renewable studies. His claim is that is sufficient back up storage power behind the hydro dams. Great idea – lets deplete the drinking water and irrigation water for electricity.
Then why is South Australia having to pay more for its power? If the domestic price is not linked to the wholesale price, why did you make a big deal about the wholesale price? We are not really interested in the wholesale price, only what we have to pay. And the basic fact is that EVERYWHERE in the world where there is a large amount of wind and solar, their electricity costs are also high compared to other sites and countries.
The province / state of South Australia is probably the best set up for successful use of 100% electric generation from wind and solar.
A) it has a very mild climate , relatively cool summers, and mild winters
B) its population density is similar to Wyoming, and light industry, so the per capita electric usage is relatively low.
Yet – And a Big Yet – SA cant come anywhere close to 100% renewable electric generation 24/7/365. Far too many days with very low wind.
No one actually pays the wholesale price.
This list provides the real picture for Australia:
Australian Capital Territory23.67c/kWh
New South Wales33.84c/kWh
Northern Territory27.37c/kWh
Queensland30.21c/kWh
South Australia45.54c/kWh
Tasmania28.12c/kWh
Victoria28.45c/kWh
Western Australia30.06c/kWh
https://www.finder.com.au/energy/electricity/average-cost-of-electricity
So SA, with highest WDG penetration, is most expensive. Canberra pretends to be 100% WDG but it is just a financial fiddle that leeches off the other States.
All the “renewable energy theft” (RET) is charged at the retail level. Most of the FRACs is charged at the retail level. Most of the transmission capital costs and line losses are not included in the wholesale price. The cost of AEMO orders are not included in the wholesale price. The cost of all the NEM administration is not included in the wholesale price. The cost of curtailment through system constraints is not included in the wholesale price.
None of it matters to me because I export power at 66c/kWh so the grid enables me to make money. Once the initial FIT ends, I will go off-grid like all Australia roof owners should be doing. Leave the grid to those who do not own a roof and make them poorer.
“South Australia: 45.54c/kWh”
Oh look.. Nick caught being deceitful.. yet again..
… surprised… not !
Even the lowest wholesale price listed above is three times the price I pay in Nebraska, USA. I wonder if this id due to the fact that 80% of the power from our utility is Fossil Fuel?
You do know that SA relies totally on gas, diesel, and brown coal electricity from Victoria to avoid state-wide black-outs.
I’m sure you do.. so being disingenuous as always.
Nick,
Your graph starts around 2010.
Here is one view of our price movements earlier than 2010.
We must immediately aim for pre-2010 conditions – that is what matters, not optimising the herd after the horses have bolted.
It is hard to capture all the variables that matter in a summary graph like you show, which can mislead.
.
Geoff S
Nick
The data you use doesnot take subsidies into account. Here they are for Australia:
Australia offers subsidies for wind and solar power, including:
Source: good old AI
One other thing. Wind and solar generation plants are BIG, unsightly, and with bad effects on wildlife. Some deleterious effects are subtle like the leaching of nutrients from the enormous foundation blocks (that will be permanent features) into acid soils favoured by many indigenous plant associations. But these numerous harmful effects, and disposal costs due to the short life of many renewable installations, are not costed. Nor are the necessary provision of backup generators or battery packs. By normal costing methods these associated costs should be included as debits against the renewables, but they aren’t by advocates. They make the beginners’ mistake of comparing the cost of building plants, and not capital and operating costs amortised over the working life of the generating plants. One could make the claim that much of the cost of the establishment of backup coal plants and the cost of having them idling or underrunning when renewables aren’t performing well, should be costed against the renewables, not the hydrocarbon plants. If I take a taxi to a supermarket and keep it waiting while I shop, I have to pay for the time the taxi is waiting and idle. And fair enough. So, could you redo your sums to get a fair comparison please.
As a rough and ready calculation, I think the cost of renewables is at least double what is claimed by advocates. Cheers, and please keep on making us think.
I see two possibilities. One is you don’t really understand how any of this works. Two, you are intentionally deceiving.
“you don’t really understand how any of this works”
“you are intentionally deceiving.”
100% of both
All these “investments” pay for themselves.
https://www.usdebtclock.org/
Now Use YOUR Brain and figure out Why Nuclear, coal, NG is not profitable.
Like the subsidies given for renewables, Like the TAXES THAT YOU PAY IN YOUR STATE & FEDERAL TAXES, that makes renewables cost less than the electricity dispatched at LESS than their actual cost. Now look at the utility annual report – over 50% of your monthly payment for Electricity goes to TAXES. This means that to sell RELIABLE power they need to price it as low as the Subsidized Unreliable Renewables. Then the fact these renewables need replaced every 15-20 years and YOU get to pay for construction again, and again. Then you have the hidden cost of unreliable renewable that you ignore – All of those replaced renewables need to be decommissioned and disposed of, a cost NOT factored in the present selling price of their electricity. And worse is the cost to the environment of the mining, smelting purifying all of the materials making these renewables. This cost is over ten times the cost of nuclear, which nuclear already has factored into their cost overhead BY LAW. Renewables just dump it on you at the end or when they go bankrupt to avoid paying the costs, and leaving YOU to pay for them again, and again. You will find none of this info in the EIA Propaganda.
You have been conned, scammed and lied to for 30 plus years.
Nick, I wish you were with me St Valentines Day 2021. I live in Texas, and that showed the utter folly of diverting funding to wind.
texas feb 2021 freeze
Electric generation from fossil fuel – loss of 40% generation for 36 hours
Wind electric generation – loss of 70-90% electric generation for 7 days
Wind proves its not a solution
Why spend money, on a technology we don’t need, and cannot deliver 24/7/365?
Obviously, you get your misinformation from an AI [Artificial Idiot.]
The only thing cheap (free?) about Wind and Solar is their fuel source.
Wind and Solar are
Overtly expensive
Acreage intensive
Low density
Low capacity factor
Back-up necessitated
Subsidy hungry
Green Dollar Sinks
and, very, very ugly! Nobody wants wind or solar “farms” near THEIR homes
Not to mention the bigger they get (2MW, 10MW, 12MW, 18MW,) the taller they get and the taller they get the more susceptible to lightning strikes they get. Wind turbines and lightning do not play well together
Wind and solar can be economically valuable in a predominantly hydro grid if the perched water is constrained. It is lower cost to import wind turbines and solar from China than building another dam.
Jacobson should reveal how much he paid for his off-grid system that is powering his residence. If he is not doing that then tell him to shut up until he can point to a working example of his fantasy.
The only person who can arrive at a wind and solar powered grid being cheaper is a moron. It will never exist because grids developed to transfer concentrated energy at coal fields to industrial and residential centres. There is no benefit of scale with wind and solar. Those connected to the grid are burdened by the high cost of transmission and system stability.
Australia is the best example of where it is headed. At midday today (early spring) rooftops supplied 43% of The Australian demand. All regions had negative prices from 10am to 3pm.
It is now economically viable for the vast majority of Australians who own a roof to simply go off-grid. States that impose an export fee for solar power to the grid will accelerate grid defection. That leaves the poorer consumers to carry the ever growing cost of all the stuff that is being connected tio the grid.
The death spiral for the grid started with the first connection of a weather dependemnt power source on terms far more favourable than dispatchabkle generators..
Thank you for a reality injection, RicWill.
Geoff S
Agree, but in the case of China, its less “Low Cost” and more “Cheap”
I remember when Mark was a deluded young man.
Jacobson was also involved in the Australian Monash University “fact-check” unit that was “fact-checking” for the local govt news organisation ABC. Jacobson claimed that four countries, Paraguay, Bhutan, Albania and Nepal derived 100% of their electricity from renewables. But in fact only one country, Paraguay, came close to 100% renewable power, with the other three regularly importing power from neighbouring countries, which of course used fossil fuels for part of their power generation.
Of course, Paraguay gets virtually all of its electricity from hydro power, 99.68% to be precise. No useless wind or solar power there.
https://lowcarbonpower.org/region/Paraguay
And of course Paraguay is 100% HYDRO..
No wind and solar at all.
And no power hungry industry whatsoever.
How they love to try to deceive. 😉
Bnice2000, beat you to it by 6 minutes.
I didn’t see your post, sorry 🙂
IMO that is called reiforcement
They love to claim hydro as renewable to pad the numbers but won’t push to build more dams.
Jacobson is especially deceptive in his promotions if not outright lying.
When he claims the 8-10 countries with near 100% renewables (norway, iceland, paragury, new zealand, etc) he intentionally fails to mention they are powered by hydro. there is one african country that is also near 100% renewable, but jacobson fails to mention that the per capita electric usage is around 2-5% of the per capita electric usage in the US.
Jacobson also claims in his 145 country powered by 100% renewable study, that you only need 4 hour battery backup storage – He then states that if more is needed, then you run the 4 hour back up in series ie use 4hour back up, then switch to another 4 hour back, viola – thus only needing 4 hours back up.
As an aside.
Yet more scientific papers showing CO2 is mostly determined by SSTs
New Study: Human Emissions ‘Irrelevant’ In Determining Changes In Atmospheric CO2 Since 1959 (notrickszone.com)
Let’s watch how the science deniers react. 😉
They’ll say it’s false until there is a 97% consensus that it’s true.
Northwest Energy a utility company that serves South Dakota, Nebraska, and Montana provides this graph showing sources of electricity generation during a cold snap 22 – 22 Feb 2022 with temperatures across Montana ranged from -10 to -36 degrees:
“Always-available, on-demand resources NorthWestern Energy’s natural gas-fired plants and the Colstrip power plant – are providing energy to keep the lights on for Montana customers this morning. NorthWestern’s hydro generation is also contributing energy for customers’ needs. Until wind generation picks back up, which is forecast to occur later this week, energy from the market is being purchased to fill in the gap” Link.
The annual percentages of solar and wind are deceptive because as the above shows there are times when they generate next to nothing even when most needed,
concur – The Tuesday – Wed had about 30 hours with virtually no electric generation from wind.
Ercot had the same problem during the Feb 2021 freeze – Electric generation from wind for 9 days was about 10-30% of normal – al loss of 70%-90% of normal. Note that was for 9 days vs the 40% loss of fossil fuel electric generation for approx 36 hours. That is a huge difference
The Biden administration has recently imposed EPA regulations that will in effect shut down Coal Strip which in turn destroy our affordable/reliable energy system here in MT. The fate of our
energy system is in the hands of John Roberts
https://dailymontanan.com/2024/08/27/colstrip-owners-beg-u-s-supreme-court-to-halt-biden-pollution-rules/
Just divide comparative “Renewables” costs by their annual productivity and you will understand why bills go up with more and more “Renewables”. This even gives a generous view of “Renewables” as it ignores their short-term unreliability and intermittency. This is not difficult arithmetic, except for “Renewables” fanatics.
https://edmhdotme.wpcomstaging.com/the-myth-of-cheap-renewable-power-in-the-uk/
Wind&solar are not cheap/cheaper, on the contrary (very high integration costs, and they increase with the share of wind&solar).
Just make the producers of wind&solar have the same high availibilty factor like the others (say >80% or so) by providing their own backup or how they please, and then we will know the real costs. They’ll probably disappear.
Renewables are definitely getting cheaper-
Barely Used Lucid Air EVs Are Selling For Less Than Half Their Original MSRP (msn.com)
“These are places like Germany, the UK, and California, where consumer electricity prices are double to triple the U.S. average.”
Don’t forget Wokeachusetts!
Don’t know what electricity prices are in Wokeachuetts but in Wackyfornia I pay 36¢/KWh off Peak and 54¢/KWh on Peak
about 28 on average- not sure how you make that cents character
Mine is a symbol key preset on my kindle pad
Back out all the subsidies and then tell me wind and solar are cheaper. Then convince me that solar and wind are both reliable, dependable and scalable and I will be convinced. I despise all this relentless discussion of net zero, climate change alarmism and the supposed cheap, renewable, and lower energy bills promoted by these advocates. My response is BS.
Anyone up for talking about the other herd of elephants in the room here? What has this creepy theft of wealth and prosperity from the general populace actually done to the Keeling curve so far?
The gentleman from California bids the “square root of f*ck-all”.
Do we have any further bids?
Fighting climate change is not working. Working harder to try to make something that doesn’t work actually work is a fools errand.
Renewable costs are always understated because subsidies are not included. Texas created the Texas Energy Fund last year and funded it with $5 billion in general revenue (e.g., tax generated funds/subsidies). The purpose was to fund adding dispatchable, reliable sources of energy to our grid through grants and loans to firms that will build natural gas plants. That is a reliability cost that is required because wind and solar are so intermittent and unreliable. These costs must be added to the cost of renewables. It does not show up in the rates now. Consider, with a population of 30 million, $5 Billion comes to about $167 per person. Costs that are hidden. Whether through higher electric rates or tax supported subsidies renewables are not less expensive.
The big problem here is we need to force people to use proper language. Renewable energy is unacceptable for the simple reason that the CAGW crowd can include things like bio mass and hydro. I haven’t seen a big push from the CAGW crowd to build more dams, why not? The answer is clear they don’t want more dams rather they are working to dismantle the dams we have now. Bio mass sends our forests up in smoke far faster than they can regrow. What these people want is wind, solar and storage and that is precisely what they should be made to defend. We are far to kind to these mongrels.
Excellent detailed analysis for SD. I did a quick and dirty grid assessment of the grid that include Iowa. in response to the claim that 62% of Iowa’s. electricity came from wind power. I explained that ignoring a variety of end uses of electricity in the individual states that Iowa would be at the grid average mix of 29% wind not 62%.
What is actually happening is the amount of wind generated within the boundaries of the state is equal to an X amount and that value is equal to 62% of the total amount of electricity consumed within the State, it’s an “equivalent” amount not an actual amount.
When winds are strong and demand in the State is low a large percentage of that generation goes out of State, when demand is high, and wind is low most of the electricity consumed in Iowa is coming from out of State. It’s all about the characteristics of the grid, not the concentration of wind in a specific geographic location (within an individual state borders).
Question for Copilot:
So, ignoring population concentration and industrial intensity as a quick and easy approximation we can average those percentages and get the wind contribution.
Sent by Copilot:
Yes, that’s a reasonable approach for a quick approximation. Let’s average the wind power percentages for the states mentioned:
To find the average, we sum these percentages and divide by the number of states:
Average=62+12+20+19+30+27+367=2067≈29.43%Average=762+12+20+19+30+27+36=7206≈29.43%
So, the average wind power contribution for these states is approximately 29.43%.
End Copilot
I find it interesting that the greatest successes for wind and solar power are the most opaque in reporting their data. I can easily get data for the UK, but cannot find it for a place like Iowa.