Guest Post by Willis Eschenbach
I got to thinking about the clouds again. They’re easily the least understood part of the climate. So let me start with what we do know.
Overall, clouds cool the planet. Here’s the effect of clouds on the surface.

Figure 1. Net cloud surface radiative effect. Includes the effect of the clouds on both downwelling shortwave (solar radiation) and downwelling longwave (thermal radiation from the atmosphere) at the surface.
There are some interesting things about Figure 1. First, clouds cool the planet everywhere except the poles and the deserts.
Next, over the ice-free parts of the ocean, the clouds only cool the ocean surface. No part of the ocean is warmed by the clouds.
Finally, the more clouds, the more it cools the surface. That’s why the moist tropical areas, with their extensive cloud cover, are receiving the most cooling from the clouds.
With that as prologue, here’s a thought experiment. Suppose you could control the amount of clouds, and you wanted to create a thermoregulatory system that would stabilize the temperature of the earth. How would you go about it?
Well, it seems to me that you’d want a system where if the planet started out cold, the warmer it got the fewer clouds it would have. Fewer clouds mean less cooling, and that would encourage the system to continue warming …
… but you’d only want less clouds up to a certain point. Once you reached the desired temperature, then you’d want the reverse to happen. Above that temperature, if it warmed further you’d want more clouds, to tend to drive the temperature back down to the desired point.
So you’d want the response of the clouds to look something like this:

Figure 2. Sample of the kind of cloud response that would tend to stabilize the temperature of the earth.
In Figure 2, the amount of clouds decreases as you go from freezing to about 20°C. But further warming brings increasing clouds, tending to drive the temperature back down.
And to move from our thought experiment to the real world, here’s the actual relationship between cloud area and surface temperature. I’ve used only the unfrozen sea surface temperature, to avoid the complications of ice, mountains, and deserts. However, the full globe shows the same pattern, just with more scatter.

Figure 3. Scatterplot, CERES cloud cover percentage versus Reynolds OI sea surface temperature.
Note that what is shown in Fig. 3 is that the preferred temperature occurs in the tropics at around 25° – 27°C. Colder than that and clouds decrease with increasing temperature. Warmer than that, and the clouds increase very rapidly, putting a cap on the tropical temperature.
In closing, there are other variables in the equation. For example, at the warm end, the clouds are composed of more and more thunderstorms, which cool the surface in a variety of ways, not just the effects on radiation.
And that’s all the fun I’m allowed to have in a 24-hour period … my floor-mounted gas heater died, and I need to crawl under the house, pull out the thermocouple, test it to see if that’s the problem, and if so, go to town, buy a new one, and crawl back under the house to replace it.
Do I know how to have a good time, or what?
Best to all,
w.
Willis, do you have any idea what those weird looking loops above (and, to a lesser extent, below) the yellow line in your last diagram represent? They look more than a bit fractal.
Good question, Neil. They’re the result of the data being averaged into 1° lat x 1° long gridcells, with the variables changing at different rates in different directions.
w.
> data being averaged into 1° lat x 1° long gridcells
Doesn’t that bias towards overweighting data nearer the poles?
This is along the lines of my bigger question. Have you considered the effect of solar angular incidence? A cloud closer to the poles is a lot “thicker” than equatorial clouds.
All the values I use are area-weighted, and the Molleweide projection on my maps is also area-adjusted.
And no, this analysis doesn’t consider “thicker” clouds at the poles.
w.
Thank you. Area-weighted is certainly the proper use. I understand that “area weighted 1° lat x 1° long gridcells” is a mouthful.
A cloud at the equator, in the late afternoon would also be very “thick” in terms of the amount of incoming radiation that it would block, particularly a very tall thunder cloud.
Hey Willis, just to be lazy on my part, if your statspak gives you the equation of the LOWESS temp fit in fig. 3, I’d sure like to know, maybe a few other armchair equation solvers would too….
I write in the computer language R. In that language the formula for LOWESS is:
===
function (x, y = NULL, f = 2/3, iter = 3L, delta = 0.01 * diff(range(x)))
{
xy <- xy.coords(x, y, setLab = FALSE)
o <- order(xy$x)
x <- as.double(xy$x[o])
list(x = x, y = .Call(C_lowess, x, as.double(xy$y[o]), f,
iter, delta))
}
===
w.
It takes something like described here from the data, but it looks to be more coding and graphing than I thought. No worries, I can figure it close enough by eyeballing some numbers from your graph and using online CurveFitter.
https://www.statology.org/curve-fitting-in-r/
Below the preferred temperature there is little convection and any increasing warmth evaporates clouds for a decrease in atmospheric opacity. Above the preferred temperature convection kicks in and uplift cause cooling so that the water condenses out again for an increase in atmospheric opacity.
The point at which convection kicks in is determined by the weight of the mass of the atmosphere bearing down on the surface.
The relationship between the energy at the surface and the amount of energy required for the evaporative phase change is the critical factor on a water world.
The amount of that energy required for the phase change is set by pressure which is the weight of the atmosphere bearing down on the surface.
All else remaining equal a heavier atmosphere will always produce a higher surface temperature at a given level of insolation.
Hence the high surface temperature of Venus after allowing for its closer position to the sun.
On Mars there is little water vapour so dust particles perform a similar function to water clouds on Earth but the weight of the particles is the critical factor rather than the energy cost of the phase changes of water.
Varying atmospheric opacity allows regulation of temperature and that is related to the rate of convection. If opacity is reduced by radiative gases or radiative particulates then convection speeds up to neutralise any thermal effect.
It happens naturally all the time and the changes provoked by our emissions would be too small to measure or observe.
As more water evaporates, the weight of the atmosphere is going to increase.
How does that shift your analysis? Or is the change too small to mater?
The more water vapor (mole weight 18) there is in air (mole weight 29) the lighter a given volume of it will be. Thus more bouyant…cooling as it rises….eventually cool enough to form aerosols and droplets, clouds and rain, thus afternoon thunderheads…the more dense air moves sideways to let the moist air rise, eventually continuing its falling path, dry and ready to pick up more evaporated moisture from the sunlight warmed surface…at some rate determined by how much sunlight the clouds have let through to the surface that morning…
Our school system misses so many wonderful learning opportunities concentrating on CO2…the effect of which is trivial compared to water vapor and sunlight.
Yes, the water vapor does eventually come out of the air.
However, between the time it evaporates and the time it rains out, it exists in the air. And yes, water vapor is lighter than air, however, since the air that was in existence prior to the evaporation event, still exists, this water vapor is added to the existing air column. Unless it’s weight is zero, that means it will add to the total weight of the air.
While this does enhance the water cycle, it also increases condensation. This leaves around less water vapor high in the troposphere. Can’t say for sure how this balances out, but I doubt there’s much difference overall.
Good description. Let me add in another facet that is completely ignored in climate discussions.
When the convection speeds up we see the moist air driven higher into the troposphere where it is colder. This condenses more of the water vapor into clouds AND, reduces the residual water vapor. In addition to the natural cooling this produces, energy can now radiate to space more easily.
Climate models assume relative humidity remains constant as CO2 levels increase. This is why they produce a hot spot. In fact, this convective enhancement reduces the RH right where the water vapor greenhouse effect becomes unsaturated.
Since increasing CO2 also increases evaporation via downwelling IR, there’s a built in natural cooling response to offset the warming from increased absorption.
MarkW
Too small to matter.
Creating equations for clouds is a missing link in the incomplete climate models. It is not a simple task over a 25 km grid.
Finest CMIP6 resolution is 100km. The CMIP6 range is 100-300, and the median is about 180. So rather than a ‘not simple task’, an impossible task. That is why clouds are parameterized to best hindcast, which automatically drags in the attribution problem.
“ parameterized to best hindcast,”
And when the “hindcast” temperature data is so corrupted by agenda driven “adjustments” and fabrications as to be totally meaningless…
… tells you all you need to know about the models.
About 30% of ground station temp data does not exist, but it is imagined by modelers.
That fabrication is on top of the error range of the other 70% of ground stations which are not evenly distributed around the world, for starters.
Yeah, hindcasting bogus temperature data doesn’t tell us anything useful.
Fascinating as always Willis.
Strange coincidence that the planet’s “preferred temperature occurs in the tropics at around 25° – 27°C..
That would also be the planetary temperature preferred by most people. Almost like we evolved that way.
Yes, if we didn’t know better, we might imagine that life adapted to the conditions that persisted naturally over eons without respect to the master control knob CO2.
But of course we know that it doesn’t work that way. The slightest bit of toxic male made CO2 is going to inevitably lead to Venus 2.0 a week from Tuesday.
Venus is so cloudy it reflects 73% of the Sunlight’s energy away, compared to Earth’s lower reflection of 30%.
Yet it’s high CO2 atmosphere’s lapse rate is about 11, comparable to Earth’s dry adiabatic lapse rate of 9.8.
But Venus has 90 times as much atmosphere, and a lot more km from the level of the apparent cloud radiative temperature as seen from space, down to the surface…in which it gains that 11 degrees per Km…..about 65 Km compared to Earth’s apparent 5.5 Km.
But Earth’s Albedo as seen from a satellite sensor is a mosaic of clouds (Albedo say .7), visible ocean (say .1), foliage (say .25), deserts and rocks (say .13), so is quite different than the cloud planet of Venus.
fig. 6
https://arxiv.org/pdf/1806.06835.pdf
That really is a lower bound on reflectivity because it doesn’t explicitly account for specular reflectance at high angles of incidence. Also, it is rarely expressed to more than 1 or 2 significant figures, which affects everything ‘touched’ by it.
Very nice, WE. Another demonstration of global thermoregulation.
with the thermostat set to 26 C. 🙂
Clouds
There’s a fiddle factor for those.
This is obvious because the gaseous troposphere is transparent to solar radiation. Only oxygen and ozone in the stratosphere and water vapor in the troposphere can absorb UV radiation. Due to the transparency of the air, clouds over the poles trap warmer air in the troposphere.
In the tropics, because of the constant global mean pressure, when the ocean surface temperature rises to about 30 C, high convection is immediately triggered. The ocean surface temperature in the tropics never exceeds 31 C.
“The ocean surface temperature in the tropics never exceeds 31 C.”
Before Global Warming, it never used to exceed 29.8 C.
Haha, gotcha. /s
Water vapour absorbs about 16% of the solar irradiance in the near infrared. That’s why the dry Horse Latitudes can get so hot.
And ice even more through scattering and melting.
Hi Willis.
When you say “my floor-mounted gas heater”, do you mean that your heater is fueled by gasoline, natural gas or propane?
(asking for someone who is not of North American origin)
Thanks too for another engaging post about how our planet’s systems work.
Not Willis, but most likely propane as he lives on an 8 acre rural heavily forested plot. Both my rural Wisconsin dairy farm and our ‘cabin’ in the mountains of north Geogia also use propane. Easy to truck in and store in 500-1000 gallon above ground tanks. Farm is 750, cabin is 500. Delivered via hose from big truck tank as a liquid at room temperature under slight pressure. Flows through an outdoor simple pressure regulator that drops it to ambient, gasifying the propane for indoor use same as natural gas but with slightly modified burners. Both of our places that includes stove/oven, furnace, and hot water heater. We usually just call it gas.
Most places in the US, gasoline is strictly verboten indoors.
Thanks Rud.
I ran my remote property on propane too.
Not for heating though, couldn’t afford it.
15 tons of firewood collected every autumn took care of that.
At the dairy farm we run a supplemental wood burning firebox plumbed into the furnace, plus a wood stove/fireplace in the ‘family room’ (the old oak log cabin from the 1880’s) when there Problem is, not there except weekends and holidays. We go through about 6-8 face cords of split oak and hickory per winter.
Why would someone unwilling to use his/her name give a down vote to a simple informational item?
Jealousy.
Dems should be call the Jealous Party.
Ok, I fixed that
I’m going to guess that the thermocouple is used to make sure the heater itself doesn’t overheat for two reasons.
1) It’s under the floor and not in the room.
2) Room temperature temperature sensors tend to be thermistors in newer thermostats, and bi-metalic strips in older ones.
The thermocouple senses whether the small pilot flame is burning, and if it isn’t then shuts off the main burner valve, so that unburned gas doesn’t eventually reach some other unintended ignition source. Have replaced many, most new ones are electronic spark, or hot surface ignitors…to save the pilot fuel requirement.
What DMacKenzie said.
w.
We had a butane floor mounted heater on the farm. I had propane in my 4th house. The problem with both are the saturation temperature. Butane has to be buried deep in Kansas in order to provide heat in -20 F weather. Many a cold night we endured with coal oil heaters.
As Rud says, it’s propane. Natural gas is mostly limited to the cities.
And here in insane California they’re planning to ban all gas appliances in 2030.
Madness.
w.
I presume California plans to ban the sale of new gas appliances in 2030. Will they allow gas home heating systems to continue in operation until those systems fail and must be replaced?
A cast iron propane stove lasts at least 50 years.
My three stoves are about 25 years
All I do is change the piezoelectric ignitor about every 5 years
Vote for Trump to wipe out the insane folk from their government perches, and MAGA
In Oklahoma, the natural gas company will pay you to buy new gas appliances.
No banning of natural gas appliances around here.
How bad does it have to get in California before the people vote these insane Democrats out of office?
“And that’s all the fun I’m allowed to have in a 24-hour period … my floor-mounted gas heater died, and I need to crawl under the house, pull out the thermocouple, test it to see if that’s the problem, and if so, go to town, buy a new one, and crawl back under the house to replace it.”
May I suggest, depending on the cost and if it’s the problem, buying and extra thermocouple to keep on hand? You could crawl under the house once, swap out the new and be done, if it was the problem.
Save you a trip to town if it happens again. 😎
Now what fun would that be? Why do you hate fun?
Long ago my job, at times, involved crawling under homes to help people I wanted to help with one thing or another. (Usually plumbing.)
I don’t know how old Willis is, but I’m now at the age where crawling out of bed is sometimes a chore.
(The fun comes in helping someone else in what I’m still able to do.)
PS Don’t tell my wife I said that. She still has a long list of “should have done by now” things! 😎
LOL, the sweetness has long left the honey-do list !
Hi Willis. I’m assuming your heater has a standing pilot light. If it operates without electric power as many older gas heaters do, then it’s a millivolt control that has both a thermocouple and a thermopile which generates the power to open the valve on demand from the thermostat. While it is far more common for the thermocouple to give out first, thermopiles eventually give out too. Given your background, I’m sure you would know this, but for those D-I-Y’ers who may have a similar issue, it is useful to know. I keep a spare T-C and T-Pile around just in case. But these things often last 20 years or so before failing.
Sadly, the government is hell bent on outlawing standing pilot gas appliances even though they have the ability to keep us warm even during extended power failures. If you have one my advice is keep it working as long as possible.
There is not good place to put this, and it is not relevant to clouds. However, anyone not familiar with big propane tanks should search-up “painted propane tanks” using images. There may be regulations that vary by state.
If Willis is like me, he might forget where he laid that T-Couple when he needs it!
I remember when we moved into our current house, it was the first time I had a “tool bench”. I spent a lot of time organizing it (Incorporating my stuff with the stuff the previous owner had left behind.) but I got to a point where I got stuck.
I left it that chore for a week or two.
My loving wife decided to help with what I hadn’t put away yet.
It took me awhile to find that the bits for my cordless screwdriver were scattered among the bins that contained my screws. “Like with like” is what she was thinking.
PS Still happily married approaching 40 years later. She hasn’t helped with my tool bench.
It’s still a mess. (But that’s my fault … these tmes since.) 😎
PPS In case you’re thinking I consider my wife it “stupid”, she handles all our finances. Now that we’ve both retired, our monthly income has increased.
Clouds may well be “least understood” – and articles like this are to blame!
1. It is a fundamental mistake to look at “surface forcing”. Again, that is not how the GHE works, it is not driven by “back radiation”.
2. The CRE (cloud radiative effect, or GHE added by clouds) is about 30W/m2, while the albedo effect would be some 50W/m2. From this perspective clouds indeed would be cooling.
3. The contribution to the GHE by clouds is, as with any other GH-agent, overlapped with other GH-agents. So we need to distinguish between net and gross contribution (or “single factor addition” and “single factor removal”, if you are into consensus terminology). For instance G. Schmidt names for CO2 21.7W/m2 net and 37.1W/m2 gross. Just an example to illustrate the issue.
4. Of course we have the same thing with clouds. 30W/m2 is only the net contribution, gross it is more like 75W/m2. Notably, since WV is vastly exaggerated as GH agent, this makes clouds the largest GH constituent, even before WV.
5. Whether clouds are warming or cooling will depend on what we compare the albedo effect to. We can use the net figure and conclude 30 < 50, so clouds must be cooling. Or we say 75 > 50, so clouds must be warming.
6. The “choice” in point 5 does not exist. Within overdetermined systems (like a GHE caused by multiple agents) we can not attribute causation. There is no solution to this problem, but a lot of ignorance the problem would not exist.
7. Being aware of this problem, we can still circumvent it by looking at empirical data. And these show clouds have a small overall warming effect.
Empirical data should be helpful..
https://greenhousedefect.com/the-cloud-mess-part-2-something-spooky
I love your equations.
Oh, and since I forgot it, the “cloud amount” percentage is pretty meaningless figure. It should be self evident that Earth is not covered by 70% or so of clouds. Just assume some equally 70% albedo for clouds, then you would get like 0.7 * 0.7 * 342 = 168W/m2 in total cloud albedo effect. That is vs. 50W/m2 (or less) in the common literature.
It is to be read as 70% of Earth being covered by some clouds. And if instruments were more sensitive, the percentage would be even higher.
Also the relatively low cloud coverage with moderate warm climates is obviously associated with the tropical hadley cell. It is illicit to draw any generalized conclusions from that.
The cloud effect over ocean warm pools regulating near 30C creates a very powerful negative feedback. There is ample evidence that 30C is the maximum sustainable temperature over open ocean surface. It is a local effect because warm pools create the most powerful convective towers so always mid level convergence and high altitude divergence while they persist.
The top of atmosphere short wave reflected increases twice as fast as the top of atmosphere OLR reduces. The convective cycle operates over 3 to 4 days so the cloud is cyclic. Surface sunlight can range from 1100W/m^2 down to less than 70W/m^2 at solar zenith while OLR ranges from 180W/m^2 up to 300W/m^2. So very powerful negative feedback from the cloud. So powerful that the ocean temperature varies less than 1C during the cyclic process.
Trending the relationship of SWR and OLR for the regulating period that is up to 5 months in the Bay of Bengal yields the 2X ratio. But the same relationship occurs over all warm pools that are regular;ating to the 30C limit.
The attached chart shows a long term perspective across all latitudes. The inverse relationship between OLR and SWR is apparent and particularly just north of the Equator because there is more ocean surface in the NH reaching the 30C limit. The relationship between OLR and SWR is inverse but the 2X response is dampened because the warm pool does not persist throughout the year. To see the 2X relationship, you need to look at warm pools when they are regulating at the limit near 30C.
Thanks Rick, for the brilliant explanation.
If clouds were “warming”, the oceans would have boiled away and Earth would have been a steamy hot ball of cloud kinda like Venus (but it’s mostly CO2)….a couple of billion years ago already….
Be very afraid of a tipping point ! Oh yeah, we only have so much weight of atmosphere on top of our water oceans that fixes it’s boiling point and evaporation rate….
Another potential learning experience never brought up by our CO2 fixated school teachers to students while their minds are sponges.
ES
FLOG, graphs without labelled axes and units put the FU in fundamental information.
Interesting that switchover temperature occurs just at the minimum sea surface temperature for the initiation of tropical cyclones (hurricanes) – i.e 26C
So El Nino increases cloud cover in the eastern tropical Pacific, while a warm AMO phase reduces cloud cover over at least the rest of the Northern Hemisphere, apart from over the Arctic Ocean where cloud cover increases. And the warm AMO is normal during each centennial solar minimum.
Of course its the thermocouple. Its always the thermocouple. Unless its the valve.
There is intuitive interest, even acceptance, that these mechanisms are acting, have acted for aeons, and are a reasonable explanation for the tight limits through which climate is steady and not self-destructive.
Are there any links to quality papers or articles that conflict with this cloud-as-a-controller mechanism? Is IPCC still arguing vaguely about positive feedback processes and overall warming from clouds?
Geoff S
Climate science is lacking accurate cloud data — the main reason it is impossible to know how much warming was natural after 1975
We have measurements of the percentage of cloud cover but that is not enough
Clouds block incoming sunlight
They also block outgoing radiation 24 hours a day
The effect differs in day and night
The net climate effect depends on the types, height, timing and location of clouds.
Thick clouds at noon in the tropics block a lot of sunlight. A cooling effect.
Thick clouds at midnight block upwelling radiation more than CO2 does. A warming effect
We have to look at clouds from both sides … now.
Sure, but if that temperature is 26°C and the planet current temperature is something like 14.5°C, we can still warm something like 12°C, at which point both polar caps would melt.
The temperature was something like 26°C some 55 million years ago, but it cooled to the average Pleistocene temperature of about 9.5°C. Clearly, there is something else at play.
Cloudy areas have the highest turbulent flux. Turbulent flux is proportional to the difference between surface temperature Ts and the outgoing radiating temperature Tr.
Ts – Tr is the temperature gradient which is both the result and driver of heat transport.
More turbulent flux = more net vertical heat transport and depletion of Ts – Tr.
On average dry regions are hotter, with low turbulent flux, less cloud, and a small difference between the Ts and the Tr.
Wet regions tend to be cooler, with high turbulent flux, and a large difference between the Ts and the Tr.
A thermodynamic optimization appears to maintain the Ts – Tr in steady state. If there is a greenhouse forcing, and an initial increase in Ts – Tr, the cloud cover will decrease to restore the steady state. In the process, cloud cover decreases and the system warms.
This will appear as highly stabilizing in the LW, much more than CMIP models suggest. There really can be no net positive LW feedback.
However, energy accumulation will occur in the SW, as only heat manifested as Ts and Tr drives the thermodynamic response.
The missing part of an analytical theory is what sets the optimal gradient of Ts – Tr, and therefore the optimal intensity of the greenhouse effect factor.
The optimal gradient is set by the rate of decline in atmospheric density with height. Since such a decline in density in three dimensions is exponential it produces a linear decline in temperature with height.
Convection then changes as necessary to maintain that linear decline with height but averaged around the sphere rather than locally.
That is what creates our weather and climate zones as regions of rising air always offset regions of falling air and the system is kept stable.
All that needs to change is the speed of convective overturning.
right. A complementary mechanism is to simply diminish the area of opaque cloud mask. This compensates the virtual decrease in the outgoing radiation temperature Tr by sourcing more OLR from greater depths of the surface-atmosphere continuum. This effect is embedded into the instantaneous effective radiative forcing (atmospheric adjustment), not the feedback per se. This accomplishes the same without need to change the speed of overturning.
I think the speed of overturning would also change if one simply diminishes the area of opaque cloud mask.
This is a hypothetical compensating mechanism where a trace gas radiative forcing clear sky effect i.e. Δclearsky(Ts – Tr) is equal and opposite to Δcloudarea(Ts – Tr). There need not be any net change to the rate of overturning.
The clear sky gradient is much less severe compared to the cloud area gradient, and so quite small changes to Δcloudarea compensate the diffuse change to Δclearsky.
A useful indicator of the rate of atmospheric overturning is global average precipitation, where the water cycle represents 10x more vertical heat transport (net) as latent flux compared to sensible heat transport. Conversely, the ocean transport is dominated by sensible heat, but is 5x less compared to atmospheric heat transport.
Estimates of global average precipitation change are sparse, but I’m seeing little change in the past 50 years. This suggests little change in the so-called rate of overturning i.e. vertical heat transport.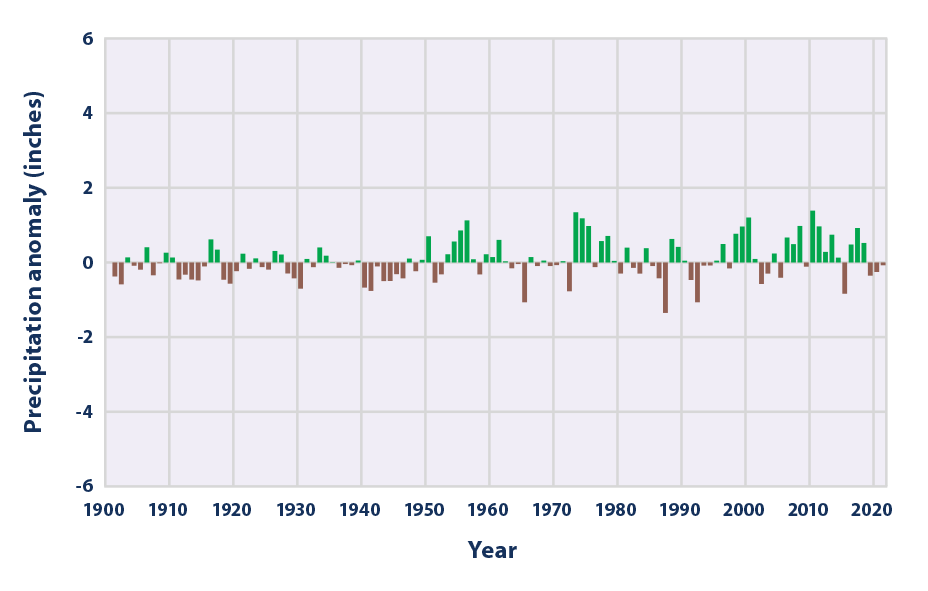
Willis, while I admire your skills in analysing data and reporting your results in clear and simple terms that are easy to follow, I am unable to grasp the logic of your thought-experiment, which appears at odds with basic physics to me.
If having fewer clouds encourages warming, surely, if you want your imaginary planet Earth to warm up from a ‘cold’ start (i.e. well below the desired equilibrium temperature) you would want less cloud-cover then rather than more as you hypothesised and as your Figures 2 and 3 depicted. Surely, having more cloud cover when the planet is colder would tend to inhibit warming and cause the global mean temperature to drop even further. No?
From basic physics I would expect a cooler ocean-surface (on average) to produce less cloud via evaporation anyway, wouldn’t you? This thought leads me to wonder whether the scatterplot in Figure 3 isn’t just an artefact of the Ceres well-processed data.
I think it is time for scientists to start talking and writing about the curve in Figure 2 and Figure 3 as “The Eschenbach Curve.”