by Javier Vinós
The unlikely volcano, the warmest year, and the collapse of the polar vortex.
The climate events of 2022-24 have been were truly extraordinary. From an unlikely undersea volcanic eruption to the warmest year on record to the collapse of the polar vortex after three sudden stratospheric warming events. This rare convergence presents a unique learning opportunity for climatologists and climate aficionados alike, offering insights into a climate event that may not be repeated for hundreds or even thousands of years.
- January 2022, the unlikely volcano
Never before have we witnessed an undersea volcanic eruption with a plume capable of reaching the stratosphere and depositing a large amount of vaporized water. This extraordinary event occurred in January 2022 when the Hunga Tonga volcano erupted. The conditions for such an event are rare: the volcano must be deep enough to propel enough water with the plume, but not too deep to prevent it from reaching the stratosphere. Most undersea volcanoes do not produce plumes at all, which makes Hunga Tonga’s eruption all the more remarkable.
The Hunga Tonga volcano occupied a unique “sweet spot” at a depth of 150 meters the day before the eruption. In addition, the eruption itself must be exceptionally powerful for water vapor to rise into the stratosphere. The January 2022 eruption of Hunga Tonga was the most powerful in 30 years, since the 1991 eruption of Mt. Pinatubo.

Figure 1. The Hunga Tonga eruption from space.
Active undersea volcanoes at the appropriate depth are rare, and the likelihood of one erupting with such intensity is relatively low. We may be looking at an event that occurs once every few centuries, or maybe even once every millennium. Undoubtedly, it was an exceptionally rare event.
While the most powerful eruptions, such as Tambora in 1815, can indeed strongly influence hemispheric weather for a few years, our observations of eruptions such as Agung (1963), El Chichón (1982), and Pinatubo (1991) suggest that their effects dissipate within 3-4 years.
The idea that the Little Ice Age (LIA) was caused by increased volcanic activity is popular. However, the data suggest otherwise. Volcanic activity during the LIA was not unusually high, but rather lower than the Holocene average (although volcanic activity was exceptionally high in the early 19th century, towards the end of the LIA). The primary unusual climate forcing factor during the LIA was exceptionally low solar activity.
Volcanic eruptions that penetrate the stratosphere trigger significant radiative, chemical, and dynamical changes, with sulfur playing a key role. Volcanic sulfur dioxide (SO2) oxidates, combines, and aggregates forming sulfate aerosols. These aerosols scatter incoming shortwave radiation, resulting in reduced surface insolation and consequent surface cooling. They also absorb both incoming and outgoing infrared radiation, contributing to stratospheric warming.
The effect of the Hunga Tonga eruption, however, is quite the opposite. While there was some sulfur dioxide associated with Hunga Tonga, the main impact was from water vapor. Water vapor is a potent greenhouse gas, so the sudden 10% increase in stratospheric water vapor in a single day increased stratospheric opacity to outgoing infrared radiation. Unlike the lower troposphere, where the greenhouse effect is relatively saturated, the stratosphere, well above the Earth’s average emission altitude (about 6 km), experiences a much more pronounced effect from the addition of water vapor. Also, the increased stratospheric water vapor content enhances infrared emissions from the stratosphere, thereby cooling it significantly.

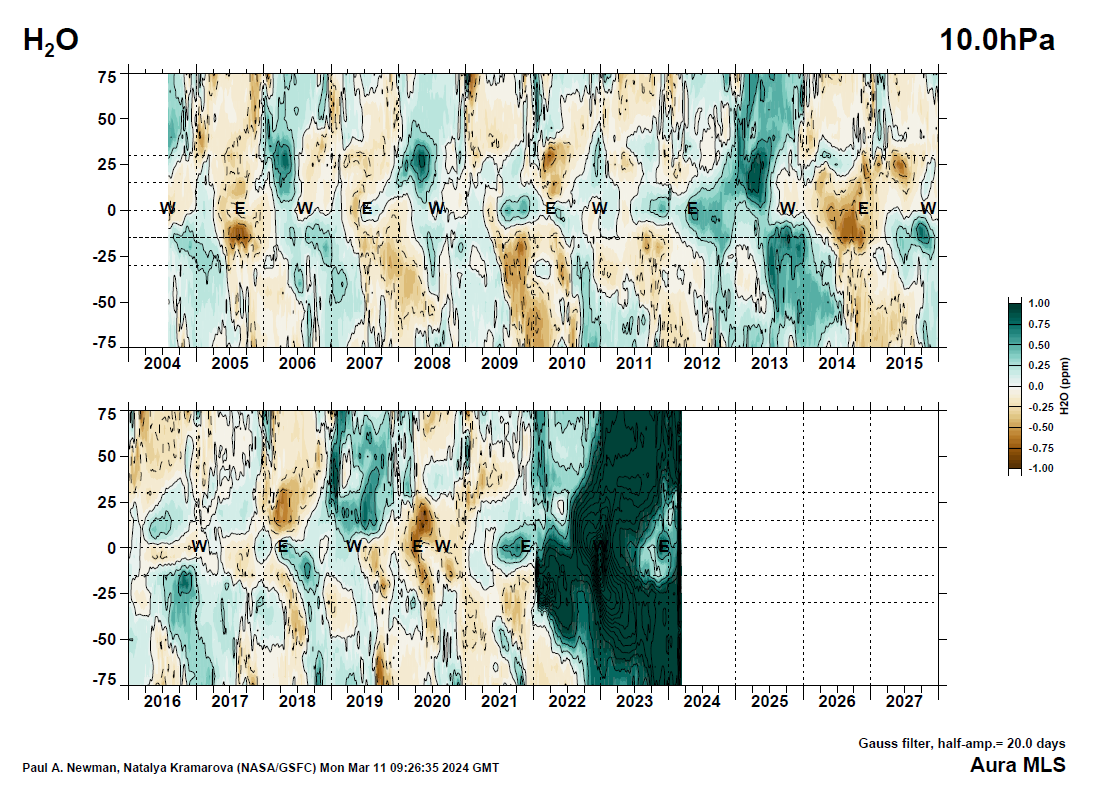
Figure 2. Stratospheric water vapor in ppm by latitude over time at 31.6 hPa altitude. The evolution of the Hunga Tonga water vapor is clearly seen from its tropical injection toward the poles.
The unlikely inverse volcanic eruption of Hunga Tonga is currently cooling the stratosphere while warming the surface. However, this effect will gradually diminish over time as the excess water vapor exits the stratosphere over the next 2-4 years. Figure 2 illustrates the movement of volcanic water from the tropical regions, where the dehydrated air from the troposphere enters, to the mid and high latitudes, where it will gradually leave the stratosphere in the coming years.
The question arises: why did it take more than a year to detect the effects of stratospheric changes on surface temperature after the explosion? Typically, radiative effects are expected to be instantaneous once water vapor or sulfate aerosols are placed in the stratosphere. However, our understanding of how volcanoes affect weather remains incomplete, and climate models struggle to accurately reproduce these phenomena.
Transport within the stratosphere is rapid in the longitudinal direction, but very slow with respect to latitude and altitude, with significant seasonal variations. Depending on factors such as the latitude of the eruption and the time of year, the effects of a volcanic eruption on weather can vary widely. The eruption of Tambora provides a precedent: it occurred in April 1815, but its effects on weather, which led to the “year without a summer,” were not detected until June 1816, a span of 15 months after the eruption. This historical example underscores the possibility that events occurring more than a year after an eruption could indeed be attributed to it.
- 2023, the hottest year on record
Beginning in June 2023, the last seven months of the year marked the warmest period on record, significantly exceeding previous records. Such an event is quite remarkable, given the considerable temperature variability observed from month to month. But how unlikely is it?
Using the HadCRUT5 dataset, we find that there have been 17 record-breaking warmest years since 1870. Any year in HadCRUT5 that beats all previous years becomes a record year, and the record increase is measured as the temperature difference above the prior record year (highest mark until then). For example, 2009 was the warmest year, but it was only 0.005ºC warmer than 2007, the previous record year. 2023 was the warmest year and was 0.17ºC warmer than 2016. It is the biggest difference from one record year to the previous record year in the entire series.
Figure 3 shows that in 2023, the temperature increase from the previous record was the largest in 153 years, at +0.17°C. This level of increase from previous records is remarkable, even for a year that has been recorded as the warmest on record.

Figure 3. The warmest years in the HadCRUT5 dataset from 1870 with the temperature increase from the previous record. 2023 constitutes the biggest jump.
In the warmest years, several months often stand out as the warmest (Figure 4, blue bars). In 2023, there were seven such months, trailing only 2016 and tying 2015. Notably, these seven warmest months were consecutive, spanning from June to December. The red bars in Figure 4 illustrate the number of consecutive record months for each record year. It’s clear from the figure that years in the data set with five or more consecutive warmest months coincide with very strong El Niño years: 1877-78, 1997-98, and 2015-2016.

Figure 4. The number of record months in the record years is shown in blue. In red is the number of those record months that were consecutive.
In 2023, the temperature statistics reflect conditions similar to the strongest El Niño years in over a century. But was this really the case? Determining whether El Niño was the catalyst for the record warming in 2023 is challenging. Relying solely on the surface temperature of the Pacific Ocean as the criterion for El Niño would lead to circular reasoning. El Niño is a complex phenomenon involving both the atmosphere and the ocean. The Multivariate ENSO Index (MEI v2) uses five variables – sea level pressure, sea surface temperature, surface zonal winds, surface meridional winds, and outgoing longwave radiation – to create a time series of ENSO conditions from 1979 to the present.
This index, when averaged over the entire year, shows that of all the record years since 1980, only 1997-98 and 2015-16 were the result of a very strong El Niño. 2023 was actually a weak El Niño year, despite very high sea surface temperatures.

Figure 5. Yearly average Multivariate ENSO Index values for the warmest record years.
We can conclude that 2023 stood out as an exceptionally unusual record-warm year. While it rivaled very strong El Niño years in terms of exceeding previous temperature records, it did not actually fall into that category. Remarkably, despite the lack of a strong El Niño, it managed to set the highest temperature record by the largest margin in the data set spanning a century and a half.
In an article entitled “State of the climate – summer 2023“, Judith Curry showed how unusual 2023 was in terms of the global radiation balance at the top of the atmosphere, the components of the surface energy balance, and the internal modes of climate variability driven by atmospheric and oceanic circulation patterns.
The magnitude of the anomalies displayed in 2023 across a wide range of variables has never before been recorded. It is an unprecedented climate event in our records.
- January-March 2024, the collapse of the polar vortex
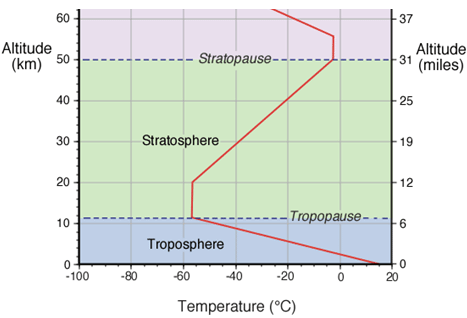
The polar vortex is a circular wind pattern that develops on rotating planets with an atmosphere. It results from the conservation of potential vorticity, a property depending on the Coriolis force and the potential temperature gradient. The potential temperature refers to the portion of the temperature of an air parcel that is not affected by its potential energy, and is often defined as the temperature the parcel would have if it were brought to the surface (1,000 hPa).
In the Northern Hemisphere, toward the end of summer, the Arctic experiences a sharp drop in temperature as the days shorten. To maintain potential vorticity, the wind around the polar regions intensifies in a west-to-east direction (known as the westerlies). The formation of the polar vortex in the stratosphere occurs when the prevailing easterly winds shift to westerly winds. This shift is evident in the zonal wind speed, which changes from negative to positive around September (see Figure 6). Finally, the vortex dissipates around April.
Winds in the stratospheric polar vortex can reach 180 km/h (110 mph) and form a formidable barrier to heat transport from the tropics. As a result, the atmosphere and surface inside the vortex become very cold and dry, reducing the energy loss to the planet, as cold surfaces radiate less.
In the atmosphere, as in any fluid, waves occur, the largest of which are planetary waves. These planetary waves originate in the troposphere as a result of large mountain ranges and temperature differences between oceans and land. They are most prevalent and pronounced during winter in the Northern Hemisphere. Under favorable conditions, these waves travel rapidly, similar to tsunamis, colliding with the boundaries of the polar vortex and imparting an easterly momentum. As a result, the winds that form the polar vortex reduce their speed, weakening it and allowing warmer air to enter, pushing cold air outward. This exchange causes colder winter conditions in the mid-latitudes.
When the winds slow enough to reverse direction, the polar vortex breaks into two or three smaller, displaced vortices. Stratospheric air entering the area previously occupied by the vortex descends, warming significantly in the process. This phenomenon, known as a sudden stratospheric warming (SSW) event, can raise temperatures in the polar stratosphere by up to 40°C in a matter of days. SSWs are relatively common in the Northern Hemisphere, typically occurring about once every two years. They often lead to harsher winter conditions in certain regions, especially eastern North America and eastern Eurasia, in the following weeks.
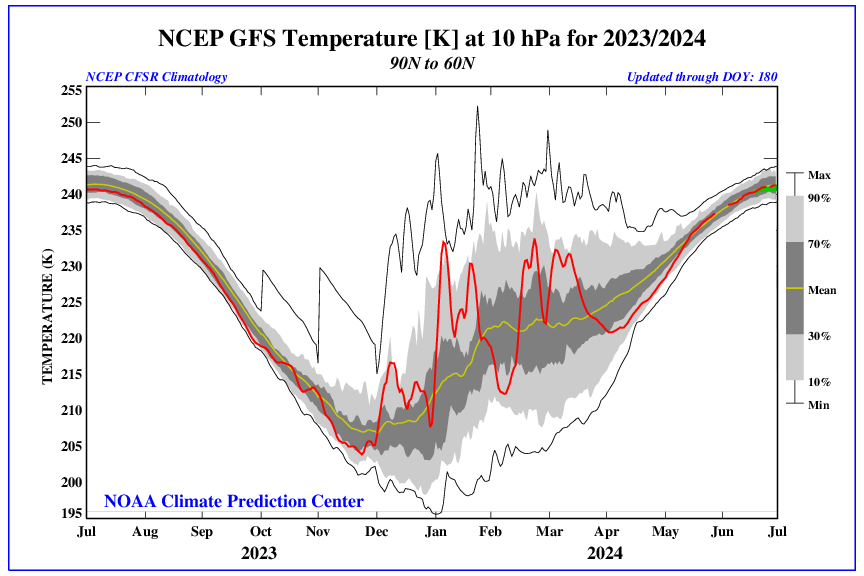
El Niño years typically promote SSW events and polar vortex breakdowns. This could be due to the increased ocean temperature contrasts during El Niño, which generate larger-amplitude planetary waves. Occasionally, about once every 10-20 years, two SSW events occur in the same winter. However, this winter’s extended period (November to March) marks the first time since records began in the 1950s that three SSW events have been observed. The breakdown of the polar vortex occurred in January, February, and March, as shown in Figure 6 from NOAA’s SSW monitoring. Each time, the red line representing the westerly wind speed dropped to the zero line. At this time of year, it is possible that the stratospheric polar vortex may not reform.

Figure 6. Westerly (positive) stratospheric zonal winds at 60°N (red line) reached the zero-speed line three times this year, indicating a sudden stratospheric warming event and polar vortex break down each time.
According to Adam Scaife of the UK Met Office, this event isn’t just unprecedented – it could be a once-in-250-year event. This finding comes from a recent statistical study of SSW events conducted using a seasonal forecasting system within a climate model. However, it’s important to note a caveat: climate models still struggle to accurately represent the stratosphere and fail to reproduce the observed phenomenon that La Niña years also increase the likelihood of SSW events.
The impact of three SSW events this winter isn’t particularly dramatic. While normal weather patterns may shift, leading to unusual temperatures and precipitation in some areas, the effects are temporary. However, these events do affect Arctic temperatures and therefore the amount of energy leaving the planet. The weakening of the polar vortex, as shown in Figure 6, results in increased heat transport to the Arctic this winter, leading to higher temperatures in the region.
Figure 7 illustrates this trend, with an orange line representing Arctic temperatures in 2023 according to the Danish Meteorological Institute, and a green line representing temperatures this year. Since the greenhouse effect is relatively weak during the Arctic winter due to limited water vapor in the atmosphere, the result is that more energy escapes from the planet due to the weakened vortex. This serves to mitigate and reduce the unusual warming observed in the second half of 2023, which contributed to it being the warmest year on record.

Figure 7. Arctic surface temperature for the year 2023 (orange) and 2024 (green), compared to the 1958-2002 average (blue).
Despite the additional heat being transported to the Arctic, leading to increased temperatures, there hasn’t been a corresponding decrease in Arctic sea ice extent. In fact, this winter’s sea ice extent exceeds the 2010-2020 average. It appears that, contrary to widespread fears of its disappearance, Arctic ice remains resilient and stable.

Figure 8. Arctic sea ice extent in 2024 compared to the 2001-10 and 2011-20 decadal averages from the National Snow and Ice Data Center.
- What can we expect in the near future?
The unlikely volcanic eruption is the likely cause of the extraordinary warming, which in turn led to the occurrence of the unprecedented three SSW events. Our understanding of the effects of these events supports this interpretation.
Historical data on the warmest years suggests a high probability that 2024 will again break the temperature record, similar to what happened in 1877-78, 1980-81, 1997-98, and 2015-16. However, if we have correctly identified a major cause of the warming as the Hunga Tonga eruption, we can expect that as the excess water vapor exits the stratosphere, it will induce a cooling effect at the surface, potentially lowering temperatures for the next 3-4 years. Studies such as Solomon et al. (2010) have already shown the negative impact on global warming of stratospheric drying. We should see the reversing of all the warming caused by the Hunga Tonga volcano.
In addition, other factors affecting temperatures, such as the decline in solar activity after the maximum of Solar Cycle 25 and a future shift of the Atlantic Multidecadal Oscillation to its cold phase, could contribute to a large pause in global warming. Using the 2023-24 temperature as a reference point, we could even see some cooling in the coming years. These are indeed interesting times in terms of climate dynamics.
Nice oil painting…..much better than the Hunter Biden stuff.
Even parakeet droppings on the bottom of its cage is better than the Hunter Biden stuff.
I was about to comment that it is a remarkable painting. Wish I had a nice image to use as one of my desktop images. 🙂
I’ll send you a higher resolution version.
HadCRUT is bogus. The years 2007, 2009 and 2010 were not warmer than 1998. Only the super El Niño of 2015-16 beat that of 1997-98 by a tiny fraction. There was a strong El Niño in 2010, but not strong enough.
You’re correct, but if he employs the data commonly utilized within mainstream science, his conclusion has to be accepted by everyone.
Let alarmists try to challenge UAH satellite observations.
Anything that gives you a “global temperature” is utterly useless.
UAH breaks it down by land and sea, latitude on the surface and altitude in the atmosphere.
I Dunno…Figure 3 looks like great news to me…we’ve topped the magic 1.5C and NADA.
No runaway climate
No tipping
Just scrambling to cover backsides
It’s not just HadCRUT. GISS and NOAA also have 2007, 2009 and 2010 warmer than 1998, globally.
Of the satellite data, RSS also has 2010 warmer than 1998.
1998 isn’t even in the top 20 warmest years globally on record, according to GISS.
Are you an escapee from The View?
“Of the satellite data, RSS also has 2010 warmer than 1998.”
😉
RSS uses the same “too-hot” data that all those other bogus temperature records use.
Conspiracy-land.
Those are monthly stats.
Annually, RSS has the 2010 anomaly at +0.61C and 1998 anomaly at +0.58C.
Just check the link you copied that chart from.
You mean monthly stats are not used for annual? Colour me surprised. lol
According to the DATA 1998- 0.8919 2010- 0.7487
“It’s not just HadCRUT. GISS and NOAA also have 2007, 2009 and 2010 warmer than 1998, globally.”
Yes, the temperature data mannipulators had to do something to promote their “hottest year evah!” meme. They arranged it so they could claim one year after another was the “hottest year evah!” in order to scare people into beleiving the CO2-is-bad scam.
That’s the reason NASA and NOAA and all these other temperature data charlatans don’t use the UAH satellite chart, because if they did, they couldn’t say “hottest year evah!” at any time during the period from 1998 to 2016, because none of the years between 1998 and 2015 were warmer than 1998.
Here is the UAH satellite chart. See if you can find any “hottest year evah!’s” after 1998 and before 2016, on this chart. NASA and NOAA claim there are about 10 years between 1998 and 2016 that were hotter than the previous years, and they called each one the “hottest year evah!” but you can’t tell it by looking at this chart.
NASA and NOAA and the other data mannipulators are lying to the public about the temperature record. It’s not nearly as scary as they make it out to be. Actually, it’s not scary at all.
Straight into conspiracy theory land.
What a shock.
1998 is only the 4th warmest year on that UAH data chart.
You posted it yourself.
Are you blind as well as deluded?
I was referring to the years between 1998 and 2016, and how NASA and NOAA and the rest of the temperature data charlatans are lying about it.. Can’t you read?
Using Global average temperature only shows trends.
Some places have cooled, some remained the same, and some have warmed
The weather events have ALWAYS been about the temperature differences.
“HadCRUT is bogus.”
Yes, we can’t have any confidence in results gathered from HadCRUT 5. Notice how cool the 1930’s are presented, when we know from regional temperature charts from around the world that the Early Twentieth Century was as warm as it is today. HadCRUT 5 bastardizes this period of time in order to promote the human-caused climate change meme by making people think today is the hottest time in human history, when it is not.
The United States has been in a temperature downtrend since the 1930’s. The U.S. chart doesn’t look anything like HadCRUT 5, or any of its predecessors. Neither do any of the other unmodified, regional temperature charts from around the world. They all resemble the temperature profile of the United States regional chart.
Does that look like HadCRUT 5? Answer: HadCRUT 5 is not even close.
Thanks, Tom. As soon as I saw “HadCRUT 5, I thought that any conclusions (like the “hottest year ever”) were suspect.
What did you think when UAH posted 2023 as the ‘hottest year ever’?
Hottest year evah! in the satellite era (1979 to the present). That leaves a lot of territory uncovered.
The hottest year evah! in the United States, according to NASA’s James Hansen was 1934, which was 0.5C warmer than 1998, and that makes it warmer than the highpoint of 2023, too.
No cigar.
Yesterday Arctic sea ice extent was not only still way above its 2011-20 average for the date, but closing in on the 2001-10 line.
https://nsidc.org/arcticseaicenews/charctic-interactive-sea-ice-graph/
What excuse will alarmists have if the 2021-30 average beats last decade’s, as presently looks likely for both minimum and maximum?
Which country?…..is the dumbest of them all when it comes to climate? The USA and Europe are clearly dumb….but the Saudis are planning a huge weird city of 9 million powered by solar/wind……and maybe some H2. The Saudis are apparently making so much $$$$ from “carbon” that they can just throw it away.
Here’s a Gem for you – Climate hysteria in the 19th Century
https://trove.nla.gov.au/newspaper/article/1298497#
Nothing really changes, does it?
Thanks for this example of historical observations for history-denying climate cultists.
Rational journalists were calling out the climate alarmism even way back then in the horse & buggy era.
One wonders if the leftists of that era would have tried to get the Pall Mall newspaper canceled for publishing an article contrary to the line of the climate catastrophists of the day.
The article is well thought out and informative but I don’t like the use of the term “climate event”. If climate is a long term average of weather it doesn’t have events, it has trends. It is clear that the use of this term here refers to events in the climate system but it is common for media to refer to a forest fire as a climate event and lots of folks don’t think beyond that use. All of the witnesses including the experts in Held V Montana used this term to refer to weather or smokey days or low snow pack.
For information, it is worth highlighting that MEI.v2 is not being updated for the time being as set out here: https://psl.noaa.gov/enso/mei/
In the meantime, I find the consistency of patterns in the actual SST values (as opposed to the anomalies) that form the basis for the Oceanic Niño Index (ONI) to be very informative. (ONI is the rolling three-month average of the sea surface temperature (SST) anomaly in the Niño-3.4 region in the equatorial Pacific Ocean (5oN-5oS, 120o-170oW).)
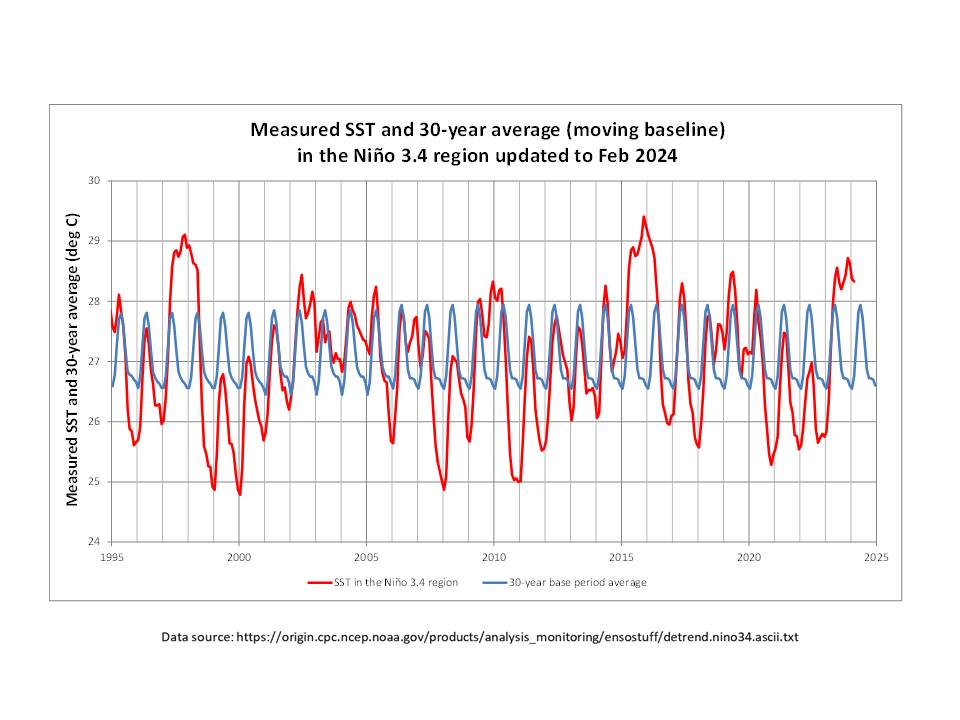
Oceanic Niño Index (ONI) is a sea surface temperature only index, while ENSO is an ocean-atmosphere coupled phenomenon, determined by the strength of trade winds, the Walker circulation and pressure differences between both sides of the Pacific.
If something else that is not ENSO is warming the ocean, ONI will not tell you. The 2023-24 Niño is a weak one, not a strong one and the ocean temperatures have been pushed up by something else.
Look at this image from July 2023, it is not just ENSO, it is all over the place, the North Atlantic, North Pacific, South Indian, Southern Ocean.
“Beginning in June 2023, the last seven months of the year marked the warmest period on record”
Sorry, this statement is not supported by evidence. A “global mean temperature” or even a mean of anomalies, is bogus through and through. Maybe it was the hottest ever in SOME places, but definitely not globally.
“The unlikely volcanic eruption is the likely cause of the extraordinary warming, which in turn led to the occurrence of the unprecedented three SSW events. Our understanding of the effects of these events supports this interpretation.”
This is nonsensical handwaving. The SSW events were up to a year after the HTHH eruption.
According to the Aura data, a small fraction of the available WV from HTHH was near the Arctic.
How much WV was still available >65°N, and how much WV did it take to allegedly cause SSWs?
I made the next graphic below a while back to show the WV effects of HTHH did not follow earlier precedent, as the Upper Atmosphere Water Vapor Content data indicated.
1) UAWVC trend follows the SST trend (lagging T)
2) Upticks in UAWVC follow Niño and SST spikes (lagging T)
3) But the HTHH spike preceded the 2023 El Niño (leading T)
The annual AURA surges follow the annual insolation cycle, with annual UAWVC maxima regularly occurring in the boreal winter after the annual southern ocean temperature peak.
As UAWVC normally does follow SST while not causing a feedback loop, it appears the extraordinary HTHH ~16% WV enhancement event was an interesting outlier but without power over the climate. It injected about 68K Olympic-sized swimming pools of WV.
Compare that amount to the release of excess reservoir waters, “Since flood operations began, enough water has been released from the lake to fill 540,000 Olympic-sized swimming pools.”-MSN, and that was from just one area in the USA.
The scale of the HTHH WV plume was hardly anything compared to the volume of rains and snows from atmospheric rivers the Western US received over the course of a few weeks causing the floods. Imagine the millions of swimming pools of WV that atmospheric rivers would have carried across the Pacific in the year+ since HTHH.
What will Javier claim now, that the atmospheric rivers caused the ocean warming & the SSWs?
The question is how can WV above the tropopause during a SSW event affect the troposphere in any meaningful way, such as warming it when the SSW is still well-below freezing, well below the Arctic surface temperature? Clearly the majority of the UAWVC in 2022/24 resides in higher altitudes (10.0hPa) near 20 miles, so then how does the even lesser amount of WV closer to but still above the tropopause (31.6hPa) affect things in the troposphere?
The actual 2023-24 SSW history at 10hPa:
A 27°C SSW spike happened near Jan.1 2024, still was -40°C below freezing at it’s peak
10.0 hPa @ur momisugly~ 31km = 20 miles, average -35°C

31.6 hPa @ur momisugly~ 19km = 11 miles, average -55°C

You are right, water in the stratosphere could not affect the warming of the troposphere. On the other hand, water in the troposphere could have influenced the increase in ocean surface temperatures in the tropics by increasing areosols, which can absorb solar radiation. Add to this the influence of El Niño, which cannot be ignored. It must always be remembered that the global mean pressure only allows the ocean surface temperature to rise to about 31 C. In contrast, the area of warm oceans in the tropics has increased.
Water Vapor in the Stratosphere can affect temperature at the surface just as well as the Troposphere, IR shines at the speed of light.
“…beginning in June 2023, the last seven months of the year marked the warmest period on record…”
But for some reason, not in the USA according to NOAA’s Climate Reference Network which reports near-surface temperatures measured about 6 ft above the ground. Why is that?
Maybe because the Southern Hemisphere has been more affected by the Tongan shallow submarine eruption.
But last month the NH anomaly was warmer than the SH. However the 48 states were warmer yet:
https://www.drroyspencer.com/2024/03/uah-global-temperature-update-for-february-2024-0-93-deg-c/
2024Feb+0.93+1.03+0.83+1.24+1.36+0.88+1.07
NH 1.03; US48 1.36.
If you look at the UAH charts.. you will see the Tropics is the main region that has a warmed considerably.. You can see the progress of the warming from the El Nino starting in May last year.
I haven’t added Jan and Feb yet.. but there may be a slight hint of this starting to subside.
Tropics were even warmer than global figure in Jan and Feb 2024 than in 2H 2023.
https://www.drroyspencer.com/2024/03/uah-global-temperature-update-for-february-2024-0-93-deg-c/
“…from the El Nino starting in May last year.”
ONI went from 0.5°C in May to 0.8°C in June, 2023 w/big tropical change since May 2022:
“…but there may be a slight hint of this starting to subside.” – Yes, there is a hint or two.
Will be interesting to see what UAH temps and chart for March look like.
There are reports of a lot of quite cold weather around the NH.
It has been an odd El Nino… odd time of the year, warming over a rather large area.. etc .
Down under, El Nino usually means things are a bit drier… not this time.
Time will tell.
I have some reservations about relying on the Oceanic Niño Index (ONI) values (though at least it continues to be available, unlike MEI.v2) and prefer to focus simply on the sea surface temperature (SST) values in the Niño-3.4 region (i.e. measured temperatures rather than anomalies) on which the ONI values are based. These SST data show a remarkable consistency in patterns, as shown in the plot I posted above. Anyway, I have been tracking the recent data as shown in the following plots. Here are the SST patterns for the recent significant El Niño events. Note, in particular, the consistency in timing of variations and duration, the fact that the SST for the current event has remained about 0.5C below the two ‘very strong’ El Niño events and, most important, the double peak in all three cases.
Also, ONI values (rolling 3-month average of the difference between 2023/24 and 30-year average curves) look to be heading for ONI-neutral territory by May, which would be completely normal for significant El Niño events.
The second plot compares variations in SST values for 2023/24 with HadSST4 and global UAH LT anomaly values. Both are (so far) tracking the SSTs closely (with the usual delays). The first SST peak for the current El Niño occurred in June 2023 and the Global UAH LT anomaly peaked 4 months later in October. The second SST peak was in November, so we might predict a second UAH peak in March, but that remains to be seen.
The key difference between these data and previous El Niño events is that the UAH global LT response has generally only tracked the second SST peak. So, from that perspective, the global temperature effect was normally not seen until several months later relative to the timing of the initial increase in SST for significant El Niño events.
Here’s my own version, including Jan and Feb.
My view’s a little different. I think the water vapor injection has a strong warming effect. In addition, there was also an SO2 injection. This produced a cooling effect which limited the water vapor warming. We were also under cool La Nina conditions. Hence not that much of a combined effect in 2022.
In 2023 SO2 is falling out of the stratosphere which is normal after the first 6 months. This reduces the cooling effect. However, since La Nina was still active the warming effect was again limited. The water vapor probably just reduced La Nina cooling.
Then, in late Spring the La Nina was over and El Nino began. Even more SO2 had dissipated. Now all we had were warming factors. The combined effect of El Nino and increased stratospheric water vapor is what led to the big jump we saw starting last summer.
We should soon see a cooling effect by the transition from El Nino to another La Nina. Since the water vapor is still quite significant I doubt we will see the usual La Nina cooling effect. However, we may be able to estimate the water vapor effect by comparing to historic La Nina events.
Water in the stratosphere has a cooling effect because it absorbs some of the sun’s radiation, as does oxygen and ozone.
The question is whether the eruption of the submarine volcano increased the amount of water vapor in the troposphere or the amount of areosol. In what form did the water enter the atmosphere?
https://agupubs.onlinelibrary.wiley.com/doi/full/10.1029/2020GL090539
Increase in Lower Stratospheric Water Vapor in the Past 100 Years Related to Tropical Atlantic Warming
Lower Stratospheric water vapor (SWV) is one of important drivers of global climate change. Increases and decreases in lower SWV have been found to strengthen and offset global warming effects, respectively. Using several data sets, we find that sea surface temperature (SST) warming in the past 100 years has caused an increase in SWV. SST warming over the tropical Indian Ocean and the western Pacific has resulted in a drier stratosphere. However, tropical Atlantic Ocean warming has resulted in a significantly wetter stratosphere and is the main contributor to the increasing trend of SWV in the past 100 years. The responses of Rossby and Kelvin waves over the Indian Ocean and western Pacific to Atlantic warming have led to a warmer tropopause temperature, resulting in more water vapor entering the stratosphere. This study suggests that SWV trend may simply be the result of a game between warm pool SST and tropical Atlantic SST changes.
It is a model study. Nobody knows what were the stratospheric water vapor levels over the past 100 years. Curiously, their Figure 1A looks like a solar activity plot since 1900. Perhaps because it is known that stratospheric water vapor levels depend on solar activity.
The increase in water vapor in the tropics does not enter the stratosphere, but only causes an increase in the height of the tropopause. The average height of the tropopause in the tropics reaches 15 km, but in storms it increases locally up to 18 km.
Invariably (temperature) radiation in the tropopause is the lowest and is due to a decrease in air density. For example, the tops of hurricanes radiate at temperatures as low as -80 C, but a hurricane develops from the surface through the entire column of the troposphere, and the result is a decrease in surface temperature as the energy in the tropopause is radiated into space.
I really do hope we see some cooling over the coming years, as possibly postulated. Wouldn’t that be just a hoot, to see how the alarmists, somehow, manage to blame it on us and demon CO2?
Although the global effect of Hunga Tonga appeared not to take place until 2023, possibly modulated by the effect of La Nina in 2022, there was at least one unusual local warming event in 2022. In July, Spain had very hot temperatures, and on July 19 they were exported across the Alps to Britain, where the Central England Temperature smashed its daily record, by an amount that I have bet will not be broken again before 2040. It was more of a heat spike than a heat wave, because only 4 days later it was cool and rainy enough to spoil a music festival I was attending.
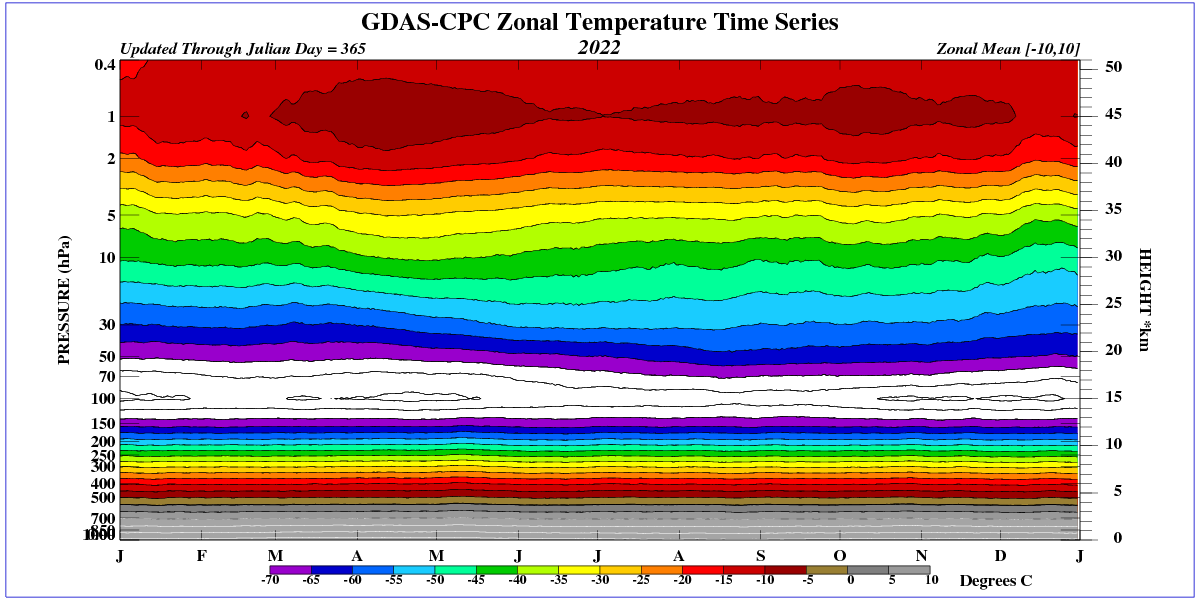
The graphic shows that in 2023 the temperature in the lower stratosphere in the tropics was below the multi-year average. A sharp decline from the beginning of 2024 is evident.


The temperature in the tropopause is also below average and remains stable.
A colder tropical tropopause means the Brewer-Dobson circulation is doing extra work, pumping more very dry, very cold air into the stratosphere, contributing to a sooner drying of the stratosphere.
In general terms, any alteration of the climate system in one direction will be met with a multitude of factors pushing in the opposite direction.
The attempted linkage of SSWs to HTHH more than a year later just doesn’t fly.
What about in prior years when the UAWVC concentration was less? Before HTHH, in 2020/21, there was a SSW of similar strength as this year and last year.
The UAWVC concentration nearest the Arctic was nearly the same at the same time of year last year as during this season’s SSWs, so did the HTTH WV cause those early 2023 SSWs too?
Look at the 10hPA temperature variability from last year. It was as negative an anomaly on Jan. 1 as it was positive on Feb. 1 and later in Feb., so did the HTHH WV cause both variations?
How can any possible 2023/24 HTHH WV SSW forcing be discerned from prior precedents?
This attempted HTHH climate linkage is a failed idea.
Javier has neglected solar influence. A brief peak in solar activity added a synergistic effect to add to the 2023 spike in warming.