Guest Post by Willis Eschenbach
So I came across a news article with the headline:
Philly will have more heat waves, and the Delaware projected to rise more than a foot over the next 25 years
Yeah, right, sez I. The claim is that the flooding will come from increased rainfall in the Philly area. The underlying study is from something named the CRRA:
The Climate Resilience Research Agenda (CRRA) was developed through a collaboration formed in 2019 between the City of Philadelphia, the Delaware Valley Regional Planning Commission (DVRPC), the Academy of Natural Sciences (ANS) of Drexel University, and Drexel University faculty and staff engaged in the Consortium for Climate Risks in the Urban Northeast (CCRUN).
The CRRA Philadelphia folks have put out a document called “A Climate Resilience Research Agenda for the Greater Philadelphia Area“, with the subtitle “Findings from 2021 Working Group Discussions And Updated CMIP6 Projections for the Region”. This is the CRRA Philadelphia Findings document, hereinafter “CRRAP Findings”.
Note that these are not findings from scientific studies. Instead, they are CRRAP Findings from “Working Group Discussions” and downsampled climate models. Clearly science at its finest …
Inter alia the study says:
Philadelphia is expected to become both hotter and wetter in the future through increased
precipitation, a rising sea level, and increased air temperature. In addition to these changes,
extreme weather in the region is projected to continue to increase in frequency and severity,
leading to increased riverine and stormwater flooding, among other impacts.
I started with the tides. The study shows the following, from NOAA.

Figure 1. NOAA sea level rise in Philadelphia
It’s been rising at 3.04 mm/year, that’s about an eighth of an inch. And there’s no sign of acceleration.
Next, here are their projections for future sea levels.

These are relative to the average of the 1995 to 2014 period. For Philadelphia, from the data in Figure 1, that 1995-2014 average is +49 mm. Current sea level there is +95 mm, so it’s gone up by 46 mm since the reference period.
So if it’s going to go up 6 inches by 2035, from today that’s 6 inches less 46 mm. So it has to go up by 106 mm in the next 11.5 years, which is 9.3 mm per year.
In other words, to get to their lowest estimate of 2035 levels, the Philadelphia sea level rise would have to triple tomorrow and stay that high until 2035. And to get to their highest estimate for 2035, the rate of rise would have to go to 24.7 mm per year tomorrow, and stay there until 2035. That’s a sea level rise of almost an inch a year, eight times the current rate, starting tomorrow … yeah, right, that’s totally legit.
Obviously, these folks just grab numbers and never think to ground-test them against reality.
Next, I got to wondering about the claim of “increased precipitation”. So I went to the marvelous KNMI website and got the six weather stations closest to Philly with over 50 years of rainfall data that extended to the present. These are Philadelphia International Airport, PA; Conshohocken, PA; Neshaminy Falls, PA; Indian Mills 2 W, NJ; Wilmington Porter Rsch, DE; and Lambertville, NJ.
Here are those records:

Figure 3. Monthly rainfall totals, six longterm stations in/near Philadelphia
Hmm … very little trend in there, despite decades of warming. Also, in each case the rain has been decreasing over the last two decades. Finally, we see what is called the “Noah Effect”, where one or two of the rainfall totals are much much larger than all the rest. This is a common finding in rainfall data.
How about their predictions for extreme rainfall? Figure 4 shows those fanciful numbers.

Figure 4. Projections of future extreme events, from the CRRAP Findings.
Note the highlighted section. It says that by the 2080s, 10% of the years will have less than 11 days with an inch (25.4 mm) per day of rain, and another 10% of the years will have more than 11 days with an inch per day of rain. Here’s a histogram of how that might play out.

Figure 5. Random proxy data for the 2080s with 10% under 11 and 10% over 14, as in the CCRAP projections in Figure 4. Yellow/black lines show 11 and 14 days per year.
OK, so that’s a look at their fantasy for the 2080s … but how does that compare with historical records?
Figure 6 is the same as Figure 5, but it includes a histogram in red of the number of days per year with more than an inch of rain in the six historical records shown above.

Figure 6. As in Figure 5, but includes the historical data in red.
The CMIP6 projections shown in the CRRAP Findings look nothing at all like the historical data. Historically, there are many more years with less than 11 days with an inch of rain. Not only that, but there are more years with more than 14 days with an inch of rain. In fact, in some years, some of the stations recorded over 25 days with more than an inch of rain.
Conclusions? The future projections in the CRRAP Findings document are far from “life-like”, meaning they bear very little resemblance to actual historical sea level rise and rainfall patterns. If I lived in Philly, I’d just point and laugh … but hey, I was born yesterday, what do I know?
My best wishes to everyone for a life of love and laughter,
w.
PS—Yeah, I’m still suspended from Twitter. They claimed it was because I said:
I see that James Comer is going to “take steps” against the FBI for concealing evidence of Biden corruption.
Steps? Here’s my simple 3-step plan.
1) Fire every single person working for the FBI.
2) Burn the FBI building to the ground.
3) Salt the earth.
w.
I stated here on WUWT that I thought it was not because of that tweet—it was for my views on climate. Some people laughed at that idea, claiming it was just my egotism, that the tweeps didn’t care about my climate views, and that my tweet was “inciting violence”.
But a search on “burn down the FBI” (in quotes) on Twitter finds over a hundred tweets, including these two, from folks that aren’t suspended.

So, if you’re on Twitter, maybe you could tweet to @elonmusk to unsuspend @weschenbach …
And Also: When you comment, I implore you to quote the exact words you are discussing, so we can all be clear on your subject.
The historic record in the charts shows no real change. Level rain, and the same sea level rise. Obviously, all that will change right soon now!
Take a weather event that only happens once in a quarter century that happened yesterday, somewhere on the planet. Write it up as a portent of the nearer future. Add a couple of pics of a flooded stream, bushfire, et Viola! 50 cents a word for very little effort or knowledge. Probably going to get picked up by Wapo or Times too….even bigger bucks.
You used to be able to make your own website with a “donate” button…have an eco-sounding name like say “Sustainability.org” (OK, it’s taken but I didn’t think they’d mind) and make yourself a pot of money….but those days are mostly over due to market saturation, which might tell you something.
Well Philly may not be on for it this coming week, but it looks like some folks in IL, IN, OH, PA and WV may be in for some of that “Noah effect” according to this:
https://pbs.twimg.com/media/FzvdGriXwAEGTwL?format=jpg&name=medium
Typically, the Delaware Valley has either spotty rainfall and a dry July or a dry June and bands of thunderstorms.
This year is the latter. June was dry until last week when it rained for 4 or 5 days with thunderstorms.
The jet streams are bringing moisture into the central U.S. This is a good thing since a lot of this area has had too much drought. Now they are getting rain.
And the high-pressure system that has been heating up Texas (center marked) is slowly moving to the east where it will heat up those folks. The temperatures in Oklahoma are going from 112 heat index yesterday to the upper 80’s F in a few days.
https://earth.nullschool.net/#current/wind/isobaric/500hPa/orthographic=-107.31,32.76,403/loc=-88.892,31.986
Crops of soya beans and corn in my area of Indiana, about 35 miles NNE of Indianapolis, have gotten just enough rain at the right time to remain in good shape.
That being said, there have been several times in the 22 years we’ve lived here, that my yard has had a lot more brown in it than it has now, and yet the crops did fine.
Oh, and that dome of high pressure that that the wet and stormy weather is riding over the northern arc of, is moving ESE. But if the models are right this is what the coming temps are going to look like for the US. The following map should be viewed with the understanding that this model, like about all of them, almost always forecasts the cooler areas to warmer than they actually turn out to be.
https://pbs.twimg.com/media/Fz4V2vVXgAE3giU?format=png&name=medium
Meteo misinformation media definitely describes PBS.
PBS certainly doesn’t get their weather reports from anything Noah, more like the activist weather channel.
Want free money? Start up an organization that will legitimize a city/county/state need for CC reparations and all you have to do is collect the money after spreading doom. You win, your client wins, and nobody will question your motives.
Just wondering if the SCOTUS ruling on Biden’s clearly unconstitutional “student loan forgiveness” will slow down the output of “climate scientists” from the diploma mills?
Also reflecting on the SCOTUS ruling on Affirmative Action. How come there has not been much racial diversity in the fields of “climate science” in the US? I mean we have seen a noticeable increase in black meteorologists presenting the weather on TV in the last 20-30 years, but as far as those scientists in academia involved in the climate wars there appears to be very little racial diversity in the US. Almost all with a few notable exceptions like Willie Soon, seem to be white people on both sides of the conflict in the US. At least that is the way it appears to this outsider that has not attended conferences held by either side.
Kind of strange since one of the alarmists standard claims is that “climate change” will hurt people of this race or that, or gender, or of lower income level more.
University degrees so worthless that even the student doesn’t want to pay for it.
Women are making up the majority of university degrees including in environmental studies and climate science. For blacks, they generally do not take the mathematics prerequisites required to pursue science degrees.
Didn’t stop Michael Mann! He obviously cannot do or understand statistics.
Here’s the story of me, Michael Mann, and statistics — Dr. Michael Mann, Smooth Operator.
w.
It’s amazing, he has a bachelor’s degree in math and physics. Therefore, it’s not beyond his (I can’t believe I’m saying this) intellect.
Much apparent sea level rise in Philly is from land sinking as Canada rebounds from losing the weight of its ice sheet.
And another one(climate lies) bite the dust! Thanks Willis
I think Twitter did not like burning the FBI building to the ground, should have sunk it.
It’s probably done by an algorithm.
Irony, sarcasm, or other linguistic devices don’t work very well in human text exchanges, IMO.
AI is far far worse.
Mason:
Yep. Rather, “tear it down brick-be-brick” …
[and like a good conservationist, reuse them. Lol ]
So It’s “turtles all the way down”?
(I have no idea what that means, but it seems to fit with the subject of Willis’ article, in that the CRRAP people also have no idea what they’re talking about)
If there is a flood in Philly it will be from the tears of leftists.
It is a remark in defense of the belief that the Earth rests on the back of a gigantic turtle instead of floating in space.
The modern version
https://oldschoolrecordreview.wordpress.com/2015/04/03/yeah-but-do-you-know-what-that-song-is-actually-about-2-turtles-all-the-way-down/
Bertrand Russell was a philosopher and mathematician. I’m sure he’d have been greatly amused at being described as a ‘scientist.’
Explained fully in essay ‘Models all the way down’ in ebook Blowing Smoke.
Everybody should have a copy of Rud’s ebook “Blowing Smoke.” Likewise Steven Koonin’s “Unsettled.”
Mr. I like what you did with their acronym! Way too kool!
It was done by Willis.
Guilty as charged … it was too good to pass by.
w.
Isa ho, too. If they give you a pop-up fly ball, get under it!
Mr.,

There is a belief that the world sits atop the backs of four elephants that stand on the back of an enormous turtle.
Which raises the question “OK what is the turtle standing on?
Answer… Another turtle
Qiestion ” So what does THAT turtle stand on”?
Answer…Its Turtles all the way down.
I think you’re mixing 2 ideas up. Hindu mythology (and sir Terry Pratchett) has the world supported on the backs of 4 elephants that stand on a turtle’s shell which is unsupported – it swims along on it’s own. The ‘turtles all the way down’ story is different altogether that’s covered in another reply.
They couldn’t have picked a more appropriate name.
WE convincingly shows that the CRRAP finding are crap. Apt acronym.
I was going to say the same thing, Rud, but you beat me to it! I think I see how this works:
City and local government bodies commission an investigation into future climate trends. CRRA realise that if they don’t sound dire warnings they’ll be on the wrong end of a massive lawsuit if there’s an unexpected flood (due to a one-off weather event – not “climate change”) any time soon; so they sound dire warnings “just in case”. They also realise that the gravy train will cease if they don’t tell the customers what they want to hear. Hence their CRRAPy report…
Nice work as always WE. Its interesting how the rainfall records for the lows are so even at about 10mm. I expect the bottoms to be like that in the normal state of affairs, since they are nearing zero rain. However, in the CRRAP alarm case, there should be some sign of rising up of these bottoms by several mms on average. The Consho Green record looks to be trimmed off at 10mm, like the Ozzie BOM T° records where they set a lower T° limit of -10°C!
https://joannenova.com.au/2017/08/scandal-australian-bureau-of-meteorology-caught-erasing-cold-temperatures/
BOM has, unannounced, introduced a “smart card” to do this.
“Lance Pidgeon blew the whistle on the missing data after watching the minus 10.4C Goulburn recording from July 2 disappear from the bureau’s website. “The temperature dropped to minus 10.4, stayed there for some time and then it changed to minus 10 and then it disappeared,” Mr Pidgeon said.
Apparently, it finally wound up at -9.6°C. This is a smart card indeed. I guess you cant have a string of lows all at -10.
The Earth has been warming since the end of the last glacial period about 11,700 years ago in fits and starts. In 2022, for the continental United States, the year that has the most state heat records that are still standing is 2012, 31. In 2022, it was cooler than the records in all 48 states of the Continental United States. No new state heat records were set according to NOAA. For all 48 states, the average temperature was 2.4 degrees Celsius or a 4.32 difference in Fahrenheit.degrees below their record temperatures..
maybe look up the neoglacial period? Started about 3500 to 4000 years ago.
Willis, Willis!
As the cancerous bureaucratic growths that are so prevalent in Washington, D.C., continue to spread and multiply; it is obvious that far more than fire and salt are called for! I’m sure that the Twitsters were only concerned that your recommendation was in no way adequate for rectifying the current kerfuffles!
Perhaps some sort of Mohs surgery that excises ALL the DC organizations that have taken on “enemy of the people” status? It’d probably be easier to raze the whole place and start over, but what could we do with all the displaced govt employees? I think even pharmaceutical companies would be averse to accepting them as lab rats, and nobody wants them to move into their neighborhood! Where is Dr. Guillotin when you truly need him?
Another nice post, by the way! You’re getting even more adept at making the climate hysterics look foolish!
The global elites pushing nut zero should be careful what they wish for – a part of me hopes they go full tonto push, then realise, they don’t have any electricity either, or food, or heating – loads of money, but nothing to spend it on
Other than card-carrying climate skeptics, the people I talk to accept CO2-doom as an axiom. The CRRA Philadelphia folks do not need to look at anything other than their own entrails. Perhaps a prophet will materialize, a new Aladdin, to retrieve a magic gizmo and report the genie’s skeptical words of wisdom.
done.
Wonder how they missed all the smoke from Canada.
Is the Canadian government buying carbon offsets ?
Three mm/yr sea level rise of which about 1 mm/yr is subsidence.
Isn’t the river bottom subsiding too?
You weren’t suspended because of you words. You were suspended because your words gave them the excuse to do so. In the end it was a matter of belief. They cannot tolerate a difference of belief, publicly stated because it is a challenge to their beliefs.
It is easy to believe climate today is different than 50 years ago. So long as you are aged 49 or younger.
Willis, Twitter has banned non-twittees from reading, so I couldn’t see your tweets even if you were reinstated.
hey Willis, a couple questions:
“And to get to their highest estimate for 1935, the rate of rise would have to go to 24.7 mm per year tomorrow, and stay there until 2035.”
1935==2035 ?
“The CMIP5 projections shown in the CRRAP Findings . . .”
CMIP5 == CMIP6 ?
Dan, good to hear from you as always, and thanks for the typocheck.
Fixed.
Best to you and yours,
w.
Agreed! We need to get President DeSantis on that right away 🙂
The latest weather and detailed explanatory from the ex ante experts in Oz-
Unseasonable rain continues to fall across Australia’s north, helping lower temperatures to near-record levels (msn.com)
Heavy June rainfall defies BOM’s dry outlook across large parts of Australia (msn.com)
Just don’t forget lay folks that Gaia’s defiance is all related to the dooming.
And SOI continues to grow.
https://www.longpaddock.qld.gov.au/soi/
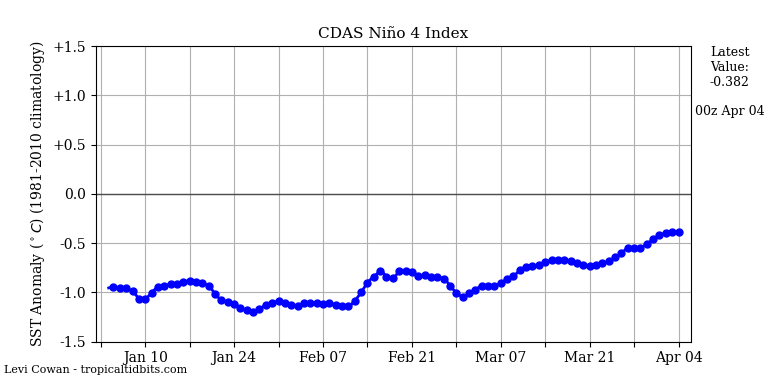
Niño 4 index drops.
A +1C change since Jan 23?
Is that a lot?
That’s not much, contrary to BOM forecasts.

http://www.bom.gov.au/climate/enso/#tabs=Pacific-Ocean&pacific=SOI
http://www.bom.gov.au/climate/enso/wrap-up/archive/20230620.sstOutlooks_nino34.png
El Niño is limited to the Niño 1.2 region, where circulation is blocked. Circulation in the central Pacific does not allow a large increase in surface temperature.
http://tropic.ssec.wisc.edu/real-time/mtpw2/webAnims/tpw_nrl_colors/epac/mimictpw_epac_latest.gif
Circulation in the South Pacific is unlikely to produce a large increase in temperature in the Niño 3.4 region.
http://tropic.ssec.wisc.edu/real-time/mtpw2/webAnims/tpw_nrl_colors/spac/mimictpw_spac_latest.gif
Has anyone attempted to identify and list just how many CAGW/Climate Alarm/Climate Activist organizations there are in the world?
Honestly, there must be hundreds of them scattered all over the globe residing on the net, in universities, etc.
The very fact that the word “agenda” appears in the name should sound alarm bells. It means they’ve already reached their conclusions, now they’re trying to find “facts” to support them!
“extreme weather in the region is projected to continue to increase in frequency and severity,”
There is no evidence that extreme weather is increasing anywhere in the world, including Philadelphia.
This is just another unsubstantiated assertion by climate change alarmists.
Yeah, I think the Twitter censors don’t like your views on climate. They are just using that post as an excuse.
Do you ever get out of jail on Twitter? What’s the sentence? Or do they just leave you hanging?
I’m sure glad I never got into that Twitter nonsense. Of course, even if I had, I wouldn’t have lasted long. They would ban me quick!
Keeping up with WUWT is enough work for me.
If it wasn’t for WUWT and a few other places like this, we would probably have to go back to USENET discussion groups to avoid the censors.