Guest Post by Willis Eschenbach
We have an experiential understanding of the effect of radiation on objects. Oh, not nuclear radiation, that’s something different. I’m talking about things like solar radiation, aka sunshine. In the world of climate science, sunshine aka solar radiation is also known as “shortwave radiation”.
This is to distinguish it from thermal “longwave” infrared radiation. Longwave thermal radiation is being given off all the time by everything around us, including the atmosphere. It’s what makes night-vision glasses work. They “see” the longwave radiation. Longwave radiation is also why we can feel the heat from a hot cast-iron stove clear across the room—we can sense the heat on our bodies from the longwave radiation.
Radiation in climate science is distinguished by direction, being either upwelling (headed to space) or downwelling (headed to the earth’s surface).
These types are often referred to by abbreviations. So downwelling shortwave radiation (sunshine) is DSR. Upwelling shortwave radiation (sunshine reflected from the surface and clouds) is USR. Similarly, upwelling longwave radiation (that part of the thermal longwave infrared radiation constantly emitted by the surface and atmosphere that is headed to space) is ULR, and downwelling longwave radiation (that part of the longwave radiation emitted by the atmosphere that’s headed toward the earth’s surface) is DLR.
With that as prologue, as I opened by saying, we have an experiential understanding of the effect of radiation on objects. Our experiential understanding of the effect of solar radiation is quite simple.
The more radiation absorbed by some object, the hotter it gets.
Our experiential understanding of longwave radiation is also simple, exemplified by feeling the heat from a cast-iron firewood stove from across the room. That understanding is:
The hotter an object gets, the more longwave radiation it emits.
We experience both of these quite often. Indeed, we have a number of scientific equations that allow us to calculate exactly how much hotter something gets from absorbing a given amount of radiation, and also how much radiation is given off by an object at a certain temperature.
And indeed, our experiential understanding of sunshine is what underlies the fundamental paradigm of climate science:
The more radiation absorbed by the planetary surface, the hotter it gets.
Now, that seems unassailably true, based on both our experiential understanding, as well as the equations that can actually calculate the amount of heating for a given amount of radiation. I mean, we can see every day how the sun comes up and the earth gets warmer … simple physics, right?
So … is it always true that if more radiation is absorbed by some object, it gets warmer?
Well … consider what happens when you walk outdoors during the day. Immediately you are absorbing hundreds and hundreds of watts of additional energy from the sun.
But despite absorbing a large amount of solar radiation, your overall average temperature is unchanged … more radiation has not made you hotter.
Ah, folks will say, but that’s because the human body has systems that regulate our temperatures. We have systems that increase heat loss when absorbed radiation increases, that move the absorbed energy to where it can be lost to the air … and, folks say, that’s very different from the climate.
Hmmm …
Keeping that in mind, let me take a slight detour. There’s a mathematical measure called “correlation”. It measure the similarity of two datasets, and for any pair of datasets, it has a value somewhere between minus one and one. “Correlation” measures whether two sets of data, say temperature and absorbed radiation, move in the same direction. A correlation of 1.0 means the two datasets always move in the same direction—if, for example, when absorbed radiation increases, temperature always goes up.
A negative correlation means the two datasets are generally moving in opposite directions. A correlation of -1.0 means the two datasets always move in opposite directions—when one goes up the other always goes down.
And a correlation of zero means that there is no relationship between the changes in one dataset and the changes in the other.
With that as a prologue, let’s look at the correlation between the earth’s surface temperature and how much radiation the surface is receiving. Per our experiential understanding, the correlation should be strongly positive, meaning that the more radiation that is absorbed by the planetary surface, the hotter it should get, and the less radiation absorbed, the cooler it should get.
Here, using the CERES satellite data, is a gridcell by gridcell display of that correlation. Each gridcell is 1° latitude by 1° longitude.

Figure 1. Gridcell by gridcell correlation of surface absorbed radiation (shortwave + longwave) and surface temperature. Gridcells are 1° latitude by 1° longitude.
Now, this is a most interesting result. Everywhere over the land, with no exceptions, the correlation is just what we’d expect—not only positive, but in general strongly positive. Overall correlation over the land is 0.91, a strong positive correlation, which supports our experiential understanding of absorbed radiation and temperature. Over the land, when absorbed radiation increases, temperatures do in fact go up, and vice versa. Positive correlation. Simple physics.
But over large areas of the tropical ocean, shockingly, there is negative correlation. Contrary to our experiential understanding, contrary to the central paradigm of climate science, contrary to “simple physics”, in those areas more absorbed radiation is NOT making the planetary surface warmer. It’s making the surface cooler … which isn’t possible if absorbed radiation is determining the temperature.
From that, we can only conclude that in those areas, the causation is going in reverse. Instead of total absorbed radiation determining temperature, the temperature is determining total absorbed radiation.
A primary mechanism that explains this apparent impossibility is the temperature-controlled emergence of cumulus fields and thunderstorms. These increase with increasing temperature, and they greatly reduce the amount of solar radiation absorbed by the surface. And so the temperature is regulating the amount of absorbed solar radiation, via clouds and thunderstorms.
And this is a very strong regulation. Here’s a scatterplot of the net effect of clouds on the downwelling radiation versus the surface temperature.

Figure 2. Scatterplot, ocean temperature versus total downwelling radiation change due to clouds (cloud radiative effect, “CRE”).
Note that at the warmest temperatures, the clouds are reducing total downwelling radiation (shortwave + longwave) by up to 60 W/m2 … by comparison, a doubling of CO2 is said to increase radiation by 3.7 W/m2.
Next, I need to show that the phenomenon of reversed causation/negative correlation is in fact temperature-related. I mean, it could just be some peculiarity of the tropical ocean that isn’t particularly related to the temperature.
The first way I investigated that question was by making a scatterplot of the relationship between temperature and the correlation shown in Figure 1. Here is that result.

Figure 3. Scatterplot. Horizontal axis shows the temperature of each 1° x 1° gridcell. Vertical axis is the correlation of absorption and temperature in that gridcell. The box at bottom right encompasses all of the gridcells which have a negative correlation between the absorbed radiation and the temperature.
A couple of things are clear here. First, the reversal of cause and effect leading to the negative correlation of absorption and temperature only occurs at ocean temperatures over ~ 23°C.
And second, in that area in the lower right showing all gridcells with negative correlation, the warmer the temperature, the greater the maximum observed negative correlation.
So this is evidence strongly supporting the idea that the emergence of negative correlation is indeed temperature-based.
However, while this shows the conditions on average over the period of the satellite record, this is only a long-term calculation. We still need to investigate what happens in the gridcells as temperatures warm and cool over time.
Now, my hypothesis is that the surface temperature is regulated by emergent phenomena including tropical cumulus fields and thunderstorms. If that is the case, then as the temperature increases, the strength of this negative correlation should wax and wane.
More specifically, a corollary of my hypothesis is that the area of the ocean surface where the correlation is negative should be larger in the summer when the ocean is warmer, and the area of negative correlation should be smaller in the winter when the ocean is cooler. So I did the calculations and graphed it up. Of course, to do this I had to split the data into northern and southern hemisphere gridcells, since the seasons are reversed in the two hemispheres.

Figure 4. Monthly variations in the area of the ocean surface where the temperature and the absorbed radiation are negatively correlated.
As would be expected if my hypothesis is correct, in the northern hemisphere (red line) the area of negative correlation is largest in the summer. In fact, it peaks out at about 50% larger in summer than the winter minimum.
And at the same time, the area in the southern hemisphere (blue line) is at a minimum, because it is the southern hemisphere winter. It is an even larger swing in the southern hemisphere, with the maximum area of negative correlation being almost twice the minimum area.
So both of these methods show that indeed, the negative correlation is a function of temperature.
Summary: When the ocean temperature gets high enough, the normal everyday “simple physics” positive correlation between absorbed radiation and a resulting temperature increase breaks down, and the correlation between radiation and temperature goes negative. This acts to reduce the ocean surface temperature. It is another of the many emergent phenomena which act in concert to thermoregulate the planet.
How good is this planetary thermal regulation? Well, although we inhabit a world that is balanced at a temperature on the order of 50°C warmer than it would be without greenhouse gases, a world regulated by clouds, winds, and waves, a world where the land temperature varies by up to ± 30°C (± 10%) from summer to winter, and the ocean varies by up to ± 8°C (± 3%) from summer to winter … despite being in the midst of all of that daily and monthly fluctuation, the global average temperature only varied by ± 0.4°C (± 0.1%) over the entire 20th century …
To me, this is the big unanswered question in climate science—not why the temperature varies, but why it varies so little. And the existence of the negative correlation discussed above is a testament to how “simple physics” is completely inadequate to explain the unbelievably complex, chaotic climate system.
My best regards to all,
w.
The Usual: When you comment please quote the exact words you are discussing. I can defend my own words. I cannot defend your restatement of my words.
Thunderstorms cool with every electrical discharge by another well-know mechanism (https://www.nasa.gov/mission_pages/sunearth/news/lightning-waves.html). It might be insignificant, but I don’t see anyone in a big hurry to quantify it. A starting point would be for NASA to read up on sferic attenuation below 10 kHz.
Thanks, R. Interesting. In terms of cooling, however, my guess is that the heating from the electrical discharge would offset any cooling due to the leakage of Schumann resonance …
w.
Willis, I’ve been scratching around with regards to R Taylor and your comment re the “Schumann resonance” (wiki had a good explanation if correct) and it’s fascinating! I need to read some more as phase change of H2O in clouds and lightening is my primary focus. This may be leading to what I’ve been looking for for several years.
R T, interesting results from search “sferic attenuation below 10 kHz.” I’ve been wrapped up in resulting info since your posting but with a focus on a different perspective/aspect than yours. If you are aware of a bit of a condensed version along the lines of Willis’ writing style it would be appreciated if you can share a link or two.
“The hotter an object gets, the more longwave radiation it emits.”
.
This is technically not true. An iron poker in a fire will glow red. Heat it to a higher temperature and the red turns to white. In fact stellar temperatures are determined by color spectrum, not by intensity. Rigel is a HOT blue giant, while Betelgeuse is a cooler RED giant. Spectra determines temperature not intensity.
Actually, it is technically true. According to the Stefan-Boltzmann equation,
Radiation = σ ε T^4
where sigma (σ) is 5.67E-8, epsilon (ε) is emissivity, and T is temperature
Obviously, as T increases, R has to increase.
w.
You are confusing total power (SB law) with a specific frequency (long wave.) See Wien’s displacement law to correct your error.
You cannot use Stefan-Boltzmann’s law to make an assertion about long wave radiation.
I think you are trying to say that I can have a radio station put out 1KW of power at 1Mhz and one that puts out 1KW of power at 3Mhz. Both put out the same power but that doesn’t determine the frequency at which the power is transmitted.
If you use Planck’s Law you’ll see that Willis’s comment is correct, as temperature increases then the more long wave radiation is emitted.
300px-Wiens_law.png
Your diagram does not cover LWIR which is 8,000 to 14,000nm in wavelength. It stops at 2000. Also note the name of your picture… “WEINS LAW” which I alluded to in my previous post.
I thought that it was apparent that the whole curve moves higher as temperature increases as Planck’s Law states.
The graph illustrates both Planck’s Law and Wien’s Law (the latter only refers to the position of the maximum). Here’s a plot which covers the wavelengths you are interested in (T 200-300K)
goody-1989-clear-sky-spectrum2.png
Do climate models mimic any of this? My assumption is no.
I’m surprised no one has asked about the very low correlation factors in central Africa and northern South America compared to the land area in the northern hemisphere.
Is water vapor over land that poorly distributed in the southern hemisphere compared to the northern hemisphere?
‘I’m surprised no one has asked about the very low correlation factors in central Africa and northern South America compared to the land area in the northern hemisphere.’
Good observation, Tim. Also notable from WE’s Figure 1. is that it’s showing the correlation of surface temperature to BOTH DSR and DLW radiation. Assuming DSR invariably heats both land and ocean surfaces, I would think that ‘backing out’ DSR from the graph would show that DLR has even less correlation, i.e., impact, on ocean temperatures, which would lend credence to Jim Steele’s recent posting that DLR does not warm the oceans.
I suspect that it’s because Central Africa/Northern South America are in the deep wet tropics, so the conditions there allow occasional reversals of causations—not enough to make the entire correlation negative, but enough to lower it towards zero.
w.
Curious. Why are the tropics so wet? Does WV not get well-mixed as CO2 supposedly does?
Some parts of North America are wet although not as warm as in the tropics. Why don’t these ares show up (think Louisiana, Mississippi, Alabama, etc.) with a lower correlation as well? The average rainfall in Columbia is about 30in while in Louisiana it is closer to 50 inches.
I’m not questioning your research, I think it is unique. I am really questioning whether the data itself is suitable for the purpose.
Nicely argued, Willis.
Fair to deduce that “The Earth sweats”?
There are a couple of recent papers that add to understanding.
……….
First, two linked papers, May 2022, by Demetris Koutsoyianis et al
Revisiting causality using stochastics: 1. Theory | Proceedings of the Royal Society A: Mathematical, Physical and Engineering Sciences (royalsocietypublishing.org)
Revisiting causality using stochastics: 2. Applications | Proceedings of the Royal Society A: Mathematical, Physical and Engineering Sciences (royalsocietypublishing.org)
In summary, using detailed concepts of causality, they propose that globally, change of CO2 in the air is driven by temperature change. This is the reverse of the IPCC CO2 control knob conjecture.
……….
Second, as you know, the paper by van Wijngaarden and Happer on the saturation of absorbance of IR by CO2, so that further increases in atmospheric CO2 levels can have little effect on air temperatures. (This also is my short summary. The papers have caveats that need to be understood.)
2006.03098.pdf Dependence (arxiv.org)
……..
Third, again as you know, the IR-heat physiucs depends in part on the wavelengths of the IR. Not all absorbers behave the same. As a practical example, here is a sentence from an abstract “The results showed that plates coated with paints containing IR-reflecting pigments displayed lower air temperature on the opposite side as compared to conventional coatings, indicating that they can be effective to reflect NIR and decrease the temperature of buildings when used in roofs and walls.”
SciELO – Brazil – Development of paints with infrared radiation reflective properties Development of paints with infrared radiation reflective properties
………………..
Colleague Rick Willoughby has often blogged on matters like you describe. Putting it all together, there is about enough material to discredit the importance of CO2 as a significant influence on current global temperatures, even enough to claim that measures to save the World from fossil fuels are futile, also horribly costly..Geoff S
‘Putting it all together, there is about enough material to discredit the importance of CO2 as a significant influence on current global temperatures…’
I would also include WE’s masterful analysis of Westerhold et al’s CENOGRID dataset, here:
https://wattsupwiththat.com/2020/09/15/cooling-the-hothouse/
Basically, if CO2 wasn’t the ‘control knob’ during the previous 65+ my, it sure in heck isn’t going to be problem going forward.
Frank,
The people pushing CO2 control often said if it is not CO2, what causes temperature change? Thanks to people like Willis and Rick, plus earlier researchers, we are seeing before us an emergent phenomenon, a viable process alternative to CO2.
Interesting times. The scatterplots by Willis, like figure 3 above, are a fascinating way to display very large numbers of observations in a way that allows clear interpretation. Kudos. Geoff S
‘The people pushing CO2 control often said if it is not CO2, what causes temperature change?’
Geoff,
They do say that, and as you and I both know, that’s a logical fallacy, i.e., an argument from ignorance. I do like WE’s work on emergent phenomena, but am concerned that if we have to wait until everyone agrees on a complete analysis of how our chaotic non-linear climate system works, we’re simply going to have ‘net zero’, and whatever else the Left has in store for us, crammed down our throats.
That’s why I mentioned WE’s CENOGRID analysis – by plotting temperature vs log CO2 and introducing the element of geological time, it becomes clear that CO2 has never been the ‘control knob’, especially after others subsequently pointed out how temperature changes actually corresponded with continental drift. That’s also why I appreciate Pat Frank’s work on GCM error propagation – again, not an attempt at developing a ‘universal’ climate theory, but rather clear evidence that the GCM temperature projections based on CO2 forcing are meaningless in scope compared to the much larger cloud errors inherent to the models.
Please do not let this detract from your study of Willis arguments. It is a personal philosophical point.
At 17 years of age I was starting to fly military aircraft, typically with an approach to the airfield of 1000 feet above ground level. That measure of 1000 feet is also roughly where clear sky is below and cloudy sky is above. There are exceptions of course. But, if you go to your window now to look out, you will possibly see, as is common, that the cloud base is a distinct layer (though mountains interrupt the pattern).
Since those early years, i have tried to discover the scientific explanation of the existence and height of the cloud base, feeling now that it is tied in with the observations that Willis shows.
Does anyone have a link to this? Please tell me to save an old man from his misery? GeoffS
The first time I soloed in a single-engine light aircraft, I was busy after takeoff checking instruments and adjusting the flaps. When I looked out after a few seconds, I discovered to my horror that I had flown into the cloud deck at about 1,500′ in the Santa Cruz mountains of Northern California. I gently pushed the nose down, and came back into clear air after about 5 seconds. I obviously survived the serious mistake.
Willis … love reading your stuff. I was hoping you could help me understand something, as you are a lot smarter on this than me, so, I have a question. Wien’s Law says the peak wavelength of radiation for a given body at any temperature can be calculated in an inverse correlation, with the hotter the temp, the shorter the wavelength. The earth radiates at about 10 um peak. CO2 primarily radiates at 15 um, 15 um as a peak for an object gives a temp of -80C. The earth is radiating on average at a temp of 15C. I know it’s all a matter of Wm2, but how can a theoretically colder wavelength warm a body radiating at a stronger wave length?
Dr. Deanster, see my post “Can A Cold Object Warm A Hot Object” for a discussion of this question.
w.
Wien’s law applies to black bodies, CO2 is not a blackbody emitter it emits at specific wavelengths corresponding to quantum mechanical motions of the atoms in the molecule. The mention of -80ºC in connection with CO2 emission is a fallacy. The hotter the CO2 the more 15µm radiation it will emit.
Phil,
Do you have any numbers on the energy that a CO2 can gain through molecular capture of a photon? Are you aware of any theoretical limits to the maximum energy by which it can be raised? Links? Geoff S
Here’s the energy diagram of the various vibrational modes of the CO2 molecule.
How_Carbon_Dioxide_Absorbs_Earths_IR_Radiation_4.jpg
The bending mode is the one that’s the one that’s of interest in our atmosphere.
So by absorbing a single photon the CO2 molecule gains ~0.082 eV which it can then either lose by radiation or collision with surrounding molecules.
The asymmetric stretch is also IR active but is not in a particularly active part of the spectrum (high for solar, low for Black body).
Thanks, Phil.
Just what I was looking for. Now I shall multiply that single molecule energy by the number of CO2 molecules around the globe and have a ponder. Geoff S
Sorry, meant to say “the hotter the blackbody is the more 15µm radiation it will emit”. Photons have wavelengths, not temperatures, when a surface is struck by a photon it absorbs it (or not) based on its wavelength, a 15µm photon is treated the same whether it was emitted by a source at -80ºC or 40ºC.
“And the existence of the negative correlation discussed above is a testament to how “simple physics” is completely inadequate to explain the unbelievably complex, chaotic climate system”
Absolutely true – if one fails to understand simple physics. However..
Also, I suspect that the abundance of marine biota might have a fairly large effect on heating the ocean by sunlight via its effect on optical density. Geoff S
Willis, I would be interested in your comments on the Nino 3.4 region, which has an average annual temp of 27.02C and a std dev of only 0.59C, and the regression line is absolutey flat from 1982 to the present.
However, the Nino 1.2 region’s temp is only 23.25C, and the std dev is 0.79 which is greater. The regression line shows about 2oC of cooling over this period.
Slightly off topic, can someone please explain why even in still air a cloud would form around the summit of a tropical mountain at sun rise.
I spent some time in Rabaul, 4d 14m south. A group of people with the grandiose title of the Rabaul Mountaineering Society wanted to photograph Rabaul from the summit of Mother volcano, 2250+ft. We would climb the thing in the early morning reaching the summit before sun rise. We could see Rabaul layed out below us in a blue hazy light, which did not support photography.
As the sun appeared above the 7000ft New Ireland the cloud would start to form around us, cooling the air. We would be in moderate cloud before the sunlight started to illuminate Rabaul. This happend every time we chose, about 15 times in a year.
There were some days that mother was clear, but never one we tried. This was in still air, so not the usual island trade wind cloud. Any answers?
There is also a concept in statistics called autocorrelation. Cause and effect are auto correlated.
I love your hypothesis about the emergent temperature regulation mechanism! It rings true in the best tradition of the scientific method, and of common sense.
There is only one thing that bugs me about so many dissertations on “the climate” – which is that solar radiation reaching the ground is composed only of “shortwave” (visible and UV) frequencies! This is not correct. Solar spectral intensity at earth’s surface is composed of 49% IR, and visible is 42% and UV only about 8%, as per this site as reference:
https://www.fondriest.com/environmental-measurements/parameters/weather/photosynthetically-active-radiation/
This chart
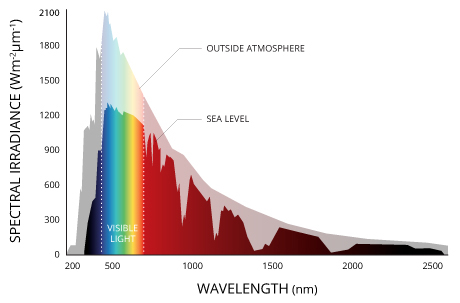
Shows the frequency vs radiant energy flux in W/m². You can clearly see the visible area under the curve is less than the IR area under the curve – verifying the above percentages at earth’s surface.
One of the primary heat or IR sensing organs are in the palms of our hands. Or shall I say some of the most sensitive IR sensing receptors are in the palms of hands (all our skin has IR sensing capability). We can sense the IR from a cast iron stove, a campfire, or the sun. So yes, your opening preamble is correct, we have an experiential reference to radiant energy (IR). Not only can we sense hot solid or liquid objects, we can sense the immense amount of IR from clear sunshine.
This rant does not detract from your excellent essay, I am just bugged by how so many, even learned folks ignore or dismiss the sun’s ground level IR component. (I assume you were simplifying your argument, nor ignoring solar IR)
No, that is not the only conclusion. Remember correlation is not causation, in either direction. There could be another parameter affecting both variables in different ways.
Secondly, even if the causation was reversed you would still have a positive corr. coeff. That is not what a negative c.c. means.
c.c. of 0.2 to 0.5 is not that high.
I’m actually sure that Willis knows all this, I’m just surprised that he states it so badly.
I should also add that I’m a great fan of his work on negative climate feedbacks , it’s just a shame he presented it badly because there are so many out to dismiss anything other than CO2 control knob that you don’t want to make it easy for them to pick holes and dismiss it.
Thanks, Greg. My point was that more energy input = higher temperature is well-established physics. So when we find a situation where more energy input = lower temperature, it strongly suggests that the energy input is no longer controlling the temperature.
Instead, it suggests that the temperature is controlling the energy input, and in addition, that it is doing so in the opposite sense—higher temperatures leading to lower incoming radiation. And indeed, that’s what we see in Figure 2.
You say:
But there’s no inherent reason for that to be true. We are talking about an entirely different mechanism (temperature control of clouds) than was present when correlation was positive (radiant heating of an object).
w.
Willis says… “Now, this is a most interesting result. Everywhere over the land, with no exceptions, the correlation is just what we’d expect—not only positive, but in general strongly positive…Over the land, when absorbed radiation increases, temperatures do in fact go up, and vice versa. Positive correlation. Simple physics.”
“But over large areas of the tropical ocean, shockingly, there is negative correlation…
From that, we can only conclude that in those areas, the causation is going in reverse. Instead of total absorbed radiation determining temperature, the temperature is determining total absorbed radiation.”
“A primary mechanism that explains this apparent impossibility is the temperature-controlled emergence of cumulus fields and thunderstorms. These increase with increasing temperature, and they greatly reduce the amount of solar radiation absorbed by the surface. And so the temperature is regulating the amount of absorbed solar radiation, via clouds and thunderstorms.”
Excellent and illustrative. As energy is never lost I find looking at ALL weather phenomena in the context of incoming energy “residence time”, and assert, “Only two things can affect the total energy of a system (Earth atmosphere, and Oceans) in a radiative balance; either a change in input, (solar variance) or a change in residence time of said input within the system.” The residence time within the system is determined by the materials encountered, and varies from nano seconds, (cloud albedo) to millennium (deep ocean residence time)
Conclusion – increase residence time and you increase total energy, decrease residence time and you decrease total energy.
Given that universal fact, allows me to alter the last paragraph quoted without changing the meaning…
“A primary mechanism that explains this apparent impossibility is the temperature-controlled emergence of cumulus fields and thunderstorms. These increase with increasing temperature, and they greatly reduce residence time of TSI absorbed by the area. And so the materials said insolation encounters are regulating and reducing the residence time of absorbed solar radiation, via clouds and thunderstorms.”
It would be interesting to see the same graphics from this excellent article on a seasonal basis where, in the SH summer “shockingly” there is a negative correlation to atmospheric T, which cools, despite an increase of 90 watts per sq m due to the earth being closer to the Sun. NH albedo increases with snow, decreasing insolation residence time, and perhaps the oceans absorb more insolation, temporairly reducing that insolation from warming the atmosphere, and or perhaps total SH cloud cover increases, also reducing insolation residence time, and or ? Does the earth (land oceans and atmosphere combined), gain or lose energy during the SH summer? We know the atmosphere reduces energy and T
GHG warming can also be said to work via increasing the residence time of ULWR, but that increase on a Watts per sqM basis is tiny compared to other materials encountered changes in residence time. And it is also true that at high elevation GHG can shorten the residence time of some energy within the system, via radiating said energy to space, that non GHG would NOT do.
Yet every single factor (plus solar changes) mentioned in climate can be looked at by its effect on residence time of said insolation.
Willis your predicted correlation math’s is incorrect. You ignore sun distance and effect on energy received. That doesn’t correlate. Jan 1.48 billion km (1407w-m2) vs July 1.52 billion km (1316w-m2).
Land is majority northern hemisphere. January has millions of km2 of snow cover due earth’s tilt. Northern hemisphere cooled to -1.68°C (in thermal energy that’s 307w-m2 1228w-m2) Jan 26th when sun power was 1407w-m2. Northern hemisphere peaked 16.91°C when sun was 1315.79w-m2. There is no correlation between solar downwelling and surface upwelling. You have seemed to have made up a correlation. Below is a way to correlate them. Which has worked for me. Positives above the average thermal energy is added up. Averaged over 26 weeks and comes to 886.6w-m2. Doubled equals 1773.1w-m2. This includes kinetic energy in joules/watt x2 (412.7w-m2) subtract 1773 = 1360.4 – (solar heat that stops cooling (x4)) 428.0 equals 932w-m2 divided by 4 = 233.10w-m2. 233.1+107=340.1wm2.
Stephen, it’s true that instantaneous downwelling solar energy is higher when the earth is closer to the sun.
But Newton’s Laws mean that it is moving faster at that time, so so it spends less time in the area of greater energy. And the reverse is true—when the energy is less, the earth is moving slower so it garners more energy.
And since both gravity and energy fall off as the square of the distance, these exactly cancel each other out.
The net result is that the northern and southern hemispheres get the same total energy over the period of a year.
My best to you.
w.
A recent study by Bartlett and Bullock 2016 in the context of “Artificial Life” showed that a complex heat engine containing multiple dissipative fluid systems could exhibit emergent thermal homeostasis, restricting temperature to a narrow range:
https://direct.mit.edu/isal/proceedings/alif2016/608/99454
https://ptolemy2.wordpress.com/2021/07/08/emergent-thermal-homeostasis-a-new-paradigm-for-ex-pluribus-unum-climate-stability/
Specifically they propose that:
We demonstrate the emergence of spontaneous temperature regulation by the combined action of two sets of dissipative structures…
[The system] shows striking resilience to imposed temperature variations. Not only does the system maintain its emergent patterns, but it is seen to effectively regulate its internal temperature, no matter whether the boundary temperature is warmer or cooler than optimal growth conditions. This thermal homeostasis is a completely emergent feature.
There is little doubt that Willis is correct that climate exhibits emergent thermal homeostasis. All that remains is for the climate research community to educate itself regarding such systems and the theory behind them.
Looks fascinating. I’ll take a look.
Thanks,
w.
I had to laugh at this line. Now if greenhouses gases don’t include nitrogen and oxygen then we have a serious problem. The molecules in these gas’s velocity (1.2 million km per hour).
Carbon dioxide velocity is 1 million km per hour. Carbon dioxide velocity has to be equal or higher than nitrogen and oxygen to be able to heat them up and give 1.2 million km speed. Not be slower.
Solar energy heats gases above an average 11km altitude. Around where cooling stops. The gases average around -48°C. These gases are methane, carbon dioxide and ozone. Any moisture removes heat so lowers the average temperature to -64°C. That’s 107wm2. Kinetic energy in joules heats the air (plus solar heated emitted radiation 17wm2) at the surface 216wm2 (107+216+17=340)
1.4 x 1.29g x 334 meters per second squared divided by 932 = 216wm2.
Willis: greenhouse gases CO2 0.6g and 5g of water vapor have 50C of heat (255 w-m2). I don’t think so.
“we inhabit a world that is balanced at a temperature on the order of 50°C warmer than it would be without greenhouse gases”
Something of a misunderstanding here, firstly all the molecules of each gas travel at different speeds. Here’s a graph:
MaxDn.png
An excited CO2 molecule will vibrate and if it collides with a O2/N2 molecule can transfer energy and accelerate the collisional molecule. The CO2 molecule loses its excess vibrational/rotational energy which is transferred to the kinetic energy of the collisional molecule.
Thanks Willis, Very interesting but not a surprise for me; with the statistics merely confirming the sort of thing that could well happen when you look at the thermodynamics of the Evaporation Process (EP) in detail.
For what it’s worth:
First EP takes place at CONSTANT TEMPERATURE which appears odd ; but well confirmed by the Water Phase diagram. Next we have the Solar Enthalpy absorbed by water at the Ocean Surface being converted into Volume rather than Temperature. (Note here that Volume is inversely proportional to Temperature in the GasLaws). Next we have this Volume making the Vapor generated becoming buoyant wrt. dry air; hence forcing the Enthalpy involved (Denoted as Latent Heat) to rise UP through the atmosphere for dissipation in the Clouds with some to Space. (This being an intrinsic part of the Hydrological Cycle, working here as a Rankine Cycle.)
It seems here that the clouds are the result of the above not the cause which you appear to contemplate. Meanwhile it looks as if these clouds have pinched all the energy which should have warmed the oceans!!
Delving deeper: From the Engineering Toolbox Site the empirical equation :
EP rate = QA(Vp- Pp) where A is area, Vp isVapour pressure and Pp is Partial pressure.
Q is a coefficient as (25+19v) with v being the Wind velocity. This EP Rate thus is a function of the difference between the prevailing Vapour and Partial pressures involved.
Now the Vapour pressure depends on the temperature; but the Partial pressure is determined by the absolute humidity prevailing. The maximum Partial pressure occurring at the 4.2 % humidity. Which appears to be the stable value in the Earth’s atmosphere.
Between circa 22 and 30 degC the Vapour pressure rapidly rises and takes off like a rocket after about 30degC; but the Partial pressure remains fixed.
Hence; above circa 30degC the Evaporation Rate swamps any incoming radiation thus preventing any further rise in temperature.
Supporting the above is the FACT that the Oceans never get much above this 30degC figure, in spite of millions of years of relentless Solar Radiation.
Boiling water maintains a constant temperature, if stirred. However, evaporation takes place from a container of water before it reaches the boiling point. The amount of water vapor above the surface controls the rate of evaporation through its partial pressure. If wind removes some or all of the water vapor, the rate of evaporation increases at any temperature below the boiling point. The process is the same for ice, except that we call it sublimation instead of evaporation.
Willis, you know what I’m going to suggest…
You have, I believe, demonstrated that the world regulates at a reasonable temperature. However, what happens when we try to break the mechanism?
The Sea of Marmara shows what happens when pollution breaks the process.
JF
So … is it always true that if more radiation is absorbed by some object, it gets warmer?
Yes
Well … consider what happens when you walk outdoors during the day. Immediately you are absorbing hundreds and hundreds of watts of additional energy from the sun.
But despite absorbing a large amount of solar radiation, your overall average temperature is unchanged … more radiation has not made you hotter.
Piffle.
“consider what happens when you walk outdoors during the day. Immediately you are absorbing hundreds and hundreds of watts of additional energy from the sun.
But despite absorbing a large amount of solar radiation, your overall average temperature is unchanged … more radiation has not made you hotter.”
Saying something does not make it true.
In fact if you put most objects outdoors during the day euthanasia the sun shining they will absorb energy, then emit it as IR.
Thin aluminium foil, large surface area to mass and good conductivity will become hotter quickly.
A swimming pool on any tropical island where Willis has been like Bali will heat up slowly.
A cowboy staked out in the desert will slowly develop and possibly die from his hyperthermia.
A human body has adaptive mechanisms that lead to evaporation that can help regulate heat exchange for a while
With that as a prologue, let’s look at the correlation between the earth’s surface temperature and how much radiation the surface is receiving.
Fine .
The data does not show negative correlation.
It cannot.
What it shows is that different surfaces react differently to the same energy input.
the graph is not one of negative correlation but simply one of temperature response of different surfaces.
Proof?
Consider a planet or object made out of a more uniform surface.
Like the moon.
Instantly all irradiated surfaces at the same distance from the Sun take on the same temperature.
What Willis is showing is a temperature response graph of surfaces.
All the surfaces would increase in temperature with extra energy input but land and sea just do so at different rates.
Hence
”A primary mechanism that explains this apparent impossibility is the temperature-controlled emergence of cumulus fields and thunderstorms. These increase with increasing temperature, and they greatly reduce the amount of solar radiation absorbed by the surface.”
What?
The amount of energy reaching the surface is….less?
Who would have thunk that clouds would block off and reduce the solar energy reaching the ground.
Ceres obviously sees no problems.
The graph is not comparing temperature to solar radiation but variable received solar radiation depending on how many clouds are in the way lowering the temperature.
My view is that you say something very important, and I do agree with your statements. To me it is obvious that something regulates earth’s temperature. The temperature stability is astounding. I do find the “cumulus”-hypothesis very plausible. Temperature controls the incoming radiation, not the other way around.
However, one question – how can we understand the historical temperature changes if this regulation mechanism exist. To be clear – I am not questioning the concept, just trying to fit the concept into the natural climate variations that do exist.
“And so the temperature is regulating the amount of absorbed solar radiation, via clouds and thunderstorms.”
I doubt it’s that simple. There is around 200 W/m^2 of latent heat transported into much of the warm pool, and latent heat is the main driver of the convection creating clouds and thunderstorms.
And yet, lgl … see Figure 2. There is very obviously a clear and close connection between temperature and downwelling cloud radiation.
w.
w.
If that graph was following a straight line or some other simple function there could have been a clear and close connection between the two, but it is in fact showing a very strange connection, with a break-point, and for sure is not proving a causation. CRE being a function of temperature that is.
Thanks, lgl. I didn’t say there was a linear relationship between the two … and in fact, that kind of linear relationship is uncommon in climate science.
In this case, the phenomena involved (cumulus field formation, thunderstorm formation, rainfall, deep tropical convection) are temperature threshold-based. Below a certain threshold, they don’t appear at all. Above the temperature, they appear rapidly in large numbers.
See my post “Drying The Sky” for more examples and a detailed discussion of temperature threshold-based climate phenomena.
w.
Thanks, that’s right to my point. That rain did not evaporate from the same place it fell. In parts of Norway there is also 3 meters of yearly rainfall. Needless to say that is not because the north sea is above 27 C. (yes, there are mountains, so not directly comparable)
In the pacific the large area of negative correlation (fig.1) does not fully overlap the warm pool. It’s shifted far eastwards. In the similar figure from you a year ago (wonder why they are so different) the negative area matches the area of negative OLR anomali of a central pacific El-Nino. I take that as evidence of the negative correlation being more a result of ENSO moving moist and thereby deep convection around, than a pure response to temperature. There is much more than temperature involved in ENSO.
Imo it’s more correct to state the temperature will not go above 28 C unless there is deep convection, with exceptions of course. The solar input is simply far from enough.
https://virakkraft.com/Radiation-temp-corr_OLR.pdf
Willis, I tried this message on your website’s open thread but it didn’t show up, so I will try here.
I see you are interested in atmospheric energy transfers by vortex processes.
A paper on “Powerful atmospheric vortices at low and high latitudes” may interest you.
the author is S. N. Artekha at the Space Research Institute: Moscow.He publishes in English and Russian, seems to be a generalist by his record which is here orcid.org/0000-0002-4714-4277
Willis, Sorry, my reference was in English but I see the original is in Russian
Here is the DOI 10.25791/infizik.02.2019.482
No good to me unless it’s in english somewhere.
w.
“The more radiation absorbed by some object, the hotter it gets.”
You can also say, the colder an object is, the more heat it absorbs. The hotter an object gets, the less heat it absorbs.
So, if co2 increases heat absorption, it means that co2 cools. Which is why co2 is an industrial coolant, because it absorbs so much heat.
“The more radiation absorbed by the planetary surface, the hotter it gets.”
And the hotter it gets, the less heat it absorbs. Self regulation. Since heat supply from the source(sun) is limited and constant, the system self regulates. This manifests as, for example, increased cloud cover from more evaporation, which reduces absorbed heat from the sun, and also carries more heat away from the surface and dumps it at altitude, and then cold rain falls on the surface cooling it even more.