Originally posted at ClimateREALISM

This past week, both the U.S. and Europe have had significant localized heatwaves. The one in Europe is particularly bothersome for the media, since the area is not prepared for temperatures that exceed 100°F like areas in the in the United States in places like California, Texas, and Oklahoma, where air conditioners are the norm, regularly experience. The mainstream media has uniformly blamed the heatwaves on human caused climate change. This attribution is wrong.
The headlines have been truly apoplectic, and absolutely wrong. For example:
With Record-Breaking Heat, Europe Glimpses Its Climate Future [Scientific American]
Climate change is killing people’: Europe’s extreme heatwave continues [EuroNews]
‘Climate change affects everyone’: Europe battles wildfires in intense heat [Reuters]
And in the United States, the media hype is just as wild and just as false:
The climate crisis is driving heat waves and wildfires. Here’s how [CNN]
How the heat dome in Texas is related to climate change [Yahoo News]
Every summer in the Northern Hemisphere, it gets hot; that’s what summers do. Also, every year, a localized heatwave occurs somewhere in the world.
The error that is common to all of these news articles is the fact that weather is not climate.
Weather is an event that might last for minutes to a few days. A heatwave is a weather event that is typically linked to large scale weather patterns, such as a high-pressure cell which can create heat-domes in the summer. Climate is an average of weather over a thirty-year period as defined by the World Meteorological Organization. Note my highlights:

Each of these stories trying to link climate change to the heat wave does so without any proof whatsoever. They are nothing more than speculative fearmongering.
And, it isn’t limited to print and Internet media, the TV stations are overhyping it as well to make it seem like a crisis with the use of color. Figure 1 is a comparison of TV graphics on the British Broadcasting Corporation (BBC) in Summer 2012, versus Summer 2022.

Note that in 2012, some of the temperatures were actually higher, and they didn’t need to fill in areas with red to make it look worse than it actually is.
Another thing that you won’t find reported in the BBC on in the newspapers/Internet media is the fact that while record heat was going on in Western Europe, Eastern Europe was experiencing well below average temperatures. Figure 2 below shows the juxtaposition of heat in the UK and Europe compared to the below normal temperatures in Eastern Europe, which the press has ignored.

That dramatic regional temperature difference seen in Figure 2 is a sure sign of this being a weather pattern, and not global scale climate change aka global warming as the media would have you believe. The same applies to the heat wave in the U.S. as seen in Figure 3. It is regional in its scope, not global.

As reported in Climate at a Glance: U.S. Heatwaves,
…in recent decades in the United States, heat waves have been far less frequent and severe than they were in the 1930s.
The all-time high temperature records set in most states occurred in the first half of the twentieth century.
The heat wave of 1936 was far deadlier. To their credit, The Washington Post got it right in this report:
The killer U.S. heat wave of 1936 spread as far north as Canada, led to the heat-related deaths of an estimated 5,000 people, sent thermometers to a record 121 degrees Fahrenheit in Steele, N.D., and made that July the warmest month ever recorded in the United States.
But the real issue is that extended high temperatures like the U.S. and Europe have experienced this month have happened before climate change became the universal go-to for blame. It only takes a small amount of research to discover these facts.
A search of the term heatwaves, on Wikipedia, for instance, finds that a heatwave and drought in 1540 in Europe lasted for 11 months, and that a heatwave in 1757 was the hottest in the past 500 years until 2003. Also, Netweather Community TV, called the 1906 heatwave in the U.K during August and September, “one of the most exceptional heatwaves to ever occurred in the UK.” A 1911 heatwave in France contributed to more than 41,000 premature deaths. More recently, in Europe, there was a massive months-long heat wave in 1976. This came at a time when the Earth was experiencing a 30 year cooling trend, that led many scientists to warn the next ice age was looming. Wikipedia’s entry on the 1976 event reports:
The summer of 1976 was considered to be the hottest summer in Europe, and especially the United Kingdom, during the 20th century. A large high-pressure area dominated most of Europe for all of the summer months. The pressure system moved into place in late May 1976 and remained until the first traces of rain were recorded on 27 August.
. . .
For the entire period much of Europe was bathed in continual sunshine with the United Kingdom seeing an average of more than 14 hours of sunshine per day. 1976 was dubbed “the year of the ladybird” in that country due to the rise in the mass numbers of the insect brought on by the long hot period. In the United Kingdom, the summer coincided with a 16-week dry spell, the longest recorded over England and Wales since 1727.
That high pressure pattern is almost identical to what has been seen in UK and Europe today. The difference is that the media today immediately goes to blame climate change rather than weather patterns, and in the case of this article in The New York Times, they even try to convince you that comparisons between the hot summers of 1976 and 2022 are somehow “misleading.”
“Yet the comparison to 1976 is misleading. The highest recorded temperature then was 35.9 degrees Celsius, whereas on Tuesday it surpassed 40 degrees.”
The BBC reported:
“Thermometers hit 40.3C at Coningsby in Lincolnshire, while 33 other locations went past the UK’s previous highest temperature of 38.7C, set in 2019.”

What the BBC and the NYT don’t tell you is that the 40 degree Celsius (104 Fahrenheit) was set at a Royal Air Force (RAF) base next to the heat absorbing sea of runway asphalt and tarmac. Figure 4 shows the temperature hour-by-hour that day and where it was recorded.
By contrast, the BBC reports “…the [previous] highest temperature ever recorded in the United Kingdom was 101.7 degrees, observed in Cambridge [at Cambridge University Botanic Garden] in July 2019.“
A botanical garden is an entirely different environment than an RAF air base. The latter would be expected to be much warmer due to the lack of shade, the heat absorbing materials present, and the hot air expelled from jet engines. So, the “misleading” claim of the NYT is really about the lack of solid journalism in reporting the environment under which these temperatures were recorded.
It is well-known that the Urban Heat Island (UHI) effect can contribute to warmer high temperatures, and given the UK went from 56 million people in 1976 to 67 million in 2020, it isn’t the least bit surprising that the UHI increased as infrastructure to support that 11 million extra people was added to that island nation.
The final word comes from meteorologist Cliff Mass, PhD, who did a thorough analysis of the short-lived heatwave event and writes (emphasis his):
The truth and overwhelming scientific evidence provide a different story: the recent European heatwave is mainly the result of natural processes but was enhanced modestly by human-caused global warming.
The situation is very much like the [Pacific] Northwest heatwave of last summer; with many of the same elements.
…
The bottom line is that the recent European heat wave was caused by an amplification of the northern hemisphere wave pattern, with global warming contributing perhaps 5-10% of the warmth. Natural variability of the atmosphere was the proximate cause of the warmth and does not represent an existential threat to the population of Europe.
Clearly, there’s no cause for alarm, no matter what the media says. But the media won’t tell you any of that, because it ruins their narrative of being able to blame the heatwave on climate change, while hoping you don’t notice their distortion of the truth about ordinary weather events we see every summer.

Anthony Watts is a senior fellow for environment and climate at The Heartland Institute. Watts has been in the weather business both in front of, and behind the camera as an on-air television meteorologist since 1978, and currently does daily radio forecasts. He has created weather graphics presentation systems for television, specialized weather instrumentation, as well as co-authored peer-reviewed papers on climate issues. He operates the most viewed website in the world on climate, the award-winning website wattsupwiththat.com.
I have my own 52 year temperature recordings, I live within the CET area and my records closely follow the CET. My own 52 year record was 34.5c and was broken by 2c coming out at 36.5c it lasted all of ten minutes around 2.40pm and dropped away soon after.
Records can be broken both hot and cold almost anywhere given the right conditions, whether or not there is a human element.
CET temperatures have been stable for for 25 years, Globally we are in a near eight year hiatus. Given this current global stability, when it is exceptionally hot in one part it has to be exceptionally cold in another, (as was the case in this UK hot spell, it was very cold east of the ridge), balancing out the hotter conditions under the ridge, otherwise global temperatures would have to increase. It seems that incoming radiation equals outgoing radiation at the moment as the CERES data suggests.
Not to mention the current increase in the Arctic Sea Ice or a cooling Antarctica. If only climate science was settled it would make life a lot easier.
My question is: why doesn’t the increase in CO2 affect winter temperatures in the southern hemisphere?

1) The Arctic relies on heat energy from ocean circulation to warm it via the NAD, AMOC and Gulf Stream towards the Arctic ocean.
2) CO2 is not warming the ocean to any noticable amount whereas the decline in global cloud albedo (~5%) is responsible for increasing SWR.
3) During Winter no solar radiation keeps the poles very cold but the Arctic has 1) to warm it, whereas there is no ocean warming source for Antarctica.
4) Antarctica virtually relies only on CO2 for warming in Winter and therefore this is obviously having no or very little affect.
5) With the southern hemisphere having significantly more ocean it takes longer to warm especially with low solar radiation levels during Winter.
https://www.science.org/content/article/rising-atmospheric-carbon-dioxide-actually-cools-part-antarctica
This is an interesting article and since when does CO2 works both ways?
It simple can’t it either cools or warms unless it reaches a certain threshold or limit. With it increasing vaporation then it causes cooling.
If this article was correct then this is the evidence required the CO2 causes cooling not warming.
The reason why this would be observed here is for my reasoning number 3 & 4.
This is not true, as the sea current drains warm waters into Antarctica, as shown in the graphic.
The Antarctic Circumpolar Current (ACC) circles around Antartica.
“The current is circumpolar due to the lack of any landmass connecting with Antarctica and this keeps warm ocean waters away from Antarctica, enabling that continent to maintain its huge ice sheet.”
The ACC drains warm currents into it moving it away from Antarctica itself and becomes a huge barrier between the continent and circumpolar current.
No warm ocean currents go within the circular ocean current shown on the map link below.
The reason why ocean surface temperatures are so cold around Antartica a long way from land.
Currently, the temperature at a depth of 150 meters off the Antarctic Pacific coast is higher than the temperature in the Arctic Pacific.
The higher temperatures are near 50S on line with the tip of South America, still a long way from the Antarctic coastline.
The ACC deep current keeps the warmer temperatures away as shown below.
https://upload.wikimedia.org/wikipedia/commons/a/ab/Thermohaline_circulation.svg
“It is amazing how often theorists discount anything to do with the oceans and their movement and the result of their force and those forces acting upon it. Yet, the process is one of high degree, which results are inescapable.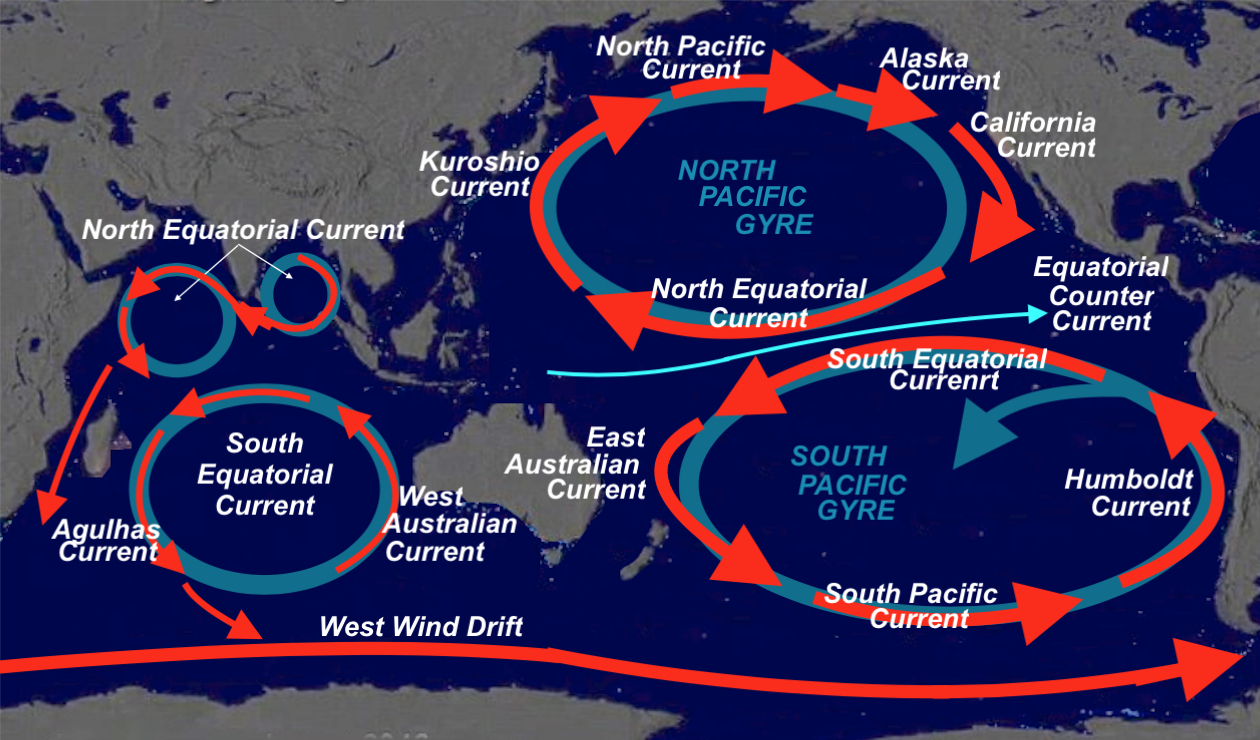
As an example, as the earth rotates from west to east, water near the equator tends to move from east to west, due to the prevailing winds. This leads to the formation of Equatorial currents, both North and South of the equator. Obviously, to the north is the North Pacific Gyre, which rotates clockwise, while to the south, is the South Pacific Gyre, which water rotates counter-clockwise.”
http://nephicode.blogspot.com/2019/07/lehi-and-counter-current-pasrt-i.html
I agree, the ocean has a huge influence on the planet.
Shows ocean temperatures leading atmospheric temperatures.
https://www.woodfortrees.org/plot/wti/plot/hadsst3gl/from:1980
Shows how the warming since 1980 come about with the AMO moving to its positive phase.
https://www.woodfortrees.org/plot/wti/plot/hadsst3gl/from:1980/plot/esrl-amo
After all, the Earth is a planet of water, and the surface of the ocean does not exceed 31 degrees C, and at this temperature high convection turns on. This limitation is due to the Earth’s average atmospheric pressure.
The ACC deep current has a huge influence on the Antarctic preventing warm ocean currents from reaching it via the Aqulhas current or the South Pacific current.
During La Niña, surface currents merge with circulation in the atmosphere.
The planet does seem to have a self regulation energy mechanism with negative feedback. Surface temperatures warm so far increasing evaporation and then form clouds with a limit has been reached preventing them from heating the surface any more. The limit looks like around 30c and will never likely be any higher in future.
Also correct about La Nina where trade winds causing more upwelling bring up water from lower depths to the surface and interact with the atmosphere.
The current sea ice extent in the Antarctic is at the record low for the day in the satellite record.
This is evidence that an ocean current is pulling warm water from the western Pacific to Antarctica.
“It is amazing how often theorists discount anything to do with the oceans and their movement and the result of their force and those forces acting upon it. Yet, the process is one of high degree, which results are inescapable.
As an example, as the earth rotates from west to east, water near the equator tends to move from east to west, due to the prevailing winds. This leads to the formation of Equatorial currents, both North and South of the equator. Obviously, to the north is the North Pacific Gyre, which rotates clockwise, while to the south, is the South Pacific Gyre, which water rotates counter-clockwise.”
The average air temperature anomaly in the Southern Hemisphere this winter at 2 meters ranges from -0.3 to 0.1 degrees C ( relative to the 1979-2000 base). No warming of any kind. Antarctic temperature anomalies are negative.
It is really surprising with all this “global heating” “weird weather” going on that the Arctic sea ice is not continuing its “death spiral”.
Here is sea-ice volume from cryosat2:

lower line is October of each year, the nearest this dataset has to September minima.
The questions Nick and the other alarmed have to answer are simple.
(1) The phenomenon itself.
Do you believe the blocking ridge plus southwestern low were caused by the amount of warming of the global climate we have seen in the last 50 years?
If so, what is the mechanism that you think has caused this specific configuration of weather patterns? How exactly has a small rise in global temps caused it? How do you account for the existence of this pattern in previous periods?
(2) The scale of the phenomenon.
Do you believe that the cause of the high temps we are seeing recorded in the UK thanks to this phenomenon is the amount of warming of the global climate?
If so, by how much, in degrees C, do you think the global climate warming has raised them?
Here the difficulty you face is to show that we are not dealing with a standard weather phenomenon, just happening in an unusual way and producing a small peak in temperatures across a wide area of the UK.
It seems to me that, when discussing the UK weather, people have a quite false concept of it being very stable. it simply is not. The UK is on the edge of a vast ocean, under the jet stream, and to the north it has the Arctic and to the south the Sahara. The result is that weather systems blow in from the west all the time, in varying configurations. Sometimes they bring long spells of very cold temperatures. Sometimes they bring very long wet periods. Sometimes they bring heat up from the Sahara. And dust for that matter.
Nick and the others by implication are arguing that if we see many readings of 41 compared to previous less widespread readings of 39, then this cannot be simply caused by fluctuations in the above mechanism.
Fine, give some evidence to support your view. I don’t believe you can. I think summers with just such heat spells have occurred many times in the last 1,000 years., in periods where we don’t have observational records, but we do have anecdotal accounts. And slightly less hot ones have occurred several times a century, again in periods where we have written accounts. The default position has to be that this is unusual local weather, and nothing to do with global warming or global climate changes.
It is 100% unusual local weather and there is so much variety in it that 1000 years still may not include every possible scenario.
One good question for Nick and others below:-
When was the last time the air source come directly from North Africa in Summer and moved all the way to the UK northwards htting most of England and Wales?
1976.
There are quite frequent episodes of Saharan dust and sand being brought up to quite a lot of the UK by the lows coming in from the west. They aren’t always accompanied by very hot weather. This one has not brought sand, or not that I have heard. But sometimes you do get quite noticeable sand and dust.
Think about it. Lows come in from the west. There are also highs coming in from the north. There is the jet stream. Sometimes the highs are blocking and sometimes they form ridges. There is arctic cold and Saharan heat being brought in by these events.
Its just not a stable climate, and its idiotic to get excited about every little variation in it. They are inevitable. People have an entirely false idea that calm regular weather would be normal. It would not be, its simply impossible for a territory situated where this one is.
Saharan dust is relatively common in the UK often happening a few times a year when big dust storms in the Sahara coincide with southerly wind patterns.
Southerly wind patterns very rarely bring air up northwards direct from North Africa like it did on this occasion. These events are very rare indeed and I actually don’t know when this last happened. I have checked historic records back to 1906 and this didn’t occur with any of them during Summer.
Another geomagnetic storm and an increase in activity in the Atlantic.
Another low from the northwest is approaching the UK.
https://pl.sat24.com/pl/eu/infraPolair
The “hot” summer in the UK is over.
Temporarily. Warmer than average temps will come back according to the models. Those in the US from Texas up through the midwest will also get a break. While those in the NW US that have been having lower than normal temps will get a blast of warmer than normal temps. But that too will flip after 8-10 days.
Early teleconnections are indicating the continental US is in for a harsher winter than we have had in some time. Possibly one like the winter of 2013-14.
For my area – central Washington State — there is a very colorful map here: Pendleton, OR (weather.gov)
Click to enlarge.
This will not be as hot as June 2021. Still, it is uncomfortable.
I’ll have to check on the “harsher winter” to come. I may need more wood for the stove.
The decline in Arctic sea ice extent has stopped.
https://www.forecast.co.uk/pressure/
Take a look at the weather systems around the UK.
You can even animate it to see the highs and the low moving. This is how weather is on the edge of the Atlantic under the jet stream. Get used to it.
As solar activity increases, a zonal circulation will be activated and lows from the west will move more rapidly eastward.
https://i.ibb.co/QrMG27s/hgt300.webp
https://www.netweather.tv/charts-and-data/jetstream
But who has the loudest bullhorn?
Not passing peer review because the content is not up to standard, is not censoring. It is about maintaining high quality.
No it isn’t, or a good 90% of the published articles would never pass. It is completely about censorship and silencing dissenting views.
Peer review is a process that weeds out the…. well, weeds.
Here’s the thing… anyone can say AGW is crap(you see it countless times here a week), but then the sciency people with lots of letters behind their name say “that’s all very well, but you have to now say?” And that’s where AGW deniers fall over. They haven’t quite worked that bit out yet.
Anthony/Moderator – figure 1 needs checking/replacing:
Figure 1: Comparison of TV weather Maps from the BBC in summer 2012, left, and summer 2022 right. Source: BBC
There is duplicate text instead of the figure referenced?
(Thank you for the tip, have passed on this to the Admins) SUNMOD
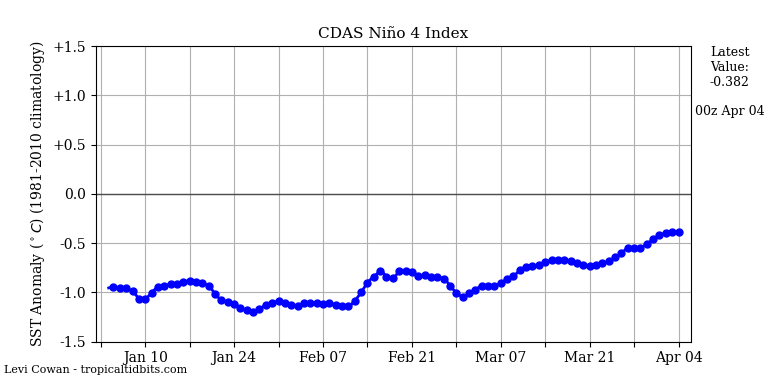
La Niña is back.
Weather IS climate when it helps the global warming cause, and it IS NOT climate when it doesn’t.
Hot Summer NOT caused by climate change/the science
https://www.marketforum.com/forum/topic/87422/
The Irish Met office declared a record breaker by 0.3 Deg C in the phoenix Park in Dublin, I call it utter Bollocks, it’s easy to falsify a 0.3 Deg record than 1 deg C.
The Irish Government are in bed with the WEF and UN and we’ve been bought and paid for and Our Government will do as they’re told.
Funny that next week starting 25th July the Irish Government have to declare a 30% reduction in Co2 emissions and low and behold Farming is one area being targeted, no way, just like the Netherlands ?
Yeah I drive an electric car but I do so because of the cost of Diesel here is a joke and EV is saving me a fortune, seriously, and after 8 months and 32,000 Kms there is no battery capacity loss nor was there in my BMW i3 2017 which was almost 5 years old when I sold it with over 90,000 Miles, the range was as good as new + I love how electrics drive and being able to pre heat and precool the interior prior to departure, so anyway I don’t drive EV because I’m trying to save the earth I drive EV because I love how they drive and how they save my wallet + I get a lot of free electricity in work, my fuel bills are around 10 Euro’s a week compared to around 120 a week with diesel.
Hopefully Google maps comes up with the location.
Coningsby
https://www.google.co.uk/maps/place/53%C2%B005'37.5%22N+0%C2%B010'04.1%22W/@53.09375,-0.1699934,391m/data=!3m2!1e3!4b1!4m14!1m7!3m6!1s0x4878725b3a3d293d:0xd0e85c36046c428a!2sConingsby,+UK!3b1!8m2!3d53.105091!4d-0.175141!3m5!1s0x0:0xf8d2dc1dc6a95b47!7e2!8m2!3d53.0937386!4d-0.1677906?hl=en-GB
Regarding the European heatwave and drought in 1540, as I recall the Rhine and the Seine ran dry. In Paris, people were walking down the bed of the Seine. Astonishing.