June 1st, 2022 by Roy W. Spencer, Ph. D.
The Version 6.0 global average lower tropospheric temperature (LT) anomaly for May, 2022 was +0.17 deg. C, down from the April, 2022 value of +0.26 deg. C.

The linear warming trend since January, 1979 still stands at +0.13 C/decade (+0.12 C/decade over the global-averaged oceans, and +0.18 C/decade over global-averaged land).
Various regional LT departures from the 30-year (1991-2020) average for the last 17 months are:
YEAR MO GLOBE NHEM. SHEM. TROPIC USA48 ARCTIC AUST
2021 01  0.12  0.34 -0.09 -0.08  0.36  0.50 -0.52
2021 02  0.20  0.31  0.08 -0.14 -0.66  0.07 -0.27
2021 03 -0.01  0.12 -0.14 -0.29  0.59 -0.78 -0.79
2021 04 -0.05  0.05 -0.15 -0.28 -0.02  0.02  0.29
2021 05  0.08  0.14  0.03  0.06 -0.41 -0.04  0.02
2021 06 -0.01  0.30 -0.32 -0.14  1.44  0.63 -0.76
2021 07  0.20  0.33  0.07  0.13  0.58  0.43  0.80
2021 08  0.17  0.26  0.08  0.07  0.32  0.83 -0.02
2021 09  0.25  0.18  0.33  0.09  0.67  0.02  0.37
2021 10  0.37  0.46  0.27  0.33  0.84  0.63  0.06
2021 11  0.08  0.11  0.06  0.14  0.50 -0.43 -0.29
2021 12  0.21  0.27  0.15  0.03  1.63  0.01 -0.06
2022 01  0.03  0.06  0.00 -0.24 -0.13  0.68  0.09
2022 02 -0.00  0.01 -0.02 -0.24 -0.05 -0.31 -0.50
2022 03  0.15  0.27  0.02 -0.08  0.22  0.74  0.02
2022 04  0.26  0.35  0.18 -0.04 -0.26  0.45  0.60
2022 05  0.17  0.24  0.10  0.01  0.59  0.22  0.19
The full UAH Global Temperature Report, along with the LT global gridpoint anomaly image for May, 2022 should be available within the next several days here.
The global and regional monthly anomalies for the various atmospheric layers we monitor should be available in the next few days at the following locations:
Lower Troposphere: http://vortex.nsstc.uah.edu/data/msu/v6.0/tlt/uahncdc_lt_6.0.txt
Mid-Troposphere: http://vortex.nsstc.uah.edu/data/msu/v6.0/tmt/uahncdc_mt_6.0.txt
Tropopause: http://vortex.nsstc.uah.edu/data/msu/v6.0/ttp/uahncdc_tp_6.0.txt
Lower Stratosphere: http://vortex.nsstc.uah.edu/data/msu/v6.0/tls/uahncdc_ls_6.0.txt
No sign of an emergency. Shurely shome mistake!
Not necessarily, solar activity went up a bit in May too, but still on track with one of the century ago
Yes, we have an increase in activity in May, but we are already seeing another decrease.
The solar wind ripples a lot.
Jupiter is moving away from Saturn, which will not increase solar activity.
https://www.theplanetstoday.com/
neat, but why did Saturn start radiating a few hours ago?
Cooling since Feb2016 or Feb 2020 – take your pick – even as atmospheric CO2 increases. The Global Warming (CAGW) narrative is proved false – again!. Told you so 20 years ago.
See electroverse.net for extreme-cold events and crop failures all over our blue planet.
Food shortages, fuel and food inflation, imminent famine, caused primarily by cold and wet weather and green energy nonsense.
The world has suffered from woke, imbecilic politicians. We need a few leaders with real science skills and real integrity, not the current crop of gullible green traitors and fools.
So basically the global average temperature anomaly was so small no human could detect it.
And so meaningless no one could detect it.
Of course people can detect it, thats why your house thermostat is settable to 1/100 ths of a degree! Duh.
Any chance to update the two temperature graphs off to the right? I’m really trying to see the USCRN graph, which is tough to find online. Anyone have a link to it?
Click on it, or go to https://wattsupwiththat.com/global-temperature/
Weird! Clicking the link leads to the UAH graph for March, but then clicking on the graph leads to a graph only page for February’s plot – from 2021!
https://www.ncdc.noaa.gov/temp-and-precip/national-temperature-index/time-series/anom-tavg/1/0
https://www.ncei.noaa.gov/access/monitoring/national-temperature-index/
Global cooling trend intact now for six years and three months, after peak of 2016 Super El Niño, which ended the Pause after 1998 SEN.
“The linear warming trend since January, 1979 still stands at +0.13 C/decade (+0.12 C/decade over the global-averaged oceans, and +0.18 C/decade over global-averaged land).”
**********
4.33 decades x .13 deg. Celsius/decade = 0.56 deg. C.
I seem to recall reading somewhere that the upside (warming side) of the Younger Dryas saw warming per decade that was much faster than this. So the alarmists will please excuse me if I don’t exactly go into panic mode here.
Disinformation bot says that’s disinformation.
Bots are one of the things Elon Musk is concerned about in his attempt to buy Twitter. His effort to purchase Twitter is on hold now because of the belief that there are considerably more bots on Twitter than its management is willing to admit to.
Using the Monckton method…
The pause period (<= 0 C/decade) is now at 92 months (7 years, 8 months).
The 2x warming period (>= 0.26 C/decade) is now at 184 months (15 years, 4 months).
The peak warming period (0.34 C/decade) is now at 137 months (11 years, 5 months).
And here is the latest global average temperature analysis comparing UAH with several widely available datasets
The unjustifiedly adjusted, poorly-cited, interpolated (ie, made up) surface station “data” sets are cooked book packs of lies.
UAH is adjusted and interpolated too; arguably more so than the other datasets.
Totally justifiably, to fix specific, known issues, not systematically to cool the past and heat the present. HadCRU’s Jones admitted heasting the land to keep pace with phony ocean warming. GISS’ UHI adjustments make the “data” warmer, not cooler. UAH doesn’t need to infill swaths 1200 km across with pretend “data”.
UAH infills up to 15 cells away. That is 15 * 2.5 * 111.3 km = 4174 km at the equator. They also infill temporally up to 2 days away. That’s something not even surface station datasets do. They also perform many of the same types of adjustments as the surface station datasets. They have a diurnal heating cycle adjustment which is similar in concept to the time-of-observation adjustment. They have to merge timeseries from different satellites similar in concept to homogenization. And the details of how they do these are arguably more invasive than anything the surface station datasets are doing. [Spencer & Christy 1992]
Why is it justified when UAH does it, but not justified when the others do it?
Surface temperature adjustments are applied to long past temperatures, sometimes many adjustments to the same data, and the trend in the adjustments is a large part of the supposed global trend. Any system is going to have to use some adjustments sometimes, but the bias in the surface temperature adjustments defies sanity.
There are so many problems with the ground based sensor network that only someone with absolutely no intention of honesty or integrity would ever use it.
The surface station project showed that over 80% of the sensors used in the US network were so poorly maintained that the data from them was worthless. No amount of mathematical gymnastics could rescue a signal from them.
In addition to local problems, most of the sensors were located in areas that had developed and built up resulting in UHI contamination.
There is the issue of undocumented changes in stations, both changes in instrumentation and location. Even when changes were documented, there was no period where the sensors operated side by side for a period of time, they were just swapped out.
Up until the 70’s, the sensors were analog sensors that were read by the human eyeball. These measurements, even when done properly, were only good to 1 degree.
Finally, the biggest problem with the ground based sensor network, is that it just way, way, way to sparse. Even today,only The US, southern Canada and Europe come anywhere close to be adequately monitored, that’s less than 5% of the Earth’s surface. Oceans are close enough to unmonitored, that the difference is minor.
The very idea that this network can be used to calculate the Earth’s temperature to within 0.01C is laughable. The notion that the we could use this network to do the same over 150 years ago is so ludicrous that only someone with no connection to reality could make such a claim.
MarkW said: “There are so many problems with the ground based sensor network that only someone with absolutely no intention of honesty or integrity would ever use it.”
And yet Anthony Watts himself said of the Berkeley Earth dataset that he was prepared to accept whatever result they produce even if it proves his premise wrong. For those that don’t know Berkeley Earth maintains a ground based observation dataset.
Anthony said that before BEST actually showed their work. His opinion now is quite a bit different.
Why am I not surprised that you chose the old quote and not the new one?
Could it be because you have no intention of telling the truth?
MarkW said: “Anthony said that before BEST actually showed their work. His opinion now is quite a bit different.”
That is interesting isn’t it. He was okay with the BEST method until he saw the result. It is doubly ironic in this discussion since BEST uses the scalpel method as a direct response to criticisms of adjustments.
MarkW said: “Why am I not surprised that you chose the old quote and not the new one?”
Pick that quote because to show that Anthony Watts has no problem using a ground based sensor network. Do you think that means he has no honesty or integrity?
BTW…he is also rebooting his surface station project as we speak. Do you think that too means he has no honesty or integrity?
It is the same for UAH. They have to adjust the entire satellite timeseries to get them aligned. Anyway, what is the bias in the surface temperature adjustments?
bdgwx –
We’ve been down this road several times before.
The biases in the satellite record can be measured and corrections applied as needed, sometimes to the entire record.
The biases in thousands of temperature sensors is impossible to quantify and yet corrections are applied willy-nilly to data several decades old without regard to what the accuracy of the readings were then compared to today.
The UAH data certainly has uncertainty, both in the actual measurements of radiance as well as in the calculation algorithms used to convert from radiance to temperature. Those uncertainties *should* be acknowledged, listed, and propagated through to the final results.
The surface data has the same issue.
Yet the purveyors of each stubbornly cling to the dogma that all error is random, symmetrical, and cancels out of the final results.
Stop trying to conflate measurable bias with unmeasurable bias. UAH adjustments result from measurable bias such as orbital decay, etc. This is not possible with the surface record. UAH is, therefore, the better metric to use. That said, I don’t think any of the data sets that are based on averages of averages of averages which are then used to calculate anomalies are worth the paper used to publish them.
Really? UAH measured all of the biases in the raw data? How exactly did UAH measure all of the biases in the raw data?
He didn’t say that, you did. This is a miss leading statement.
He said-
The biases in thousands of temperature sensors is impossible to quantify and yet corrections are applied willy-nilly
It’s hopeless, Tim, this guy refuses to be educated, he might as well be Dilbert’s pointy-haired boss. But don’t stop putting reality out there, others read it.
Educate me. How does UAH measure all of the biases in the raw data?
His goal is indoctrination, not education. Like most of the other warmunists.
So pointing out that UAH takes liberty to make adjustments that are arguably go above and beyond what surface station datasets are doing is indoctrination?
Yes! What *is* the bias in the surface temperature adjustments?
How can you adjust surface data from the 40’s based on calibration measured in 2000?
If you know the orbital measurements from the time the satellite was launched then you *can* adjust for any bias caused by orbital fluctuation. Similar measurements are not available for surface measurement devices.
TG said: “Yes! What *is* the bias in the surface temperature adjustments?”
That’s what I said!
TG said: “How can you adjust surface data from the 40’s based on calibration measured in 2000?”
The same way UAH selected only the 1982 overlap period of NOAA-6 and NOAA-7 as the basis for the diurnal heating cycle adjustment required for the satellite merging step.
TG said: “If you know the orbital measurements from the time the satellite was launched then you *can* adjust for any bias caused by orbital fluctuation.”
How do you think UAH does that?
BTW…Perhaps if you have time you can comment on taking the average of the two PRT readings from the hot target as an input into the radiometer calibration procedure. Why not just use one PRT since, according to you, uncertainty increases when averaging?
“That’s what I said!”
I know! The point is that you typically ignore that fact!
“The same way UAH selected only the 1982 overlap period of NOAA-6 and NOAA-7 as the basis for the diurnal heating cycle adjustment required for the satellite merging step.”
The overlap period can be measured and allowed for! How do you measure the calibration of surface measurements from 80 years ago? You are, once again, ignoring this fact by trying to say the measured overlap period of the satellites is the same thing as adjusting surface measurements from 80 years ago based on guesses and not measurements! The operative word here is “measured”. UAH can *measure* orbital variations, no one can “measure” the calibration of devices in the past!
“How do you think UAH does that?”
They *MEASURE* the orbits.
“BTW…Perhaps if you have time you can comment on taking the average of the two PRT readings from the hot target as an input into the radiometer calibration procedure. Why not just use one PRT since, according to you, uncertainty increases when averaging?”
We’ve covered this MULTIPLE times and yet you *never* seem to learn. Calibration of the sensor is *NOT* the same thing as the calibration of the measuring device. The ARGO floats are a prime example. The sensor in the ARGO floats can be calibrated to .001C – but the float uncertainty is +/- 0.5C!
It’s the same for the satellites. Calibrate the sensor and the measuring device however you want. That does *not* change the fact that a level of uncertainty remains when the satellite is pointed at the earth! It’s no different than using a micrometer to measure two different things. One can be a gauge block used for calibration and the next the journal on a crankshaft. Uncertainty remains in the amount of force the faces of the device apply to the measured things. If a different amount of force is applied to the gauge block than the crankshaft journal then the readings will have uncertainty that must be allowed for. It’s the same for the satellites. If there are invisible particles in the atmosphere affecting the radiance of the atmosphere at some snapshot point on the earth while there are none in a later snapshot at a different point then there *will* be uncertainty in the measurements taken.
No measurement taken in the real world is ever perfect. No measurement device is ever perfectly calibrated. That’s the entire purpose of using significant figures and uncertainty propagation in the real world.
TG said: “The overlap period can be measured and allowed for!”
So it’s okay to take a single overlap period of only two instruments measuring different locations apply that knowledge to all of the other (and completely different) time periods and other (and completely different) instruments? Is that what you’re saying?
TG said: “They *MEASURE* the orbits.”
It’s not just the orbit. How do they “MEASURE” the temperature bias caused by the change in orbit. How do they “MEASURE” the temperature bias caused by the limb effect? How do they “MEASURE” the temperature bias caused by spatially incomplete data? How do they “MEASURE” the temperature bias caused by temporally incomplete data? How do they “MEASURE” the temperature bias caused by the residual annual cycle of the hot target? How do they “MEASURE” the bias caused by the differing locations of instrument observations? Etc. Etc. Etc.
TG said: “We’ve covered this MULTIPLE times and yet you *never* seem to learn. Calibration of the sensor is *NOT* the same thing as the calibration of the measuring device.”
What does that have to do with anything? The question was…why not just use one PRT since, according to you, uncertainty increases when averaging?
I’ll even extend the question. Why do they average anything at all including but not limited to the two PRTs? Given your abject refusal to accept establish statistical facts and adherence to the erroneous belief that averages have more uncertainty than the individual elements they are based you’d think you would be just as vehemently opposed to UAH as you with any other dataset. Yet here here you are defending their methodological approach averaging and adjustments abound.
“So it’s okay to take a single overlap period of only two instruments measuring different locations “
Again, this can be measured. Adjustments to surface stations in the distant past cannot be measured, only guessed at.
The two are not the same!
” How do they “MEASURE” the temperature bias caused by the limb effect?”
They don’t measure TEMPERATURE! They measure radiance. The temperature calculated from those radiance measurements *do* have uncertainty just as the radiance measurements themselves have uncertainty. But you can MEASURE systematic bias in the satellites because they *exist* today. You can’t do that with surface data from 30, 40, 80 years ago!
I simply don’t understand why this is so hard for you to grasp. Have you bothered to go look up the work of Hubbard and Lin? It doesn’t sound like it. It just sounds like you are throwing crap against the wall hoping some of it will stick so you can use it to cast doubt on UAH.
“What does that have to do with anything? The question was…why not just use one PRT since, according to you, uncertainty increases when averaging?”
Once again you show you have absolutely no grasp of physical reality. Those PRT sensors exist in a measurement device. That device will *add* to the uncertainty of the measurement based on its design, maintenance, location, etc. Even the electronics associated with those PRT sensors have uncertainty associated with each and every part on the circuit board. That adds to the uncertainty of the measurement as well.
Even if you put multiple PRT sensors, each with its own measuring equipment, in the same box there is no guarantee you will get the same reading from each. The electronic equipment that reads the sensor and and stores the data can have different tolerances for each sensor. The uncertainties associated with each measurement device *will* add. That is why averaging only truly works for multiple measurements of the SAME THING using the SAME DEVICE. And even then you need to show that the same measurement device doesn’t have different systematic error on each measurement such as the measuring faces on a device wearing as material is passed across them.
The minute you separate those measurement devices physically into separate boxes the uncertainty gets worse because you are now measuring different things with different measurement devices.
“It is the same for UAH. They have to adjust the entire satellite timeseries to get them aligned.”
The UAH team must do a pretty good job of it because the UAH satellite data correlates with the Weather Balloon data.
TA said: “The UAH team must do a pretty good job of it because the UAH satellite data correlates with the Weather Balloon data.”
Does it?
[Christy et al. 2020]
UAH and Weather Balloons correlate:
https://www.researchgate.net/publication/323644914_Examination_of_space-based_bulk_atmospheric_temperatures_used_in_climate_research
TA said: “UAH and Weather Balloons correlate:
https://www.researchgate.net/publication/323644914_Examination_of_space-based_bulk_atmospheric_temperatures_used_in_climate_research“
So says Christy in that one publication using a procedure dependent on adjustments. I’ll just let Christy’s words speak for themselves.
And
They literally “adjust the radiosonde to match the satellite” in this publication.
Are you okay with this especially since you’ve mentioned your dissatisfaction with adjustments before?
And notice how the other publication, in which Christy is listed as the lead author” comes to a different conclusion.
They have to make up false UAH temperature data to fit the false climate agenda.
Correction — they have to make up false USHCN temperature data to fit the false climate agenda. UAH data is good stuff.
That is quite the indictment upon Dr. Spencer and Dr. Christy. Ya know…Dr. Christy has given testimony to congress on more than one occasion using his “false UAH temperature data”. I wonder what Anthony Watts and the rest of the WUWT editors and audience think about this?
UAH is good data, USHCN is falsified data. My “corrective” comment clarified that. Bottom line, there is no man-made climate change — just man-made climate alarmism — using junk science. CO2 is being demonized just like the Jews were.
So UAH and all of their adjustments is good, but USHCN using similar and arguably less invasive adjustments is falsified? What criteria are you using to make these classifications? I’d like to see if I can replicate your results if you don’t mind.
Here’s the data … https://www.ncei.noaa.gov/pub/data/ushcn/v2.5/
I know where the data is. I use it all of the time. I also know where the source code is (it is here). I didn’t ask where to find the data though. I asked what criteria you are using to classify UAH as good and USHCN as falsified even though UAH arguably uses more invasive adjustments than USHCN?
And it was only a few months ago that you told us “Altered data is no longer “data” — it is someone else’s “opinion” of reality.“ and “intellectual tyranny“ and “If you change reality (RAW data), you then create a false reality“ and “The “source” is the difference between the Raw and the Altered data. The “altered” data is in essence manufactured miss-information — not data.“
So I’d really like to know how UAH is so good even though by your criteria from a few months ago the data is tyrannical, opinion, false reality, misinformation, and/or not even data at all.
BTW…where is the UAH source code?
Why did Obama’s EPA hold a closed session to demonize CO2 through the Endangerment Finding?
JS said: “Why did Obama’s EPA hold a closed session to demonize CO2 through the Endangerment Finding?”
I have no idea. And its irrelevant because that has nothing to do with UAH’s methodology and adjustments.
I still want to know what criteria you are using to classify UAH is a good and USHCN as falsified. I’d also be interested in knowing why you were broadly and generally against adjustments only a few months ago and now consider them good at least in the context of what UAH did. What changed there?
Why is increasing CO2 increasing polar bears?
JS said: “Why is increasing CO2 increasing polar bears?”
I have no idea. And what does that have to do with the discussion? Is this a joke to you or something?
Why does increasing CO2 cause decreasing violent tornadoes?
JS said: “Why does increasing CO2 cause decreasing violent tornadoes?”
I’m trying to have a serious discussion here. If you’re not willing to provide explanations I have no choice but to think that you are deflecting and diverting attention away from the fact that espouse the goodness of UAH even though they use methods you earlier demonized. The best conclusion I can draw is that you prioritize the result over the method. Am I wrong?
The demonization of CO2 is the core problem — all else is a distraction. So … why is increasing CO2 reducing major hurricanes?
“So I’d really like to know how UAH is so good even though by your criteria from a few months ago the data is tyrannical, opinion, false reality, misinformation, and/or not even data at all.”
UAH adjustments are based on measured factors.
Surface data adjustments are based on biased guesses at the calibration error of measurement stations in the far distant past.
USHCN and UAH do *not* use similar adjustment processes.
How many times does this have to be pointed out to you before you internalize it?
UAH adjustments are *MEASURED* and applied consistently across the data set.
USHCN adjustment are pure guesses at the calibration bias of measurement stations in the distant past. Those guesses are purely subjective and typically cool the past – based on the biases of those making the guesses.
TG said: “USHCN and UAH do *not* use similar adjustment processes.”
Really? You don’t think UAH makes an adjustment for the time of observation of a location? You don’t UAH makes an adjustment to correct for the changepoints caused instrument changes?
Ya know what I think…I think you have no idea what UAH is doing and just giving your typical knee jerk “nuh-uh” responses. Prove me wrong.
TG said: “UAH adjustments are *MEASURED* and applied consistently across the data set.”
There it is again! Explain to everyone how UAH adjustments are “MEASURED”.
UAH *knows* when and where their satellite will be at any point in time by tracking the satellite orbit. We were doing that back in the 60’s with amateur radio satellites such as the OSCAR series of satellites.
Time of observation 80 years ago for a surface station simply can’t be measured, only guessed at. Unless you have a time machine *no* one can go back and measure calibration bias for a surface station or exactly when a temperature was measured.
Why are you so adamant about trying to say that adjustments to readings made 80 years ago by a surface station based on measurements made today are just as accurate as the adjustments made by UAH today? It sure sounds like you are just pushing a meme or an agenda rather than physical fact.
TG said: “UAH *knows* when and where their satellite will be at any point in time by tracking the satellite orbit.”
How does UAH “measure” the temperature bias (in units of C or K) caused by the changing orbital trajectory? That is the question. And the question extends to all of the other biases as well. How is the temperature bias measured exactly?
“I wonder what Anthony Watts and the rest of the WUWT editors and audience think about this?”
Well, if they are anything like me, they think this is a silly question.
TA said: “Well, if they are anything like me, they think this is a silly question.”
You think it is silly to ask how Anthony Watts feels about his site being used to promote and advocate for something many on here believe is fraudulent? Do you really think Anthony Watts would just say “meh” and move on?
Are you for real ? You wonder….really ?
Many have asked this same question.
The past is always cooler than we remember, and the future warmer than we expect. (Its a very scientifically objective process, as defined in the Klimate Koran.)
Because UAH gives the answer these guys want to see.
“Totally justifiably, to fix specific, known issues, not systematically to cool the past and heat the present”
Just a way of saying that UAH adjustments are good because we like the results. And the others are bad because we don’t.
Nick, your ability to read minds is as bad as your ability to explain the inexcusable.
Nick, you denigrate every person that read those devices and recorded those measurements when you modify them. You denigrate every person that built the station and maintained it. You are saying that the readings were done incorrectly because you have identified something wrong with them from a time more than a century after they were made.
You can’t say the readings were correct but “weren’t right”. That is entirely illogical. If they are correct, then they are correct. If a “break” occurs, then previous records still remain correct, but the new ones are different. The appropriate action is to discard one or the other. You can’t correct “correct” data. You are simply making up new information to replace existing data.
You have never provided a scientific field where previous measured data has been replaced with new information by using some scheme to identify both a “break” and what the new information should be. Why don’t you identify one?
If you don’t believe data is correct you destroy any trust in it by replacing it with new information. Isn’t it funny how all corrections go in one direction. As a mathematician you need to tell us how likely that would be for so many to come out that way!
“You are saying that the readings were done incorrectly”
Nobody is saying that. Adjustments are made for homogeneity – putting different readings on the same basis, as when a station moves, for example.
Never understood the rationale for changing temp data because a stationed moved. Temp stations measure the micro climate of a precise location. If you move the station then you have stopped measuring the micro climate of one location and now measuring the microclimate of a new location. Then size of a microclimate changes dramatically with distance, where I live it is 2 degrees cooler than a 5minute drive down the road.
Simonsays said: “Never understood the rationale for changing temp data because a stationed moved.”
When you move a station you change what it is measuring. For example, if a station is 200m elevation and you move it to a nearby location at 100m then you have introduced a nearly +1 C changepoint in the timeseries assuming the station is in a typical dry adiabatic environment. If that changepoint is not corrected then it creates a significant warm bias on the trend. UAH has a similar, but vastly more complicated issue regarding the drift and decay of the satellite orbits. The locations they are measuring are changing.
There is a similar issue for instrument package changes as well. UAH is not immune from this either. In fact, they a very complex adjustment procedure for dealing with this. In fact, the UAH adjustments in this regard are so complex that it requires correcting for biases in their bias corrections. But it has to be done otherwise the commissioning/decomissioning of satellites through the years introduce significant changepoints in the underlying data that UAH processes.
The question is we all know that we change the the temperature of the measurement yet you claim of + 1 C is only a guess. That may work most of the time yet I know I can find places that will not be true. Take the move of the Detroit Lakes Minnesota station you moved it from a swamp tree covered moist area to a high and dry prairie the differences are going to be more than altitude. In fact the variables will make any comparison or correction only a WAG without a running both for several years and than comparing the data. Of course that was not done. All the correction in the world will not give you a real number only a guess and a bad guess at that.
mal said: “The question is we all know that we change the the temperature of the measurement yet you claim of + 1 C is only a guess.”
It is an example. Nothing more. Do you understand the concept and the problem?
mal said: “Take the move of the Detroit Lakes Minnesota station you moved it from a swamp tree covered moist area to a high and dry prairie the differences are going to be more than altitude.”
Maybe and maybe not. It depends. Some datasets, like GISTEMP, use pairwise homogenization to identify and correct non-climatic changepoints. Some datasets, like BEST, treat the changepoints as the commissioning of a new station timeseries avoiding the adjustment altogther.
mal said: “All the correction in the world will not give you a real number only a guess and a bad guess at that.”
That’s not what the evidence says [Hausfather et al. 2016]. But if you are convinced of it then why not forward your grievance to Anthony Watts and the WUWT editors regarding their promotion of a dataset that takes great liberty in employing adjustments?
“Maybe and maybe not. It depends. Some datasets, like GISTEMP, use pairwise homogenization to identify and correct non-climatic changepoints.”
Pairwise homogenization is a joke from the start to the finish. A difference as small as 20 miles can make a 1C or more difference in readings because of microclimate changes. And not just because of elevation. Terrain and land use makes a *huge* difference as well in things like humidity, wind, etc. The east side of a moderate hill can have vastly different temps than the west side of a hill even if both are at the same elevation. Creation of an impoundment, even a large beaver pond, between two stations can cause a change in temperature readings in a specific measurement location. Why should this be considered a candidate for “homogenization” when it is actually measuring the change in the microclimate correctly?
TG said: “Pairwise homogenization is a joke from the start to the finish.”
Not according to the abundance of evidence available.
I’ll say this over and over if I have to. “Nuh-uh” arguments like what you often employ are not convincing in the same it is not convincing when someone simply “nuh-uhs” the 1LOT, general relatively, the standard model, or the SB law.
Don’t be a “nuh-uh”er. If you have new evidence to add then present it. Start by quantifying how different from reality a trend calculated from PHA corrected data is vs. an alternative method you feel is better. That’s how can you be convincing. That’s how you’ll get peoples attention.
If you can’t or won’t do this then pesky skeptics like me have choice but to dismiss your “nuh-uh” arguments.
Look at the attached. This is a small area of northeast Kansas. Look at the variation within small, small microclimates. There are several degrees if temperature difference.
How does ANY homogenization let alone with averaging retain the deviations shown here. The variance involved is huge. Averaging and homogenization remove (hide) the original variance making temperatures look more accurate with less variation than there actually is.
That is why people say GAT has several degrees of uncertainty. Nobody ever shows how variance is retained through mathematical manipulation.
When combining samples, means can be combined directly, in other words just making one set of numbers. Variances however are additive. Why is this never addressed?
“Not according to the abundance of evidence available.”
The proof was in Hubbard and Lin’s work around 2002. Their conclusion was that adjustments *had* to be done on a station-by-station basis in order to have any kind of validity at all. All those “homogenization” so-called scientists simply ignore their work and think that they can use other stations to infill or correct others.
Microclimate differences as small as the type of surface below the measuring stations, e.g. bermuda vs fescue or sand vs clay, can cause differences in the readings of calibrated measurement stations even in close proximity
Homogenization is nothing more than a guess with an unidentified uncertainty!
That is a perfect example of a station record that should be stopped and a new one started.
You need to ask why the existence of such a predilection of creating a “long” record is necessary.
There is a statistical reason and the folks insisting on doing it should tell you what it is!
Combining the old data with the new is fraudulent, don’t you get it?
CM said: “Combining the old data with the new is fraudulent, don’t you get it?”
I don’t get it. But it sounds like you are convinced of it. Perhaps you can direct your grievance to Anthony Watts and the WUWT editors who allow Dr. Spencer and Dr. Christy’s dataset, which you believe is fraudulent since they combine old and new data as part of their adjustment procedures, to be published and advocated for on a monthly basis.
Request DENIED.
Those adjustments are based on MEASURED factors, not a subjective, biased guesses!
TG said: “Those adjustments are based on MEASURED factors, not a subjective, biased guesses!”
And there it is again! How exactly are all of the adjustments made by UAH “MEASURED” and are not subjective?
radar, directional antennas, visible crossing points in the sky, telescopes, optical distance measuring devices such as lasers.
Jeesh, amateur radio operators have been tracking their communication satellites since the early 60’s, and doing so pretty darn accurately. The orbits of those first satellites had to be known accurately in order for low power radio equipment and highly directional antennas to communicate through them. A little off on time overhead or on azimuth and you had a missed pass.
Tracking equipment is far, far advanced over what we had in the 60’s and 70’s.
Stick to your math, dubious as some of it is, because you don’t seem to know much about the physical world,
How do radar, directional antennas, telescopes, optical distance measuring devices, and amateur radio operators measure the temperature bias caused by orbital drift and decay? Where can I find these measurements in units of K or C?
“ If that changepoint is not corrected then it creates a significant warm bias on the trend.”
Which is why each data set should stand on its own. Stop one and start another. Since you do *not* know the calibration status of the old measurement station over time you simply cannot change the old data by 1C and expect any kind of accuracy at all!
TG said: “Which is why each data set should stand on its own. Stop one and start another.”
That’s not how UAH does it.
However, it is how BEST does it.
Maybe Anthony Watts, Monckton, and WUWT editors should start preferring BEST over UAH?
How do YOU know which the people you list prefer?
UAH *is* one long radiance measurement data base. The issues with the satellites are *measurable* and can, therefore, be adjusted for across the record. The calibration bias of thermometers 80 years ago simply can’t be measured today therefore adjustments to those readings are biased guesses.
Not only biased, but in the end, they are declaring them wrong even though Nick Stokes has already declared they weren’t incorrect. I don’t get the logic of “correcting” correct data. Ultimately, there is only one reason, and that is to make the data look like you want it to look.
There is no rational on that, the proper way to do that is to maintain both sites for a period of time and note the differences, that was not done. So now you only have guesses and there is now way to prove or disprove the guess.
Add in the human race change the the old Stevenson Screen to white wash to latex paint we have no data on how that change the measurements since that was not tested.
Yet again we have no knowledge on how the impact of changing from Stevenson Screen to the new electronic measuring system since no tests were done and when it was done the difference were dismissed because the result was not what the experts wanted to hear.
No we cannot take the surface measurements as fact because the variables were never controlled and all the adjustments(guess) will not fix that problem. No one can honest say the land temperature record is accurate within plus or minus 3C for any given time period. Let alone with a hundred of a degree.
So again I will make this statement and prove me wrong(you can’t) The climate is always changing, the present question remains how much and which way. No one can “prove: how much and which way, all are guessing. My guess it going up how much and why God only knows, mankind does not have a clue. Prove me wrong.
mal said: “No one can honest say the land temperature record is accurate within plus or minus 3C for any given time period. Let alone with a hundred of a degree.”
Rhode et al. 2013 and Lenssen et al. 2019 say it is about ±0.05 C for the modern era. Even Frank 2010 who uses questionable methodology thinks it could be as low as ±0.46 C.
But if you truly think ±3 C is the limit of our ability then how do you eliminate 6 C worth of warming since 1979 for a rate of 1.4 C/decade?
As usual you are confusing SENSOR uncertainty with measurement station uncertainty!
They are *NOT* the same thing. It’s why the ARGO float sensor can be calibrated to .001C but the float uncertainty is +/- 0.5C!
Your lack of understanding about the real world is showing!
TG said: “As usual you are confusing SENSOR uncertainty with measurement station uncertainty!”
No. I’m not. On the contrary it is you who continually confuses location and time specific uncertainty with the global average temperature uncertainty. I’ll repeat this as many times as needed. The combined uncertainty is not the same thing as the uncertainty of the individual elements being combined. It is a different value. You’re own preferred source says so.
dr. adjustor weighs in on uncertainty, again, and does a face plant, again.
They don’t even realize they are acting like stock day traders who only use apps to track stock prices. Day traders are hoping to tell what a stock is going to do using exactly the same methods, price vs time. The problem is, 99% of them never dig into the underlying company fundamentals information to know why a company’s worth goes up or down. By the time a stocks price goes up or down, they are already behind the eight ball and must try to catch up. Other traders who do the basic research have already beaten them to the punch.
The problem with climate science’s obsession with temperature trends is that they will never know what the fundamentals are. Any predictions are fraught with builtin error. Just look at the range of model predictions to see what I mean.
How many times do you want me to show you this graph? Time is not a factor in it, just CO2 and ENSO.
Will you ever ask Monckton why he doesn’t try to analyze his claim of a pause? Why he only considers time as a factor and ignores ENSO?
More dodging and weaving, you know the answer to this question but refuse to acknowledge it.
Somehow you have time on the x-axis and a temperature anomaly on the y-axis. I don’t see where CO2 has a temperature anomaly associated with it so I not sure what (CO2 + ENSO) actually means. It looks like a time series to me rather than a functional relationship between the two variables. You need to show the equation you used to derive the temperature anomaly from the time.
I’ve tried to explain this before. I’ve calculated a multivariant linear regression on the data. The dependent variable is the UAH anomaly, the independent variables are CO2 and ENSO (with some adjustments for lag and smoothing CO2). The red line is simply the prediction for each month based on those two variables.
By definition, the linear equations are a functional relationship. As I said, time is not a factor in the predictions, though it makes little difference as CO2 is close to a linear rise with respect to time.
Should also mention, that the linear regression is based on the data up to the start of the “pause” showing in green. This allows the pause to be the test data.
“There is no rational on that, the proper way to do that is to maintain both sites for a period of time and note the differences, that was not done.”
That really doesn’t help much in correcting past data because you simply can’t identify what the calibration status of the original location was in the past. Most stations have drift which means the calibration changes over time. Identifying the present error because of drift doesn’t identify the past error because of drift. Thus applying present error correction to past temperatures readings just isn’t very “scientific”.
In fact it is fraudulent.
One of the other components of drift in land surface stations is land use changes and flora growth. Wind breaks can grow and affect wind velocities at a station over time. Buildings and asphalt not even close can affect temperature. Grass changes both underneath the station and surrounding areas can affect measured temperatures. These are all things that can cause microclimate changes at the station and appear as drift but are not because of “thermometer” calibration.
You nailed it. No one can *prove* you wrong.
A station move should be treated by stopping the old record and starting a new one. Trying to create a “long record” from two different microclimates by creating new information is very unscientific. If the data is unfit for purpose, discard it.
Homogenization done by creating new information just creates additional bias. Why does homogenization end up cooling temps in almost all cases. Tell us what the chances of that occuring is and why. Why not both cooling and heating in equal portions?
I am still waiting on you to answer my question!
“You have never provided a scientific field where previous measured data has been replaced with new information by using some scheme to identify both a “break” and what the new information should be. Why don’t you identify one?”
JG said: “A station move should be treated by stopping the old record and starting a new one.”
That’s what BEST does.
JG said: “Trying to create a “long record” from two different microclimates by creating new information is very unscientific.”
UAH does this.
JG said: “Homogenization done by creating new information just creates additional bias.”
UAH does this.
JG said: “Why does homogenization end up cooling temps in almost all cases.”
It is true that for the US it increases the warming trend relative to the raw data. This is primarily because the time-of-observation change bias is negative and the instrument/shelter change bias is negative.
However, on a global scale the net effect of adjustments is to reduce the overall warming trend.
“UAH does this.”
No, it doesn’t.
TG said: “No, it doesn’t.”
I’m going to call your bluff here. I don’t think you have any idea what UAH is doing. Explain to everyone how UAH does the limb correction, diurnal heating cycle correction, deep convection removal, linear diurnal drift correction, non-linear diurnal drift correction, removal of residual annual cycle related to hot target variations, orbital decay correction, removal of dependence on time variations of hot target temperature, deconvolution of the TLT layer, spatial infilling, temporal infilling, etc. See if you can do so without invoking the creation of new data or the combining of timeseries representing different microclimates and being correct in your explanations.
Are you really this dense? Or is this all part of an act?
As I keep telling you — THESE ARE ALL MEASURED! They are not guesses (meaning UNMEASURED) at the calibration of a measuring device 80 years ago based on current calibration.
Take orbital fluctuations. THEY CAN BE MEASURED AND THEY APPLY TO *ALL* OF THE DATA.
You keep trying to justify changes to past surface temperature measurements based on nothing but biased guesses. It’s indefensible. You only look like a fool in trying to defend the practice.
TG said: “As I keep telling you — THESE ARE ALL MEASURED!”
You keep saying it, but saying it over and over does not make it right. You also keep deflecting and diverting away from explain HOW all of their bias corrections are measured. Why is that?
TG said: “Take orbital fluctuations. THEY CAN BE MEASURED AND THEY APPLY TO *ALL* OF THE DATA.”
How do they “measure” the temperature bias caused by orbital drift and decay?
TG said: “You keep trying to justify changes to past surface temperature measurements based on nothing but biased guesses.”
I’m not talking about surface temperature measurements. I’m talking about UAH adjustments. Those adjustments change past measurements.
Because ALL of the necessary information is recorded along with the microwave data.
Is this really so hard for you?
CM said: “Because ALL of the necessary information is recorded along with the microwave data.”
Where in the raw MSU data is the temperature bias recorded? Can you post a link to it so that I can review it? How come Spencer and Christy do not mention it in any of their methods papers?
CM said: “Is this really so hard for you?”
Yes. I’ve searched extensively. I don’t see it anywhere. Spencer and Christy don’t seem to be aware of it either.
Do you understand what is being measured? Do you think the satellites have devices that read physically remote temperature sensors?
Here is a paper that reviews some of the issues with using spectral irradiance to calculate temperatures.
Atmospheric Soundings | Issues in the Integration of Research and Operational Satellite Systems for Climate Research: Part I. Science and Design |The National Academies Press
Wikipedia has a succinct definition of UAH measurements.
WTH is “temperature bias”?
CM said: “WTH is “temperature bias”?”
The error of the temperature measurement. Where is that included in the raw MSU data?
You still don’t understand that uncertainty =/= error, yet you go around lecturing on the subject.
CM said: “You still don’t understand that uncertainty =/= error, yet you go around lecturing on the subject.”
Nobody is talking about uncertainty here.
The claim is that UAH “measures” all of the temperature biases that exist. You said all of the necessary information in the context of the temperature biases is included along with the microwave data.
My question is where is it included? I don’t see it. Dr. Spencer and Dr. Christy do not see it.
If you can’t or won’t form a response directly related to your claim that all information is included along with the microwave data and/or the temperature bias itself then I have no choice but to dismiss your claim.
I’m going to be blunt here. I don’t think you have the slightest idea how UAH is producing their published products. Prove me wrong.
Once again, you are in no position to place demands on other people.
“The claim is that UAH “measures” all of the temperature biases that exist.”
Stop making things up. *NO* one claims this.
They claim that orbital factors can be measured.
And the satellites do *not* measure temperature, they measure radiance. And the measure of that radiance *certainly* has uncertainty because of many external factors as well as internal factors.
And this doesn’t even include the uncertainties in the conversion algorithm changing radiance to temperature.
And you’ve been told *many* times that the uncertainties of the UAH are less than any of the surface temperature measurements. For one thing there are just a limited number of satellites compared to the thousands of temperature measuring devices. For independent, random variables the uncertainty grows with an increased number of measurement devices (just like the variance of independent, random variables add).
For some reason you just can’t seem to accept any of this. You are pushing an agenda – trying to denigrate the usefulness of UAH compared to the surface temp data and the climate models. If you think that isn’t becoming more and more obvious with each of your posts then you are only fooling yourself!
TG said: “Stop making things up. *NO* one claims this.”
UAH publishes temperature products. I’m told that all of the biases they correct for are “measured”. Examples of the statements are here, here, and here.
TG said: “And the satellites do *not* measure temperature, they measure radiance.”
We are not discussing how the temperatures are measured. We are discussing how the biases are measured.
The way in which the temperatures are measured is a big topic as well and worthy of discussion. It’s just not what is being discussed at the moment.
Direct measurement of errors is quite impossible because true values are unknowable.
Like you keep trying to tell them – error is not uncertainty. They never seem to be able to internalize that! It’s probably because they’ve never been in a situation where their personal liability is at issue if they don’t account for uncertainty properly.
Each and every statistics textbook publisher today should be sued for never including uncertainty of data elements in their teaching examples. Even if they ignore the uncertainty intervals in working out the examples they would have to explicitly state that and the students would at least get an inkling about the effects of uncertainty.
They still haven’t gotten past the terminology section of the GUM that explains this quite clearly.
If bdgwx is following his usual tack, he is hoping to get some kind of answer for his “measurement bias” demand that he can then turn around and use as a weapon in his Stump the Professor game.
Then those biases (systematic errors) cannot possibly be included with the microwave data.
Your clown show is quite threadbare.
Why not? Are you saying the MSU’s can’t be calibrated?
No. I didn’t say that.
“ I’m told that all of the biases they correct for are “measured”.”
All the biases you MENTIONED *are* measured. They mostly had to do with orbital fluctuations. Those can be measured down the the width of a laser beam!
“We are not discussing how the temperatures are measured. We are discussing how the biases are measured.”
*We are not discussing how the temperatures are measured. We are discussing how the biases are measured.
YOU* were talking about the satellites measuring temperature. They don’t.
And you’ve been told multiple times about the uncertainties associated with UAH by several people on here. You just conveniently forget them all the time and claim we think UAH is 100% accurate!
TG said: “All the biases you MENTIONED *are* measured. They mostly had to do with orbital fluctuations.”
I mentioned a lot of biases in this thread. Orbital fluctuations are one among many. But if you want to focus on just that for now that’s fine. How does UAH “measure” the temperature bias or systematic error caused by orbital fluctuations? Be specific.
TG said: “YOU* were talking about the satellites measuring temperature. They don’t.”
I’m talking about how UAH applies adjustments; not how the temperature is measured. That is a different topic.
TG said: “And you’ve been told multiple times about the uncertainties associated with UAH by several people on here. You just conveniently forget them all the time and claim we think UAH is 100% accurate!”
Uncertainty has nothing to do with this. That is a different topic.
Stay focused. How does UAH “measure” the temperature bias or systematic error?
Why do you expect and insist that Tim know this?
Go ask Spencer, its his calculation.
I don’t need to ask Spencer. He and Christy published a textual description of the procedure they used to identify and quantify the bias adjustments.
Then WTH are you demanding I tell you?
Fool.
“The error of the temperature measurement. Where is that included in the raw MSU data?”
The MSU (Microwave Sounding Unit) doesn’t measure temperature. It measures radiance. That radiance is then converted to temperature using an algorithm that has many inputs.
A true uncertainty analysis of all elements would be quite instructive, and that includes the uncertainty of the measuring device as well as the uncertainty of the algorithm.
TG said: “The MSU (Microwave Sounding Unit) doesn’t measure temperature. It measures radiance. That radiance is then converted to temperature using an algorithm that has many inputs.”
So the temperature bias or systematic error is not included in the raw MSU data stream?
TG said: “A true uncertainty analysis of all elements would be quite instructive, and that includes the uncertainty of the measuring device as well as the uncertainty of the algorithm.”
We are not talking about uncertainty. We are talking about the temperature bias or systematic error of the measuring device and algorithm that aggregates all of the measurements.
You and Carlo Monte keep telling me that this temperature bias or systematic error is measured. I want to know how you think it is measured. Where do I find these measurements?
NO!
All the information needed is already known, there is no need to make up fake data, as is your wont.
I’ll give you a dose of bellcurveman: “Go talk to Spencer and ask him”.
CM said: “All the information needed is already known, there is no need to make up fake data, as is your wont.”
Where does it exist? Where can I find it? How come Dr. Spencer and Dr. Christy make no mention of it?
There are papers on the satellites used. I have read several but didn’t save them. If you search the internet you can find papers discussing the MSU’s and other sensors on the satellites.
I have a lot of them downloaded going all the way back to the NIMBUS prototype that preceding the operational TIROS-N and successors.
Well pin a bright shiny star on your lapel.
Adjustments are made for homogeneity. That is where the fiddles enter. If the data is not already homogeneous they should be discarded and not incorporated into the history.
Data are never homogeneous. Look at the attached. The differences in temperature are large over a very small area. Like it or not, microclimates are not the same at any distance. Adjusting temperature data to achieve homogeneous temperature averages is a farce. It is done in order to manufacture long temperature records at individual stations.
That is not a scientific treatment of recorded, measurement data.
If you discard all of the data then how do you eliminate the possibility that the planet warmed by say 5.5 C as opposed to the 0.55 ± 0.21 C since 1979 like what UAH says?
Don’t you get it yet? There is no single temperature of “the planet”?
If the uncertainty of the data is greater than the differential trying to be identified then it is impossible to determine the differential.
The planet could have warmed or cooled by 5.5C and you simply can’t tell if the uncertainty is 6C. If the uncertainty is 1C then how do you determine a differential of .55C?
Your uncertainty of 0.21C is LESS than the uncertainty of the global measuring devices! You are, as usual, either
Neither of these is true in the real world.
“You can’t correct “correct” data. You are simply making up new information to replace existing data.”
Exactly. Alarmist want us to think they know exactly how to adjust past temperatures.
Alarmists want us to accept their manipulation of the temperature record as legitimate.
We don’t need a new temperature record. The old one does much better. The old one says we have nothing to worry about from CO2. The old one was recorded when there was no bias about CO2 warming.
Alarmists don’t want us to know this so they bastardized the past temperature records in order to scare people into doing what the Alarmists want them to do: Destroy our nations and societies by demonizing CO2 to the point that oil and gas are banned.
All because of a bogus, bastardized temperature record. The only “evidence” the alarmists have to back up their claims of unprecedented warming, and their evidence is a Lie, they made up out of whole cloth.
Notice all the alarmists jumping in to defend these temperature record lies. They *have* to defend them because it’s the only thing they have to promote their scary CO2 scenarios. Without the bastardized temperature record, the alarmist would have nothing to show and nothing to talk about.
Keep telling us how you know better what the temperature was in 1936, than the guy that wrote the temperature down at that time. The bastardized temperature record is a bad joke. And these jokers want us to accept it. No way! Go lie to someone else.
Most UAH adjustments are based on MEASURED bias such as orbital fluctuations.
This is simply not possible with surface data collected by thousands of temperature sensors, be they land or ocean.
Thus the UAH record is consistent while the surface data is not. UAH adjustments don’t cool the past and heat the present by changing past data, decades old, based on current measurement of accuracy.
It isn’t a matter of like/dislike. It is a matter of consistency.
TG said: “Most UAH adjustments are based on MEASURED bias such as orbital fluctuations.”
There it is again. How exactly do you think UAH “MEASURED” the biases they analyzed?
TG said: “UAH adjustments don’t cool the past and heat the present by changing past data, decades old, based on current measurement of accuracy.”
Oh yes they do. They also make adjustments to future data using past measurements in more than one way.
TG said: “It is a matter of consistency.”
0.307 C/decade worth of adjustments from version to version over the years isn’t what I would describe as consistency. But what do I know. I still accept that averaging reduces uncertainty, the 1LOT is fundamental and unassailable, and that the Stefan-Boltzmann Law is more than just a mere suggestion that only works if the body is equilibrium with its surroundings.
“There it is again. How exactly do you think UAH “MEASURED” the biases they analyzed?”
Highly directional antenna. Telescopes. Time differences between observation points. Radar.
LOTS OF WAYS TO MEASURE!
“Oh yes they do. They also make adjustments to future data using past measurements in more than one way.”
BUT THESE ARE *MEASURED* biases! Not guesses about calibration of devices 80 years ago!
“0.307 C/decade worth of adjustments from version to version over the years isn’t what I would describe as consistency.”
The biases are *MEASURED* and applied consistently to the data.
“ I still accept that averaging reduces uncertainty,”
Averaging does *NOT* reduce uncertainty unless you can show that all of the error is random and symmetrical. Which you simply cannot show for surface temperature measurements which consist of multiple measurements of different things using different devices. You cannot show that the all of the errors from all those measurements of different things using different devices form a random, symmetrical distribution where they all cancel out.
“ if the body is equilibrium with its surroundings”
You can’t even get this one correct. It has to also be in equilibrium internally – no conduction or convection internally. No equilibrium – wrong answer from S-B!
TG said: “Highly directional antenna. Telescopes. Time differences between observation points. Radar.”
UAH uses directional antenna, telescopes, and radar?
TG said: “BUT THESE ARE *MEASURED* biases!”
How?
TG said: “Averaging does *NOT* reduce uncertainty unless you can show that all of the error is random and symmetrical.”
Well now this is a welcome change of position. It was but a couple of months ago you were still telling Bellman and I that the uncertainty of an average is more than the uncertainty of the individual elements upon which is based.
TG said: “You can’t even get this one correct. It has to also be in equilibrium internally – no conduction or convection internally. No equilibrium – wrong answer from S-B!”
Wow. Just wow!
You might as well extend your rejection to Planck’s Law as well since the Stefan-Boltzmann Law is derived from it. Obviously you’re probably wanting to apply your rejection to the radiant heat transfer equation q = ε σ (Th4 – Tc4) Ah since it is derived from the SB law which in turn is going to force you to reject the 1LOT and probably 2LOT as well. Actually, the more I think about it your rejection here so thorough I’m not sure I’m going to be able to convince you that any thermodynamic law is real. And if I can’t do that then how can anyone possibly convince you of anything related to physics?
“UAH uses directional antenna, telescopes, and radar?”
Once again your lack of understanding of the physical world is just simply dismaying! The TRACKING stations use those to measure orbital information!
“How?”
Do you *truly* need a dissertation on how radar works? Or a laser distance measuring device? At it’s base, satellite tracking just uses triangulation and basic trigonometry, Do you need a class on navigating and trig?
“Well now this is a welcome change of position. It was but a couple of months ago you were still telling Bellman and I that the uncertainty of an average is more than the uncertainty of the individual elements upon which is based.”
No, that is *NOT* what I told you. I told you that the uncertainty of the mean of a sample *has* to have the uncertainty of the elements in the sample propagated to the mean of the sample. You cannot just assume the mean of the sample is 100% accurate with no uncertainty.
If the individual elements can be shown to have only random error and that it is symmetrically distributed then it can be assumed that the errors cancel. You simply cannot show that the uncertainty in the measurement of different things using different devices result in an error distribution that is random and symmetrical just as an assumption!
You and bellman keep wanting to assume the standard deviation of the sample means is the uncertainty of the mean calculated from those sample means. That is wrong unless you can show that the uncertainties form a random and symmetrical distribution.
If
Then you simply can’t say the uncertainty of the average (M1 + M2 +…. +Mn)/N is the standard deviation of M1 through Mn. Doing so requires ignoring the uncertainties such as +/- 1.0, +/- 1.5, etc.
That *is* what you, Bellman, and all the climate scientists want to do – ignore uncertainty because it is inconvenient to have to propagate it and consider it in your analysis of the data.
So you just assume it all cancels no matter what!
Planck’s Law is the same. It assumes a object in equilibrium. I don’t know why that is so hard for you to understand. Any heat that is being conducted within an object is not available for radiation. It can’t do both conduction and radiation at the same time.
from http://www.tec-science.com:
“The Stefan-Boltzmann law states that the intensity of the blackbody radiation in thermal equilibrium is proportional to the fourth power of the temperature! ” (bolding mine, tg)
Perhaps this will help you understand – if an object is not at thermal equilibrium then how do you know its actual temperature? It could be cooler on part of its surface and warmer on another. What temperature do you use in the S-B calculation?
TG said: “The TRACKING stations use those to measure orbital information!”
I’m not asking how UAH knows the orbital trajectories. That’s easy. I’m asking how you think UAH measures the temperature bias caused by orbital drift and decay.
TG said: “Any heat that is being conducted within an object is not available for radiation. It can’t do both conduction and radiation at the same time.”
Excuse me? Are you telling me that I can’t get radiation burns from fire because it is conducting heat to its surroundings? Are you telling me that I can’t feel the radiant heat from a space heater because it is conducting heat internally and externally to the air surrounding it?
TG said: “Perhaps this will help you understand”
No it doesn’t. I know what the SB law says. That does not help me understand your position that the SB law is invalid unless the body is in thermal equilibrium with its surroundings. That was your statement. And it evolved from your original statement that water below the surface does not radiate according to the SB law. It is also important to note that the SB law already has a provision for bodies that are not true blackbodies via the emissivity coefficient. Your source only examines the idealized case where emissivity is 1. Bodies do not have to be in thermal equilibrium with their surroundings or even within for them to radiate toward their surrounds according to the SB law. This is the whole principal behind the operation of thermopiles and radiometers. Anything and everything with a temperature emits radiation that delivers energy in accordance with the SB law to the thermopile or radiometer. You just have to set the emissivity correctly to get a realistic temperature reading. My Fluke 62 forces me to set the emissivity coefficient of what I’m measuring. And it is rarely in thermal equilibrium with the target regardless of whether that target is a parcel of water below the surface, looking up into a clear or cloudy sky, into a flame, etc and yet it still works.
BTW…here is the radiant heat transfer equation for grey bodies.
Q = σ(Th^4 – Tc^4) / [(1-εh)/Ah*εh + 1/Ah*Fhc + (1-εc)/Ac*εc] where h is the hot body, c is the cold body, T is temperature, A is area, ε is emissivity, and Fhc is the view factor from hot to cold which is derived from the 1LOT and the SB law. What would the point be if it only worked when h and c where in thermal equilibrium?
I’ll repeat. Anything and everything emits radiation. It doesn’t matter where it is. This includes parcels of water below the surface regardless of whether the parcel is in thermal equilibrium with its surroundings or not. It will emit radiation all of the time. And we use this fact in combination with the 1LOT and SB law to determine the temperature of the parcel. That’s why my Fluke 62 records the correct temperature of water even when dunked below the surface.
“I’m asking how you think UAH measures the temperature bias caused by orbital drift and decay.”
What difference does it make as long as it is consistent? Again, as I’ve told you multiple times, the satellites don’t measure temperature, they measure radiance. They then convert that into a temperature. As long as they do the conversion in a consistent manner on all of the data then the metric they determine is as useful as any surface measurement data and probably more useful because their coverage of the earth is better!
” Are you telling me that I can’t get radiation burns from fire because it is conducting heat to its surroundings? “
NO! That is *NOT* what I said. What I said is that any heat the fire is conducting into the ground is not available for radiation! That heat can’t radiate while it is being conducted into the ground! S-B won’t give you the right answer because it requires thermal equilibrium of the object. If there is conduction going on within the object then it is not at thermal equilibrium! It’s the exact same thing for the space heater. Heat that is being conducted internally or externally is not also available for radiation. S-B will give you the wrong answer.
Why is this so hard for you to understand?
“That does not help me understand your position that the SB law is invalid unless the body is in thermal equilibrium with its surroundings.”
Because conducted heat is not available for radiation. Again, why is this so hard to understand?
“emissivity coefficient.”
Which has nothing at all to do with the difference between conducted heat and radiated heat. Nice try at the argumentative fallacy of Equivocation.
“Your source only examines the idealized case where emissivity is 1”
Again, the difference between conducted heat and radiated heat has nothing to do with emissivity. Emissivity is a measure of the efficiency of radiation, it is not a measure of conductivity.
“Bodies do not have to be in thermal equilibrium with their surroundings or even within for them to radiate toward their surrounds according to the SB law.”
They do *NOT* have to be in thermal equilibrium in order to radiate. They *DO* have to be in thermal equilibrium in order to radiate according to the S-B equation. Conducted heat, be it internal or external, is not available for radiation. The S-B equation assumes that *all* the heat in a body is available for radiation — meaning it is in thermal equilibrium.
” You just have to set the emissivity correctly to get a realistic temperature reading. My Fluke 62 forces me to set the emissivity coefficient of what I’m measuring.”
Again, emissivity is a measure of radiative efficiency. It has nothing to do with the total heat in an object, part of which is radiated and part of which is being conducted.
“Q = σ(Th^4 – Tc^4) / [(1-εh)/Ah*εh + 1/Ah*Fhc + (1-εc)/Ac*εc]”
Where is the factor for the amount of heat being conducted away and is thus not available for radiation?
Your equation has an implicit assumption of thermal equilibrium and your blinders simply won’t let you see that!
As usual, it is an indication of your lack of knowledge of the real world! To use your space heater analogy, the amount of heat being conducted away from the space heater to the floor via conduction through its feet is *NOT* available for radiation via the heating coils. Thus S-B will *not* give a proper value for radiated heat based on the input of heat (via electricity from the wall) to the heater. If the coils are not in thermal equilibrium because one end of the coil is hotter than the other end because of conductivity then the total radiation from the coil can’t be properly calculated because S-B has no factor for conductivity.
“Anything and everything emits radiation. It doesn’t matter where it is. This includes parcels of water below the surface regardless of whether the parcel is in thermal equilibrium with its surroundings or not. “
Your first two sentences are true. Your third one is not. Conductive heat is not available for radiation and therefore S-B can’t give you a proper value for the amount of radiation from an object.
You proved this with your own equation. It has no factor for conductive heat.
Take off your blinders, open your eyes and stop trying to tell everyone that blue is really green!
TG said: “What difference does it make as long as it is consistent?”
You said it was MEASURED. I want to know how you think it was MEASURED.
TG said: “They do *NOT* have to be in thermal equilibrium in order to radiate.”
Exactly. Yet that is what Jim Steele was vehemently rejecting for water below the surface. He doesn’t think it radiates at all which you then started defending perhaps because you jumped into the conservation late and were unaware of context. I don’t know.
TG said: “They *DO* have to be in thermal equilibrium in order to radiate according to the S-B equation.”
That is for the body itself. This discussion is not analyzing bodies that are not in thermal equilibrium themselves. This discussion is analyzing two bodies. A parcel of water at temperature Th and its surroundings at temperature Tc. Both bodies will radiate toward each other according to the SB law with an emissivity of ~0.95 or so. This happens even though there is no equilibrium between the parcel and surroundings.
BTW…bodies that are not in thermal equilibrium will have a rectification error whose magnitude is related to the spatial variability of its radiant exitance or temperature. It is an important consideration especially for the 3 layer energy budget models in which the layers are not themselves in thermal equilibrium. We just aren’t discussing non-homogenous emitters right now.
TG said: “Where is the factor for the amount of heat being conducted away and is thus not available for radiation?”
No where. That means conduction does not directly effect the radiant exitance of a body. It only does so indirectly via its modulation of T. This is why conduction and radiation happen simultaneously. For two bodies H and C at temperatures Th and Tc heat will transfer via conduction (if they are in contact) and radiation simultaneously. A radiant space heater (body H) is both conducting and radiating heat to the surroundings (body C). A parcel of water (body H) is both conducting and radiating heat to the surroundings (body C).
TG said: “Your equation has an implicit assumption of thermal equilibrium and your blinders simply won’t let you see that!”
On the contrary it has an implicit assumption that there is no thermal equilibrium. In other words Th != Tc. If there were a requirement that Th = Tc then what would the point of it be since it would just reduce to q = 0. The whole point of heat transfer is for bodies that are not in thermal equilibrium.
“You said it was MEASURED. I want to know how you think it was MEASURED.”
Nice job of equivocation! IT *IS* MEASURED. You questioned how it is applied to the data, not the value of the measurement. And apparently you know nothing of the use of lasers in determining distance and direction let alone radar!
“Exactly. Yet that is what Jim Steele was vehemently rejecting for water below the surface. He doesn’t think it radiates at all which you then started defending perhaps because you jumped into the conservation late and were unaware of context. I don’t know.”
What Steele was saying is that radiation plays almost NO part in the heating of the water below the surface! In fact it is probably not even measurable because the heat transport will be so totally dominated by the conduction factor! If it’s not measurable then does it exist?
You are trying to argue how many angels can stand on the head of a pin!
“That is for the body itself. This discussion is not analyzing bodies that are not in thermal equilibrium themselves.”
You are moving the goalposts! Thermal equilibrium *is* a requirement for giving the proper answer from S-B. *YOU* are the one that brought up S-B and said it will give the proper answer even for objects not in thermal equilibrium.
Are you now changing you assertion?
“This discussion is analyzing two bodies. A parcel of water at temperature Th and its surroundings at temperature Tc. Both bodies will radiate toward each other according to the SB law with an emissivity of ~0.95 or so. This happens even though there is no equilibrium between the parcel and surroundings.”
And now we change back! If those two bodies are in physical contact, e.g. two parcels of water next to each other in the ocean, then conduction will dominate over radiation for thermal heat propagation. S-B will *NOT* give the correct answer.
I assume that you will now move the goalposts again and say you are discussing two parcels of water that are not in physical contact, e.g. two separate globules of water in a vacuum, righ?
“That means conduction does not directly effect the radiant exitance of a body. It only does so indirectly via its modulation of T”
Huh? An object can be hotter on the surface than on the interior thus having internal conduction. Planck and S-B both assume that all the heat in a body is available for radiation, i.e. thermal equilibrium. Heat in conduction is *NOT* available for radiation!
“For two bodies H and C at temperatures Th and Tc heat will transfer via conduction (if they are in contact) and radiation simultaneously.”
But conduction will dominate! It’s why every thermo textbook I have ignores radiation of heat through a wall media and only considers conduction of heat.
“A radiant space heater (body H) is both conducting and radiating heat to the surroundings”
But not *all* of the heat being input into the heater will be radiated! The heat being conducted away from the heating element will *NOT* be available for radiation.
TG said: “Nice job of equivocation! IT *IS* MEASURED.”
How? Be specific.
TG said: “What Steele was saying is that radiation plays almost NO part in the heating of the water below the surface!”
It goes way beyond that. He does not think water below the surface even emits radiation at all. He also do not think a body of water can warm when energy is delivered to it via infrared radiation at all. In fact, it even appears that he thinks when you increase the energy input to the body of water via infrared radiation the body of water will cool!
TG said: “You are moving the goalposts! Thermal equilibrium *is* a requirement for giving the proper answer from S-B. *YOU* are the one that brought up S-B and said it will give the proper answer even for objects not in thermal equilibrium.”
Patently False. Thermal equilibrium between a object (body #1) and its surroundings (body #2) is NOT a requirement for the SB law.
TG said: “And now we change back! If those two bodies are in physical contact, e.g. two parcels of water next to each other in the ocean, then conduction will dominate over radiation for thermal heat propagation. S-B will *NOT* give the correct answer.”
Just because conduction dominates does not mean that a body does not also radiate in accordance with the SB law. Remember, Jim Steele thinks water below the surface does not radiate at all. I’m pointing out that no only does it radiate, but you calculate how much it radiates via the SB law.
TG said: “I assume that you will now move the goalposts again and say you are discussing two parcels of water that are not in physical contact, e.g. two separate globules of water in a vacuum, righ?”
Nope. My goalposts are in the exact same spot they’ve always been. 1) A body of water will warm if it is delivered energy via infrared radiation. 2) A parcel of water below the surface (body #1) will radiate toward its surroundings (body #2) and you can determine the radiant exitance or temperature of body #1 via the SB law just like you can use the SB law for any other situation.
TG said: “Huh? An object can be hotter on the surface than on the interior thus having internal conduction.”
Nobody is saying otherwise. We are not analyzing the inside of the object here. We are analyzing how that object’s surface (the body in consideration) transfers heat to another object through its surface (the other body). It does so via conduction if it is in physical contact with the other body and by radiation simultaneously. When energy is transferred the hot surface will cool and the cold surface will warm. This then causes the rate at which both conduction and radiation occur to reduce as well. As the two surfaces get closer and closer to equilibrium both conduction and radiation slow down eventually to the point where no heat is being transferred anymore via either mechanism. What happens beneath those bodies (the interiors) is of no concern right now.
TG said: “But conduction will dominate!”
That’s what I said. I even did the calculation. I even tried to explain that conduction is the primary mechanism in play modulating the heat flux across the interface between the bulk and TSL of the ocean surface.
TG said: “But not *all* of the heat being input into the heater will be radiated!”
Nobody is saying otherwise. What is being said is that it radiates. And you can calculate either the radiant exitance or temperature of the emitting surface via the SB law.
TG said: “The heat being conducted away from the heating element will *NOT* be available for radiation.”
Nobody is saying otherwise. What is being said is that it radiates. And you can calculate either the radiant exitance or temperature of the emitting surface via the SB law.
There is a very easy answer to your questions. The GHG theory postulates that CO2 creates additional water vapor. What does that mean? It means that H2O absorbs energy from CO2 radiation and vaporizes. When it vaporizes it takes heat from the liquid and cools the liquid.
So, the question is:
Does CO2 radiation create vaporization of the H2O in the oceans.
If yes, then CO2 cools the ocean and does not heat it.
If no, then CO2 heats the ocean and does not create additional water vapor.
The answer is up to you – GHG theory is right or it is incorrect. What is it?
Lastly, S-B is an equation that predicts irradiance for a moment in time. The next moment in time, the body will have cooled and the irradiance will be less. Moment to moment. This sounds like an integral is needed to describe the gradient for a cooling body.
Think about it, the sun is a constant supply of heat (ignoring its effect upon a rotating earth). Therefore the surface of the earth reaches a constant temperature while the sun is shining. That is equilibrium. It also radiates a given amount because it is at equilibrium. This is the only assumption you can make if you are not going to use integrals to describe the gradients that occur.
“Patently False. Thermal equilibrium between a object (body #1) and its surroundings (body #2) is NOT a requirement for the SB law.”
You are using an implicit assumption that the two bodies are not in physical contact but are not stating that assumption hoping to fool us! In other words you are assuming no conduction heat transport! Any heat being conducted away from the object is not available for radiation! It’s the same for internal conduction within the object.
“Just because conduction dominates does not mean that a body does not also radiate in accordance with the SB law.”
How can S-B give the right answer when part of the heat in the object is not available for radiation?
Stop trying to fool us! You are wrong and you know it. I can see your fingers crossed behind your back. You are assuming no conductive heat transport but don’t want to actually state the assumption!
“ We are not analyzing the inside of the object here.”
Of course we are! You are now trying to set up arbitrary conditions! If the object is not in thermal equilibrium then you *must* consider the heat being conducted inside the object!
“Nobody is saying otherwise. What is being said is that it radiates. And you can calculate either the radiant exitance or temperature of the emitting surface via the SB law.”
*You* are saying otherwise. If part of the heat at the surface is being conducted into the interior then S-B won’t give the right answer. Again, S-B has *NO* factor for conductance. It assumes the object is in thermal equilibrium, i.e. no internal conducting of heat, all heat is available for radiation!
TG said: “You are using an implicit assumption that the two bodies are not in physical contact but are not stating that assumption hoping to fool us!”
There is no assumption either way. It doesn’t matter if they are in physical contact or separated by a vacuum. A surface on that object will always radiate in accordance with the SB law. It’s why radiometers and thermopiles work even though they aren’t in thermal equilibrium with the body they are targeting (the surface of the object).
TG said: “How can S-B give the right answer when part of the heat in the object is not available for radiation?”
Because the SB law only relates radiant exitance to temperature. Temperature is the one and only variable that modulates radiant exitance and vice versa. Nothing else does. That is a fact taken straight from the SB law itself.
TG said: “You are assuming no conductive heat transport but don’t want to actually state the assumption!”
I’m not making any assumptions about conduction either way. It doesn’t matter. If the body has a temperature T it will radiate per εσT^4 regardless of the magnitude of conduction.
TG said: “If part of the heat at the surface is being conducted into the interior then S-B won’t give the right answer”
Yes. It will. It makes no difference how the body (the surface of the object) is evolving. As long as it has a temperature T it will radiate at εσT^4 W/m2 all the same.
From THE THEORY OF HEAT RADIATION by Max Planck . Page 69
Please note: This is a requirement for proving the Stephan Equation as shown on Page 74 with equation (78).
“We are not analyzing the inside of the object here. We are analyzing how that object’s surface (the body in consideration) transfers heat to another object through its surface (the other body).”
I need to clear up a misconception here and it has significance about the homogeneity of a body and from where radiation is emitted. You can see from this, it is required that a body be at a single temperature throughout.
Again, from THE THEORY OF HEAT RADIATION by Max Planck . Page 6
“It is true that for the sake of brevity we frequently
speak of the surface of a body as radiating heat to the surroundings, but this form of expression does not imply that the surface actually emits heat rays. Strictly speaking, the surface of a body never emits
rays, but rather it allows part of the rays coming from the interior to pass through. The other part is reflected inward and according as the fraction transmitted is larger or smaller the surface seems to emit more or less intense radiations.”
bwx knows more about radiation theory than Max Planck!
Planck was far smarter than I’ll ever be. Did he ever say that water below the surface does not emit radiation? Did he ever say that the SB law can only be used for bodies in equilibrium with their surroundings?
Did you read the quote?
No you didn’t.
Yes. I did. Notice that Planck never said that a body must be in equilibrium with its surroundings to be able to use the SB law. Notice that Planck never said that water below the surface does not radiate.
I standby what I’ve been saying all along. Water below the surface emits radiation in accordance with the SB law regardless of whether an underwater parcel is in equilibrium with its surroundings or not. And I’ll say it over and over again as many times as is needed. A body does not need to be in equilibrium with its surroundings for the SB law to be applied in the analysis of the radiant exitance ‘j’ or temperature ‘T’ of that body. In fact, the SB is most useful when that body is not in equilibrium with its surroundings because you can use it (in combination with the 1LOT) to determine the heat transfer via εσ(Ta^4 – Tb^4) where Ta is the temperature of the body A (eg. a parcel of water) and Tb is the temperature of body B (eg. the surroundings).
Jim Steele in recent article does not think water below the surface emits radiation. Tim Gorman defends that school of thought and extends the rejection to the erroneous requirement that the SB law only works on bodies that are equilibrium with their surroundings.
You also believe averaging reduces uncertainty, which it cannot.
CM said: “You also believe averaging reduces uncertainty, which it cannot.”
Let me be perfectly clear. I accept that the uncertainty of the average is less than the uncertainty of the individual elements upon which the average is based. Your own preferred source (the GUM) says so.
BTW you can use the procedure in the GUM to calculate the uncertainty of the radiant exitance from the SB law given the uncertainty of the temperature. For example if the temperature is 288 ± 1 K then the radiant exitance is 390 ± 5.4 W/m2. The NIST uncertainty machine gives the same answer FWIW.
Oh yeah, you are clear, you believe nonsense. Perfect credentials for a climate $cientologist. At least you were not going to be Frank.
If you don’t assume equilibrium then you MUST deal with S-B on an integral basis so there is a gradient. CONSTANT RADIATION REQUIRES CONSTANT TEMPERATURE. In other words equilibrium. There is no other alternative. You’ve never taken thermodynamics have you? It is why you need calculus as a prerequisite. Gradients are a fact of life.
JG said: “If you don’t assume equilibrium then you MUST deal with S-B on an integral basis so there is a gradient.”
Say what?
Show me. There are two bodies. Body A is at temperature Ta = 300 K and body B is at temperature Tb = 280 K. Body B is the surroundings of body A such that body A is not in equilibrium with body B or Ta != Tb. Compute the radiant exitance Ja and Jb of bodies A and B. Use an integral if you want.
Bonus points if you calculate the net radiant heat flux between A and B.
I don’t need your extra points. If Body A is at Ta = 300 K, what is Ta right after radiating? After two radiation, orr three? How does a body cool? If it is not at equilibrium with an external heat source, as in Planck’s thesis, it WILL cool on a continuous basis. As “t” goes to zero you end up with δTa. In other words a gradient requiring an integral.
The only other option is for Body A to be equilibrium with a CONSTANT temperature and radiation.
JG said: “If Body A is at Ta = 300 K, what is Ta right after radiating?”
That depends on the specific heat capacity and whether it is in stead-state (Ein = Eout). But that is irrelevant since no one is asking how Ta is evolving. The only thing being considered is body A’s radiant exitance Ja at temperature Ta and the net heat flux between a second body with radiant exitance Jb and temperature Tb.. If Ta changes then the radiant exitance Ja also changes. But it always has a radiant exitance Ja equal to εσTa^4 regardless of what Ta is or how it is evolving.
JG said: “The only other option is for Body A to be equilibrium with a CONSTANT temperature and radiation.”
If you mean equilibrium with its surroundings then NO. There is no requirement that the body be in equilibrium with its surroundings. This is the case we are discussing.
If you mean equilibrium with itself then YES. The body must be represented by a single radiant exitance value J and temperature T. We are not discussing the case though; at least not yet.
The challenge by Jim Steele is that if that body is a parcel of water below the surface it won’t emit radiation at all. That then got expanded to a challenge that the SB law does not work for bodies that are not in equilibrium with their surroundings which is patently false. The SB law does not require bodies to be in equilibrium with their surroundings. The only thing required is that the body be at radiant exitance J and temperature T.
BTW #1…even if the body is not at temperature T, but instead is a non-homogenous emitter with variability in both temperature and radiant exitance you can still use the SB law as long as you analyze the body by subdividing it into sufficiently small sub-bodies such that the sub-bodies can be represented by a single temperature T. You can then integrate the SB law for the sub-bodies in the spatial domain just as you might in the temporal domain. Either way you can always use the SB law. You just have to use it correctly.
BTW #2…These integrations of the SB law are actually really fun exercises especially for spherical shapes because it really forces you to think about how geometries and varying radiant exitances impact how you apply the SB law. I did a calculation for Earth a few years back under the assumption that the radiant exitance matched the solar irradiance which varies spatially and temporally. I’ll see if I can dig that up if I have time.
bdgwx said: “I did a calculation for Earth a few years back under the assumption that the radiant exitance matched the solar irradiance which varies spatially and temporally. I’ll see if I can dig that up if I have time.”
I couldn’t find it, but I did take the liberty to do a similar calculation for the Moon. The assumption is that the radiant exitance always matches the solar irradiance with no lag or ability to store heat.
Function ‘s’ is the Stefan-Boltzmann Law outputting a temperature in K.
Function ‘f’ is the integration of the SB law down the latitudes outputting the average temperature in K. dθ represents latitudinal rings of constant radiant exitance J that we can use in the SB law. The fully derived version of this function actually contains 2πr^2 and 1/2πr^2 terms for the area of the rings that cancel so I’ve left them out for brevity. You can do the full area weighting or you can use the relative weighting dθ weightings like what I did. Either way works.
The x-axis is the TSI for the body.
The y-axis is the spatially averaged temperature of the body assuming the radiant exitance equals the solar irradiance at each every point on the surface.
The red plot is the black-body temperature for a flat surface with constant radiant exitance spatially.
The blue plot is the black-body temperature projected onto a sphere with varying radiant exitance spatially.
The black plot is the hypothetical no-lag and no-heating black-body temperature for TSI = 1360 W/m2 and albedo a = 0.11 which are the parameters for the Moon. Notice that for the Moon this comes out to 153 K. Compare this with the Diviner observed value of 200 K. The difference is partly due to the lunar regolith and the fact that the lunar radiant exitance does not match solar irradiance for many reasons.
Anyway, the point is to demonstrate that the SB law can still be used to analyze a body not in thermal equilibrium itself. You just have to sub-divide the body into sub-bodies that are in thermal equilibrium. And remember these plots are idealizations. The real Moon is a far more complex environment. Don’t infer anything from this that isn’t being suggested.
What did I say?
Let me point out that your integral is not the only one needed. As the sun passes over any giving point longitude, there is a sine function based on time describing the energy being absorbed.
You do realize since the sun “moves” due to the moon’s rotation, there is no equilibrium, ever. Everything is in motion. Things go up and things go down. There is a maximum and minimum. A simple algebraic equation just won’t describe anything but a very, very, very brief interval of time.
Yep. The real Moon is far more complex environment. My example is but a simple idealization of a hypothetical Moon-like body in which the radiant exitance matches the solar irradiance. In that idealization the double integral ∫ ∫ dθ dt evaluates to the same as the single integral ∫ dθ due to the constant spatial symmetry wrt to time. If the hypothetical Moon-like body had an asymmetric geometry you’d have to do the double integral even under this rigid hypothetical idealization. A true analysis of the radiative behavior of the real Moon needs to a full spatial and temporal integration like what Williams et al. 2017 do. Again, I’m only demonstrating how the SB law can be applied to bodies that aren’t themselves in thermal equilibrium. Don’t read anymore into this other than that.
“Again, I’m only demonstrating how the SB law can be applied to bodies that aren’t themselves in thermal equilibrium. Don’t read anymore into this other than that.”
If you don’t know which part of the object is in thermal equilibrium then how do you split it into parts? Even Planck admitted his theory doesn’t work at the quantum level so you can’t split it down that far!
“If you mean equilibrium with itself then YES. “
You keep on telling me this isn’t the case. You keep saying S-B will give the right answer even if the object is not in internal equilibrium!
Which is it?
“The SB law does not require bodies to be in equilibrium with their surroundings.”
That depends on whether the bodies are in physical contact. If they are then you will have conductive heat transfer and S-B *still* won’t give the correct answer because conductive heat isn’t available for radiation!
Your statements are only true for isolated bodies in a vacuum!
“The challenge by Jim Steele is that if that body is a parcel of water below the surface it won’t emit radiation at all.”
You keep saying this and it just isn’t true. When conductive heat transfer is the major factor of heat transfer then radiation becomes so small that it is negligible. Does anyone include the gravitational impact of the black hole at the center of the galaxy when calculating a satellite orbit around the earth? Or is it so small that it is negligible? It’s impact is certainly there but its like arguing how many angels will fit on the head of a pin to consider its impact.
And that is what you are doing now. Arguing about how many angels will fit on the head of a pin.
TG said: “You keep on telling me this isn’t the case. You keep saying S-B will give the right answer even if the object is not in internal equilibrium!”
No. I keep telling you that the SB law will give the right answer even if the object is not in equilibrium with its surroundings.
TG said: “That depends on whether the bodies are in physical contact.”
No. It does not depend on whether they are in physical contact with their surroundings. The SB law works regardless of whether bodies are in physical contact or not.
TG said: “Your statements are only true for isolated bodies in a vacuum!”
No. The SB law is not limited to isolated bodies in a vacuum. It works for all bodies regardless of whether they are in a vacuum or not.
bdgwx said: “The challenge by Jim Steele is that if that body is a parcel of water below the surface it won’t emit radiation at all.”
TG said: “You keep saying this and it just isn’t true.”
That is absolutely true. It is the whole reason I explained how to do the experiment in your own home proving it. He still rejected this fact…vehemently.
TG said: “And that is what you are doing now. Arguing about how many angels will fit on the head of a pin.”
It goes way beyond that. This discussion got started because Jim Steele does not think water below the surface radiates in accordance with the SB law or even at all. This goes to the core of a massive misunderstanding of how bodies radiate energy.
“No. I keep telling you that the SB law will give the right answer even if the object is not in equilibrium with its surroundings.”
You just admitted this isn’t true! You said hat you might have to split an object not in thermal equilibrium into parcels that are!
“No. It does not depend on whether they are in physical contact with their surroundings. The SB law works regardless of whether bodies are in physical contact or not.”
You are dissembling! Did you think I wouldn’t notice? If S-B gives the right answer then why the need to split an object into parcels that *are* in thermal equilibrium?
You’ve got your fingers crossed behind your back. I can see!
“No. The SB law is not limited to isolated bodies in a vacuum. It works for all bodies regardless of whether they are in a vacuum or not.”
Then, again, why the need to split the objects into parcels?
“This goes to the core of a massive misunderstanding of how bodies radiate energy.”
Which you have to keep fudging on! S-B assumes the entire body is in thermal equilibrium and all heat is available for radiation. That’s why you had to admit that you might have to break a body into parcels. Of course you’ve never demonstrated a process for doing that!
And yet you stubbornly cling to the assertion that S-B will give a correct value for radiation from an object not in thermal equilibrium.
TG said: “You just admitted this isn’t true! You said hat you might have to split an object not in thermal equilibrium into parcels that are!”
I made no such admission. I have been saying over and over again and consistently that the SB law works regardless of whether the body is in equilibrium with its surroundings… SURROUNDINGS. The surroundings is not the same thing as the body itself. For example, a doctor can scan my forehead with an IR thermopile (which uses the SB law) to take my temperature even though the surroundings (the air and everything around me) is at a different temperature.
TG said: “Then, again, why the need to split the objects into parcels?”
The only requirement of the SB is right there in the equation. The body itself must be described with a radiant exitance J and temperature T. In other words the body itself must be in thermal equilibrium otherwise it cannot be described by J and T. Do not conflate the state of thermal equilibrium of the body with the body being in thermal equilibrium with its surroundings; two completely different things.
If the body itself has spatial variance of J or T then there is no single J or T by which the body can be described. That will cause a bias or error in the result of the SB law. Trenberth et al. 2009 calls this a rectification error. If the spatial variance of J or T is small the rectification error is small and negligible. But when the spatial variance of J and T is large the rectification error is large and must be handled by sub-dividing the body until “without appreciable error, be regarded as a state of thermal equilibrium”. The reason why scientists must split a non-homogenously emitting (spatial variance in J or T) object is so that the SB law can be applied with minimal error and then the results integrated to provide a complete picture of the original object.
TG said: “Of course you’ve never demonstrated a process for doing that!”
I gave an example above.
TG said: “And yet you stubbornly cling to the assertion that S-B will give a correct value for radiation from an object not in thermal equilibrium.”
Strawman. I never asserted that the SB law will give a correct value for radiation from an object not in thermal equilibrium. What I asserted is that the SB law will give a correct value for radiation from an object not in thermal equilibrium with its surroundings. Burn that into brain…with its surroundings. And I standby that assertion. It is the whole reason why my IR gun (and everybody else’s) can measure the temperature of a body based on its radiant exitance even though that body is not in thermal equilibrium with its surroundings or the instrument. It’s the reason why IR gun (and everybody else’s) can measure the temperature from water below the surface based on its radiant exitance even though the water is below the surface and even though it may be at a different temperature than its surroundings.
“I made no such admission. “
Then why did you say you would have to split the object into parcels?
You can run but you can’t hide!
“In other words the body itself must be in thermal equilibrium otherwise it cannot be described by J and T.”
Then why would you need to split the object into parcels?
You can lay on all the word salad you want, it won’t help!
“The reason why scientists must split a non-homogenously emitting (spatial variance in J or T) object is so that the SB law can be applied with minimal error and then the results integrated to provide a complete picture of the original object.”
In other words the object has to be in thermal equilibrium in order for S-B to give the correct answer!
Something you denied!
Again, you can run but you can’t hide!
TG said: “Then why did you say you would have to split the object into parcels?”
That is for the case when you are analyzing a body that cannot be regarded as being a state of thermal equilibrium with itself without appreciable error.
Do not conflate thermal equilibrium with itself with thermal equilibrium with its surroundings. Those are two concepts.
TG said: “Then why would you need to split the object into parcels?”
You need to split the object into parcels if the object is not sufficiently in thermal equilibrium with itself such that there is appreciable error.
Again…do not conflate thermal equilibrium with itself with thermal equilibrium with its surroundings. Those are two concepts.
TG said: “In other words the object has to be in thermal equilibrium in order for S-B to give the correct answer!”
Yep. But that doesn’t mean it has to be in thermal equilibrium with its surroundings.
Again…do not conflate thermal equilibrium with itself with thermal equilibrium with its surroundings. Those are two concepts.
TG said: “Something you denied!”
Nope. I have said over and over again consistently that the SB law works for a body even though that body may not be in thermal equilibrium with its surroundings.
Again…do not conflate thermal equilibrium with itself with thermal equilibrium with its surroundings. Those are two concepts.
Based on your comments here I still don’t think you fully understand what thermal equilibrium with itself and thermal equilibrium with its surroundings means. Would it be helpful if we discussed more regarding what those mean and why they are different concepts?
“That is for the case when you are analyzing a body that cannot be regarded as being a state of thermal equilibrium with itself without appreciable error.”
But you said there would be no error. That S-B would give the correct answer for an object that is not in internal equilibrium.
It’s good to see you finally admit that your assertion was wrong!
“Do not conflate thermal equilibrium with itself with thermal equilibrium with its surroundings. Those are two concepts.”
I never did. I told you there was no conduction factor in S-B and that it, therefore, could not give a correct answer when conduction, either internal or external, was at play. You kept telling me that S-B *would* give a correct answer.
“Yep. But that doesn’t mean it has to be in thermal equilibrium with its surroundings.”
As I told you, that *only* applies if the object is not in physical contact with the surroundings and conduction of heat is in play. You, once again, told me that was wrong. But S-B *still* doesn’t have a conduction factor and if the object is either conducting heat internally or is conducting heat externally then that heat is not available for radiation and S-B will give an incorrect answer.
You keep trying to foist off assertions while hiding the implicit assumptions behind the assertion. Why don’t you show us how the conducted heat to another body can also be radiated? Show us how S-B will give the right answer.
Or is your answer going to be, once again, that you would have to split the object into parcels?
“Nope. I have said over and over again consistently that the SB law works for a body even though that body may not be in thermal equilibrium with its surroundings.”
But you ALSO said that SB works for an object that was not in internal equilibrium! You also said that SB would work for an object in physical contact with another body where conducted heat was being transferred!
You are still trying to dodge the factor that you forgot that SB doesn’t have a conduction factor!
Just so it is clear I’m challenging your statements “If the particle is not in thermal equilibrium with the surrounding material S-B will give a wrong answer.” [1] and “S-B only works for an object in thermal equilibrium with its surroundings.” [2]
Let me try a different tack. If not the SB law then what law or equation do YOU think should be used to relate radiant exitance to temperature?
I’m not sure there is one! The issue is not the temperature at which an object is radiating since even an iron rod being heated by a torch will radiate at the end being heated. The problem is that some of the heat in the object is being conducted down the rod and is not available for radiation. So the color of the radiation is not a correct indicator of the total heat in the rod. S-B for an object in thermal equilibrium will give a correct value for the heat in an object if it is at equilibrium, but it won’t if the object is not in thermal equilibrium.
Think of an iron rod immersed in the heated coals in a forge. That rod will be equally heated along its length and its color of radiation will give a valid indication of the total heat in the rod. Stick just one inch of the rod in the coals and it won’t. In fact the color of the radiation will change as you look down the rod indicating a non-equilibrium condition.
I’m not even sure that taking an infinitely thin slice of the rod will help since part of the heat flow through that slice will be perpendicular to the slice (i.e. conduction) and won’t be available for radiation. Thus you wouldn’t get a correct answer from S-B for the total heat in that slice.
You can probably calculate the conductive flow and subtract that but it’s too early in the morning for me to dig out the thermo books!
TG said: “I’m not sure there is one!”
So your position is that there is no way to relate the radiant exitance and temperature of body unless that body is 1) is in equilibrium with its surroundings and 2) the body is in a vacuum?
There is no way to use a simple alegebriac equation to find the irradiance of a body NOT at equilibrium with itself or other bodies. To do so you must define a gradient describing the change in temperature over time.
You are trying to define something that is best studied in a thermodynamic curriculum. I have spent my time at university learning thermodynamics for power plants and heat sinks for electronic power applications. Have you?
You should think about heat transfer problems for a CPU conducting heat to a heat sink that loses heat via radiation and conduction/convection (fan).
Let me make sure I have you and Tim’s position correct. When I point my Fluke 62 at a small 10 cm^2 patch of my deck that is pretty darn close to a homogenous emitter at 330 K (a value close to the k-type thermocouple reading using my Greenlee DM-830a) I cannot plug that into the SB law to conclude that the radiant exitance is 620 W/m2 with ε = 0.92 because my deck is neither in equilibrium with the surroundings (air temperature was at 298 K) nor is in a vacuum? And how was my Fluke 62 able to measure the temperature to within a couple of degrees of the k-type thermocouple if the SB law does not work for bodies not in thermal equilibrium with their surroundings nor in a vacuum?
You can determine the frequency of the radiation from your deck. S-B will give you this. IT WON’T TELL YOU THE TOTAL HEAT CONTENT OF THE BOARD ON YOUR DECK!
Why is this so hard to understand? I gave you the easily understood example of an iron rod heated at one end by a torch vs one immersed in the coals of a forge.
You keep wanting to say that the S-B will tell you the total heat content of the iron rod in both situations. IT WON’T.
You can argue that blue is red till the cows come home. But blue will still be blue at the end of the day!
TG said: “IT WON’T TELL YOU THE TOTAL HEAT CONTENT OF THE BOARD ON YOUR DECK!”
I’m not measuring the total heat content of the board on my deck. IR thermometers don’t do that. I’m determining the radiant exitance and temperature of the surface of the board. Nothing more.
TG said: “You keep wanting to say that the S-B will tell you the total heat content of the iron rod in both situations.”
I never said that. Not even remotely. In fact, I’ve never even mentioned the total heat content in any of these discussions.
“I’m not measuring the total heat content of the board on my deck.”
In other words, don’t confuse me with reality.
Why measure the radiation if it doesn’t completely describe the object being studied?
Who do you think you are fooling?
I didn’t say there isn’t a way – I even laid out how to do it!
tg:”You can probably calculate the conductive flow and subtract that but it’s too early in the morning for me to dig out the thermo books!”
Why do you never bother to read all of *anything*, including my posts?
If there is any conductive heat flow associated with an object then that heat flow is not available for radiation and S-B will give the wrong answer.
Please note:
Why do you disbelieve Planck?
TG said: “If there is any conductive heat flow associated with an object then that heat flow is not available for radiation and S-B will give the wrong answer.”
That’s not right. Conductive heat flow does not in any way invalidate the SB law for radiation. Just like radiant heat flow does not in any way invalidate Fourier’s law for conduction.
Both conductive heat flow and radiant heat flow will effect how temperature and thus radiant exitance evolves with time, but it does not invalidate the SB law or Fourier’s law.
If you are wanting to know how temperature is evolving with time in a scenario in which conduction is in play then you integrate the total heat transfer including radiant transfer εσ(Th^4 – Tc^4) and conductive transfer U(Th – Tc)) for both the hot (h) and cold (c) body incorporating the temperature change via dT = dE/(m*c) of each body at each time step.
That procedure does not mean either the SB law nor Fourier’s law is invalid when conduction and radiation are happening. On the contrary, it relies on the fact that both the SB law and Fourier’s law are valid.
“That’s not right. Conductive heat flow does not in any way invalidate the SB law for radiation. Just like radiant heat flow does not in any way invalidate Fourier’s law for conduction.”
And here we are again: “Don’t confuse me with reality”.
If you aren’t interested in describing the object being studied then what *are* you interested in? Describing the object requires determining *both* radiation and conduction.
“Both conductive heat flow and radiant heat flow will effect how temperature and thus radiant exitance evolves with time, but it does not invalidate the SB law or Fourier’s law.”
Again, why aren’t you interested in fully describing the object being studied?
This is all word salad being used to cover up the fact that you were wrong with your initial assertion. You are now arguing how many angels will fit on the head of a pin without worrying about how big the head of the pin is!
You just aren’t very interested in reality are you? It shows in every thing you get involved in!
TG said: “Your statements are only true for isolated bodies in a vacuum!”
I want to dig deeper on this. Here are my statements.
1) Water warms when energy is delivered to it via infrared radiation.
2) Water below the surface emits radiation.
3) The SB law works for all bodies with a radiant exitance J and temperature T regardless of whether those bodies are in thermal equilibrium with their surroundings.
Are you suggesting…
1) Water warms by infrared radiation only when it is in a vacuum?
2) Water below the surface emits radiation only when it is in a vacuum?
3) The SB law works for bodies only when they are in a vacuum and only when they are in equilibrium with their surroundings?
“1) Water warms by infrared radiation only when it is in a vacuum?”
Stop putting words in my mouth.
“2) Water below the surface emits radiation only when it is in a vacuum?”
Stop putting words in my mouth.
“3) The SB law works for bodies only when they are in a vacuum and only when they are in equilibrium with their surroundings”
Stop putting words in my mouth.
I have made this very clear to anyone that reads it. All you are doing is putting words in my mouth to create strawmen arguments.
S-B doesn’t give the correct answer if there any conductive heat transfer associated with an object.
It’s a plain statement. You are looking for a way to refute it by creating strawmen. STOP!
I’m just asking questions. If you aren’t challenging those 3 statements then what’s the problem?
My problem is that you are implying those are *MY* words and beliefs. They aren’t. They are *YOUR* words!
STOP PUTTING WORDS IN MY MOUTH!
Your the one that said:
“If the particle is not in thermal equilibrium with the surrounding material S-B will give a wrong answer.” [1]
and
“S-B only works for an object in thermal equilibrium with its surroundings.” [2]
and
“Your statements are only true for isolated bodies in a vacuum!” [3]
Note that all of this is in the context my statements that 1) infrared radiation warms water and that 2) parcels of water below the surface radiate in accordance with the SB law which Jim Steele challenged…vehemently.
S-B gives the wrong answer for the heat in any object involved in conduction.
Period.
Learn it, love it, live it.
ROFL!
JG said: “it is required that a body be at a single temperature throughout.”
Yeah obviously. That’s literally in the SB law itself. It says F = εσT^4. Notice that there is a single temperature variable T. If the emitting surface cannot be represented by T then you can’t use the SB law as-is [1].
That’s not what is being discussed. What is being discussed are two surfaces A and B at temperatures Ta and Tb. Both surfaces are individually represented with their own one and only temperature value. The SB law can be used on either body A and/or body B regardless of whether Ta = Tb or Ta != Tb. Note that in real world applications like when A is the target body and B is the radiometer or thermopile Ta never equals Tb.
[1] You can actually still use the SB law to estimate the radiant exitance for non-homogenous emitter, but you’ll get a rectification error that has to be considered. The way this handled is integrating the SB law wrt to the area of the surface where each subsurface has its own T to be considered.
jg: “JG said: “it is required that a body be at a single temperature throughout.””
bdgwx: “Yeah obviously.”
An object with a single temperature throughout *is* in thermal equilibrium! Therefore S-B gives the correct answer for the radiation.
If the object is *not* a single temperature throughout then S-B will give an incorrect answer.
You’ve now tried to have it both ways! !. S-B does give the correct answer for an object not in internal thermal equilibrium and 2. S-B doesn’t give the correct answer for an object not in thermal equilibrium.
Typical!
bdgwx wants it both ways, as usual for him.
He says whatever he has to say and then backs it up with word salad that doesn’t actually address the issue at hand.
TG said: “S-B gives the correct answer for a body not in thermal equilibrium”
Strawman alert. I never said that. What I said is that the SB law gives the correct answer for a body even when it is not in thermal equilibrium with its surroundings.
Do you understand the difference between a body being in thermal equilibrium with another body and being in thermal equilibrium itself?
Do I *really* have to go back to through the thread to find where you said S-B would still give the correct answer for a body not in internal thermal equilibrium?
That *is* what triggered the discussion about conduction of heat internally not being available for radiation, that S-B has no conductive factor, and your statement that you could just divide the body up into parcels that were and weren’t in thermal equilibrium!
Do *YOU* understand the difference between a body being in thermal equilibrium with another body and being in thermal equilibrium itself? Apparently not! That or you are now trying to fool everyone into thinking you were correct from the start!
TG said: “Do I *really* have to go back to through the thread to find where you said S-B would still give the correct answer for a body not in internal thermal equilibrium?”
Yes.
TG said: “Do *YOU* understand the difference between a body being in thermal equilibrium with another body and being in thermal equilibrium itself?”
Yes.
For two bodies A and B they are in thermal equilibrium with themselves if they can be represented by single values of radiant exitance Ja and Jb and single values of temperature Ta and Tb.
For two bodies A and B with radiant exitance Ja and Jb and temperature Ta and Tb they are in thermal equilibrium with each other when Ja = Jb and Ta = Tb.
TG said: “That or you are now trying to fool everyone into thinking you were correct from the start!”
I stand by my statements, namely that…
1) Water warms when it is delivered energy via infrared radiation.
2) Water below the surface emits radiation.
3) The SB law works for bodies even though they may not be in thermal equilibrium with their surroundings.
I’ll even two more…
4) The SB law works for bodies even though they may not be in a vacuum.
5) The SB law can be used in the analysis of a body not in thermal equilibrium itself by sub-diving the body into sub-bodies that without appreciable error may be regarded as being in a state of thermal equilibrium.
Your comment about Planck and S-B requiring equilibrium is very pertinent to part of the issues I have been trying to elucidate about using averages of irradiance of the sun on the earth. An average assumes the same irradiance all over the sun side of the earth. This is a farse to begin with. However, part of the problem is that the earth and sun can only be at equilibrium at one point, the 90 degree point as the sun traverses the earth. This is when the maximum amount of radiation is absorbed by the earth. For a brief moment in time any given point receives that 90 degree radiation. Everywhere else is receiving some smaller amount of radiation and will never reach the temperature of that point. That is why it is important to move into trigonometric functions to begin understanding the intricate details of the earth’s temperature. Averages are for unsophisticated, back of the envelope guesses but that is all.
JG said: “Your comment about Planck and S-B requiring equilibrium is very pertinent to part of the issues I have been trying to elucidate about using averages of irradiance of the sun on the earth.”
That is a completely different issue. No one is challenging the fact that there is a rectification effect [Trenberth et al. 2009][1] that causes a discrepancy between average radiant exitance and temperature values vs the average temperature and radiant exitance of a non-homogenously emitting or thermally uneven body when using the SB law. This is due to the T^4 term. It’s something I have to remind people of often.
The original claim by TG and Jim Steele is that water below the surface does not emit radiation which then got expanded to the SB law does not work for bodies that are not in equilibrium with their surroundings. That all evolved from the claim that infrared radiation cannot warm water. That is what is being discussed.
BTW part 1…the rectification effect for Earth is about 6 W/m2 and 1 K. For the Moon it is about 210 W/m2 and 70 K. The reason for the Moon’s significantly larger rectification effect is due to its significantly larger spatial and temporal variance in spot temperatures and radiant exitances.
BTW part 2…the other mistake people make with the SB law is they erroneously think it relates the total energy input or output to temperature. It does not. It relates radiant exitance to temperature. Nothing more. It is an important distinction especially when discussing bodies that shed energy in a form other than radiation.
[1] I mention the Trenberth et al. 2009 publication because there is a myth out there that climate scientists are unaware of this effect which is obviously false.
“The original claim by TG and Jim Steele is that water below the surface does not emit radiation”
That is *NOT* what we are arguing. Why do you keep making this kind of stuff up!
What we are saying is that conductive heat is far, far larger, by multiple orders of magnitude, than any radiative heat and that is the conductive heat that warms the cooler water below and not radiative heat.
“got expanded to the SB law does not work for bodies that are not in equilibrium with their surroundings”
It does *NOT* give the correct value because there is no factor for conductive heat. It assumes thermal equilibrium so there is zero conductive heat at play. That is *NOT* the same thing as saying there is no radiation at all which is what you are trying to imply we have said!
TG said: “That is *NOT* what we are arguing.”
That is exactly what Jim Steele said. And even after I explained how you could easily prove it in your own home he wouldn’t budge.
TG said: “What we are saying is that conductive heat is far, far larger, by multiple orders of magnitude, than any radiative heat and that is the conductive heat that warms the cooler water below and not radiative heat.”
No. That’s what I said. I even did the calculations showing it. I also tried to explain how heat actually gets retained using the TSL model that Wong & Minnett used in their publication and which contained the figure JS used in his publication. The primary mechanism in play they say is…conduction… a fact which I explained right from the start.
TG said: “It does *NOT* give the correct value because there is no factor for conductive heat. It assumes thermal equilibrium so there is zero conductive heat at play.”
It does give the correct value. Conductive does not effect radiation directly. And the SB law does not assume thermal equilibrium between the body and its surroundings. It only assume thermal equilibrium of the body itself. If you want to know the total heat transfer you have to add both the radiant and conductive values together.
Take the example from my post linked to above for parcel of water (body H) at temperature Th = Tc + 1 and for the surroundings (body C) at temperature Tc. For a 1 millimeter interface (body I) between bodies H and C the conductive flux is 6000 W/m2 and the radiant flux is only 6 W/m2 for a total flux of 6006 W/m2. Both happen simultaneously. The conductive flux alone will equilibrate both sides of the interface in 667 milliseconds whereas with the radiant flux alone is 11.1 minutes. With both together it 666 milliseconds or 1 ms faster than just conduction alone.
BTW…notice that the conductive heat transfer equation has no terms regarding radiation just like the radiant heat transfer equation has no terms regarding conduction. Conduction occurs with or without radiation just as radiation occurs with or without conduction. Both will indirectly modulate the rate of the other via the change in temperature though.
Which is exactly why all the simplistic energy balance “models” that people promote are useless. bwx has his own version of one.
Nick, where’s that answer to the renewable electrification facts presented in that other thread?
The adjustments are fundamentally different.
Climategate 2.0 emails revealed that Phil Jones thought the 2°C limit was
pulled out of thin air.
http://www.climatedepot.com/2017/07/31/flashback-climategate-emails-phil-j
ones-says-critical-2-degree-c-limit-was-plucked-out-of-thin-air/
He also admitted this: “This recent warming trend was no different from others we have measured. The world warmed at the same rate in 1860-1880, 1919-1940, and 1975-1998.”
This was about 3 mos after Climategate broke- possibly a CYA move in case
their were real consequences for lying.
https://joannenova.com.au/2010/02/shock-phil-jones-says-the-obvious-bbc-asks-real-questions/
“He also admitted this”
That is JoNova’s made up version. That is not what he said.
Here’s what the actual BBC article said- NO SUBSTANTIVE
DIFFERENCE! STOP QUIBBLING LIKE A YOUNG TEENAGE BOY!
YOU’RE EMBARRASSING YOURSELF!!!
The BBC’s environment analyst Roger Harrabin put questions to Professor Jones, including several gathered from climate sceptics. The questions were put to Professor Jones with the co-operation of UEA’s press office.
A – Do you agree that according to the global temperature record used by the IPCC, the rates of global warming from 1860-1880, 1910-1940 and 1975-1998 were identical?
An initial point to make is that in the responses to these questions I’ve assumed that when you talk about the global temperature record, you mean the record that combines the estimates from land regions with those from the marine regions of the world. CRU produces the land component, with the Met Office Hadley Centre producing the marine component.
Temperature data for the period 1860-1880 are more uncertain, because of sparser coverage, than for later periods in the 20th Century. The 1860-1880 period is also only 21 years in length. As for the two periods 1910-40 and 1975-1998 the warming rates are not statistically significantly different (see numbers below).
I have also included the trend over the period 1975 to 2009, which has a very similar trend to the period 1975-1998.
So, in answer to the question, the warming rates for all 4 periods are similar and not statistically significantly different from each other.
Here are the trends and significances for each period:
Period Length Trend Significance
(Degrees C per decade)
1860-1880 21 0.163 Yes
1910-1940 31 0.15 Yes
1975-1998 24 0.166 Yes
1975-2009 35 0.161 Yes
http://news.bbc.co.uk/2/hi/science/nature/8511670.stm
Your “quote” was made up. It’s nothing like what he actually said.
Whew! I see you finally provided an accurate quote of what he actually said… oh wait… no, you didn’t…
You have just stuffed up royally, Nick Stokes. Well done!
So don’t leave us hanging Nick, what did he say? Why wouldn’t you tell us up front, do you have a communication problem?
Nick loves his hockey stick.
Thanks for providing his quote to set the record straight… oh wait.
No. it’s what he said.
That’s the chart I’ve been looking for!
Yes, all three periods warmed at the same magnitude and reached the same high temperatures. All three of them.
Of course, NASA Climate and NOAA have since bastadized the temperature record, and they show the 1930’s and the 1880’s, as cooler than today, but what is interesting about their bastardized temperature record is they show the 1880’s and the 1930’s highpoints as being equal.
And, of course, we know that the 1930’s was actually warmer than todayand so that would mean that the 1880’s were also just as warm as today.
So what do we see? We see a cyclical movement of the temperature record since the 1800’s. The temperatures warmed up to a highpoint in the 1880’s, then the temperatures cooled for a few decades into the 1910’s, then the temperatures again warmed into the 1930’s, reaching the same temperature highpoint as was reached in the 1880’s, then the temperatures cooled for a few decades into the 1970’s, and then the temperatures warmed again to 1998/2016 where the temperatures were about the same as the 1880’s and 1930’s, and now we are experiencing several years of cooling. Which would be consistent with the cycle which warms for a few decades, then cools for a few decades and the warming and the cooling stay within certain bounds.
There is nothing to worry about with Earth’s climate. Nothing unusual is happening. What is happening today has been happening since the end of the Little Ice Age.
The only thing that disputes this story is a bogus, bastardized global Hockey Stick “temperature” record. And disputing this story was, of course, the reason why the temperature record was bastardized. The historic, written temperature record wasn’t nearly scary enough for the alarmists, so they changed it in their computers to make it appear the Earth is currently experiencing unprecedented warmth caused by CO2. Nothing could be further from the truth.
TA said: “And, of course, we know that the 1930’s was actually warmer than todayand so that would mean that the 1880’s were also just as warm as today.”
Would you mind posting a global average temperature timeseries showing that the 1930’s was actually warmer than today?
They have all been mal-adjusted away !
I can post regional temperature charts from all over the world that show it was just as warm in the Early Twentieth Century as it is today. Would that suffice for a global average temperature? it would for me.
Here’s the U.S. regional temperature chart which shows the cyclical nature of the climate:
And here are about 300 similar charts:
http://notrickszone.com/2017/06/16/almost-300-graphs-undermine-claims-of-unprecedented-global-scale-modern-warmth/#sthash.neDvp33z.hWRS8nJ5.dpbs
All these charts show the historic temperatures don’t look anything like the profile of the bogus, bastardized Hockey Stick global “temperature” chart.
What I don’t understand is, having all this evidence available, why would anyone believe the bogus Hockey Stick represents reality?
Not everyone has this information avialable to them, but for those that do, and that would include all the alarmists visiting this website, imo, I still have that question. Why would you believe the Hockey Stick represents reality when there is so much evidence refuting the Hockey Stick “hotter and hotter” temperature profile? You don’t have any questions about it?
You won’t get an answer. It’s a matter of religious dogma.
What does the chart look like when corrections for the time-of-observation bias and instrument/shelter change bias are applied?
TA said: “What I don’t understand is, having all this evidence available, why would anyone believe the bogus Hockey Stick represents reality?”
You shouldn’t just believe it. You should see if there is convincing evidence suggesting it is egregiously wrong.
What does this have to do with UAH adjustments?
TA said: “Why would you believe the Hockey Stick represents reality when there is so much evidence refuting the Hockey Stick “hotter and hotter” temperature profile? You don’t have any questions about it?”
I don’t believe the Hockey Stick any more or less than I believe UAH or any other global average temperature timeseries. What I have to accept, however, is that the evidence available is not convincing enough to suggest it is egregiously wrong especially considering that it has been replicated many times. There is a whole hockey league of hockey sticks now. They’re everywhere.
Again…what does this have to do with UAH adjustments?
You really are a fraud.
The adjustments made to UAH are open for all to see. Everyone of them can easily be explained and justified.
None of these are true regarding the surface station network,
But beyond that, the problem with the contamination of the ground based network is unsolvable.
Only a total fool would use the ground based data for anything. Either a fool or lying bastard.
UAH is not open. They do not release their source code. No independent verification can made of their results. Contrast this with GISTEMP which does release their code here. Everything you need to replicate their result is provided. In fact, it is packaged so well that you can have the dataset reproduced on your own PC in less than an hour. You can even modify the source code to do your own experiments.
If you don’t trust the UAH calculations then don’t use them. But don’t lie about them saying their adjustments are just as bad as those made to the surface record.
I never said I didn’t trust the UAH calculations nor did I describe their adjustments as “bad”. And as you can see above I have no problem equally weighting UAH among the other datasets.
And jamming them all together you get the alarming warming rate during a cyclical upswing in global temperatures of less than 2 ℃ per Century. What is it you are trying to prove, bdgwx?
I don’t think 2 C/century is alarming. I’m curious…why do you think it is alarming?
Its alarming because it is not consistent with the average of all CMIP6 CliSciFi models’ ECSs.
You didn’t answer the question, bdgwx: What are you trying to prove? The implication is that UAH6 is an outlier, with no explanation as to its significance.
DF said: “What are you trying to prove?”
That you can plot many different datasets and compare them to each other.
To what end? Why do you think they differ?
DF said: “To what end?”
To see their differences and provide an ensemble mean.
DF said: “Why do you think they differ?”
Because there is uncertainty in their measurements.
Oh the irony.
bdgwx:
1) Again, to what end?
2) Both UAH and RSS use the same measurements. Similarly, the other datasets each use the same measurements. Again, why do you think they differ?
DF said: “1) Again, to what end?”
Again…to see their differences and provide and ensemble mean.
DF said: “2) Both UAH and RSS use the same measurements. Similarly, the other datasets each use the same measurements. Again, why do you think they differ?”
The only two that I’m aware that use the same inputs is GISTEMP and NOAAGlobalTemp. UAH and RSS use most of the same inputs, but there are differences in their selection of inputs. Anyway, most of the differences are due to measuring different things and the methodological choices made in processing the data.
“Anyway, most of the differences are due to measuring different things and the methodological choices made in processing the data.”
How can there be methodological choices in processing data when CO2 is the basis for increasing temperature? That tells me that science has no idea about a relationship between CO2 and temperature.
The purpose here is to define the relationship between CO2 and temperature, not to simply process data to play around with temperature trends. What a waste of taxpayer money.
JG said: “How can there be methodological choices in processing data when CO2 is the basis for increasing temperature?”
The same way that there are methodological choices in processing that same data even though solar activity, clouds, snow/ice cover, advection, convection, diabatic heating/cooling, ocean/air heat fluxes, and many others are the basis for increasing/decreasing temperature too. Just because there are physical processes modulating the temperature does not mean there are not choices in how that temperature data is processed.
JG said: “That tells me that science has no idea about a relationship between CO2 and temperature.”
Science’s understanding of the relationship between CO2 and temperature is more than “no idea”. But that is moot since the relationship does not effect how the temperature is measured and aggregated into a spatial average covering the globe from most datasets. Caveat…ERA5 assimilates GOES-R ABI channel 16 which responds to the minor 13.3 um band of CO2. None of the other datasets have a dependency on CO2 though.
JG said: “The purpose here is to define the relationship between CO2 and temperature”
No. My goal is only to compare as many measurements of the global average temperature as I can. Don’t hear what I’m not saying. I’m not saying that analyzing the relationship between CO2 and temperature isn’t useful. I absolutely is. It’s just not the focus of my graph above and Dave Fair’s questions.
Why? Its a meaningless number.
And I have become convinced that all the attention given to temperature being caused by CO2 is pure propaganda.
You can not trend temperature against time and obtain any useful information.
JG said: “You can not trend temperature against time and obtain any useful information.”
You can’t tell if something is warming, cooling, or staying about the same by computing the trend with temperature on the y-axis and time on the x-axis?
You may follow the changes, but you can neither determine what is causing the change, nor where the change will be going. To forecast properly, you need to know what is causing it and the functional relationship between the various variables.
You can’t, right now, tell me if the changes are caused by natural variation or if CO2 is the direct cause. In fact, you can’t even tell me if CO2 is the predominant variable in determining temperature from simply plotting temperature versus time.
You said, “UAH is adjusted and interpolated too; arguably more so than the other datasets.”
Yep. I said what I meant and meant what I said.
At least your lies are consistent with each other.
MarkW said: “At least your lies are consistent with each other.”
I’m not lying about UAH’s adjustments. Here is the complete list with citations.
Year / Version / Effect / Description / Citation
Adjustment 1: 1992 : A : unknown effect : simple bias correction : Spencer & Christy 1992
Adjustment 2: 1994 : B : -0.03 C/decade : linear diurnal drift : Christy et al. 1995
Adjustment 3: 1997 : C : +0.03 C/decade : removal of residual annual cycle related to hot target variations : Christy et al. 1998
Adjustment 4: 1998 : D : +0.10 C/decade : orbital decay : Christy et al. 2000
Adjustment 5: 1998 : D : -0.07 C/decade : removal of dependence on time variations of hot target temperature : Christy et al. 2000
Adjustment 6: 2003 : 5.0 : +0.008 C/decade : non-linear diurnal drift : Christy et al. 2003
Adjustment 7: 2004 : 5.1 : -0.004 C/decade : data criteria acceptance : Karl et al. 2006
Adjustment 8: 2005 : 5.2 : +0.035 C/decade : diurnal drift : Spencer et al. 2006
Adjustment 9: 2017 : 6.0 : -0.03 C/decade : new method : Spencer et al. 2017 [open]
Note that in adjustment 1 the “simple bias correction” is anything but simple. Those were Christy’s words; not mine. They’re “simple bias correction” is actually rather complex. I encourage you to read the publication and those it cites.
I make 3 comments, and you fixate on the least significant.
Does this mean you are conceding that my other comments are completely correct?
I commented on the only statement relevant to the topic being discussed. The other two had nothing to do with UAH so I choose to ignored them at the time. I have no problem addressing them now though.
The surface station datasets are contaminated with biases just like the satellite and radiosonde datasets are. But it is clearly a solvable issue since there are many datasets that do just that. In fact, there are more datasets based on surface station observations than satellite observations.
And the surface station observations are in widespread use. I highly suspect even you use those observations for planning your daily activities. I would say the majority of people use these observations. Are we all fools or liars?
You forgot “frauds” in this list.
Sorry about that. I’ll reword the question. To MarkW, do you think those of us who use surface observations either directly or indirectly for daily planning or otherwise are fools, liars, and/or frauds?
Nice twisting of the subject.
Again, most people only look at the tens digit when planning daily activities. Do *you* try to decide what the daily temp is going to be down to the hundredths digit?
TG said: “Again, most people only look at the tens digit when planning daily”
A single degree at the surface can mean the difference between the capping inversion breaking or not. A single degree can mean the difference between wind chill warming or not. A single degree can mean the difference between heat warming or not. A single degree can mean the difference between a rain and major ice storm. A single degree can mean the difference between 1″ of snow and 10″ of snow. Single degrees matter…a lot.
TG said: “Do *you* try to decide what the daily temp is going to be down to the hundredths digit?”
No. And neither does UAH report the temperature in my city at a specific time.
“A single degree at the surface can mean the difference between the capping inversion breaking or not.”
So what? Again, most people only look at the 10s digit when planning daily activity. They actually probably pay more attention to the rain forecast!
“No. And neither does UAH report the temperature in my city at a specific time.”
Then why all the fixation on the hundredths digit in the GAT? It’s meaningless as well as having an uncertainty greater than the differential it’s trying to identify.
“But it is clearly a solvable issue since there are many datasets that do just that. “
Not unless you have a time machine!
All of the datasets are derived from the same basic temperature readings from the same basic measuring stations. There simply aren’t multiple temperature measuring networks at play around the globe.
“And the surface station observations are in widespread use. I highly suspect even you use those observations for planning your daily activities. I would say the majority of people use these observations. Are we all fools or liars?”
Most people aren’t trying to identify changes in temperature down to the hundredths or thousands of a degree! When planning daily activities most people only worry about the tens digit! Is it going to be in the 60’s, 70’s, 80’s, etc!
TG said: “Not unless you have a time machine!”
NASA, NOAA, Hadley Center, UAH, RSS, Copernicus, Berkeley Earth, etc. do not have time machines and they were able to figure it out.
This is your big lie: all the UAH data has been collected over time, they do not need to go back in and dry-lab “adjustments” and “calibrations” to historic data, unlike you and your squad of frauds.
CM said: “This is your big lie: all the UAH data has been collected over time, they do not need to go back in and dry-lab “adjustments” and “calibrations” to historic data, unlike you and your squad of frauds.”
If it is a lie then it comes from Spencer, Christy, Grody, McNider, Lobl, Braswell, Norris, Parker, and anyone else listed as an author that I may have missed on the various methods papers since 1990.
Are you incapable of reading?
UAH does NOT use mining old data and applying willy-nilly changes, a fraudulent activity in which you revel.
Nailed it!
They were *NOT* able to figure it out. There is no way to determine the calibration of a thermometer 80 years ago. No amount of calculation can provide that data. They used biased guesses. I believe it was Hubbard and Lin that proved around 2002 that anything other than a station-by-station adjustment was viable and even that had an uncertainty associated with it that had to be identified.
You argument is nothing more than the argumentative fallacy of a False Appeal to Authority – there is *NO* authority with a time machine!
They have not been able to “figure it out”. They are merely making guesses as to what they think any changes should be. Don’t tell me computer algorithms make a better and reliable change. The program is merely doing what the programmer wanted. Even a computer can not tell if a measurement recorded a century ago is correct and what errors might have been made. As I’ve said many times, if you can’t trust the data, then discard it. At best, stop the record and start a new one.
I’ve also yet to see you or anyone else give an explanation as to why maintaining “long” records by splicing temperature readings together via “adjustments” is so essential.
Please give a scientific and statistical reason for doing so.
“ I would say the majority of people use these observations. Are we all fools or liars?“
If contradictory statements are found in your other writings you could be proved a liar, but without further evidence it is impossible to to tell which applies more accurately. The fact is no one is planning their day differently based on a one or two degree difference in predicted temperature; and those predictions are based on actual recent temperatures, not the after-the-fact adjustments made to records.
Ted said: “The fact is no one is planning their day differently based on a one or two degree difference in predicted temperature; and those predictions are based on actual recent temperatures, not the after-the-fact adjustments made to records.”
First…yes they are whether they realize it or not.
Second…what difference does it make if it is 1 degree or 10 degrees? The claim was that anyone using them at all is a fool, liar, and/or fraud.
More sophistry—it is your “adjustments” to historic data that are fraudulent.
Land use changes (swamp draining, forest removal, additional crop land & etc.) in addition to worsening UHI bias temperature trends upward. But it all gets bundled in as CO2-driven warming.
Irrigation will make thing different. How do you control for the water projects in the 20th century. You can’t. Now climate wise they make little difference but how and were land based measurements are done they do make a huge difference. How do you control for that?
mal, what does this have to do with my comment? I have no idea as to what you are trying to get at.
You can’t. Even an impoundment created by a beaver dam can make microclimate changes at a measuring station. CAGW advocates simply don’t understand that!
When did the sweat 1st appear on your brow in this extreme heat increase? What year did you think we were in trouble?
I don’t know that we are in trouble. Though that really depends on your definition of “trouble”.
All weather phenomena completely within the range of normal.
Temperatures still lower than Medieval, Roman, Minoan and Egyptian warm periods and several degrees lower than the majority of the Holocene optimum.
Enhanced CO2 making plants grow faster and stronger.
No trouble here.
Can you post a link to a global temperature reconstruction showing that it is cooler today than during the Medieval, Roman, Minoan, and Egyptian warm periods?
You can find numerous temperature reconstructions on a wide range of time scales simply by scrolling down this page:
https://wattsupwiththat.com/paleoclimate/
Thanks. Is there a global temperature reconstruction in that list that you want me to look at?
Don’t expect an honest answer from bdgwx, he’s almost as good as Nick at moving the goal posts and answering questions that weren’t asked.
Oh yeah, highly skilled in sophistry.
I haven’t placed a goal post. You’re the one that placed it at “Temperatures still lower than Medieval, Roman, Minoan and Egyptian warm periods and several degrees lower than the majority of the Holocene optimum.” I’m just trying to figure out if you can kick the ball through where it in the spot you placed it.
How about this?
What about it? Does it tell me the global average temperature during the Medieval, Roman, Minoan, and Egyptian warm periods?
It’s great to know you accept that temperatures were indeed much higher 5000 years ago.
Here’s the Minoan Warm Period:
https://journals.sagepub.com/doi/abs/10.1177/0959683617752840?journalCode=hola
Graemethecat said: “It’s great to know you accept that temperatures were indeed much higher 5000 years ago.”
I didn’t say that.
Graemethecat said: “Here’s the Minoan Warm Period:
https://journals.sagepub.com/doi/abs/10.1177/0959683617752840?journalCode=hola“
That’s great. It is only for Crete and secondarily Greenland. Additionally they adopt the academic standard of using before present (BP) which is anchored on 1950; not the date of the publication.
Now, take that study and combine with studies focused on locals all around the world and add in the global average temperature after 1950 and see what you get.
Nice link, thanks.
The GAT is a meaningless number.
Yes.
Fixating on GAT, allows the ignoring of other inconvenient factors in the past.
I suspect that bdgwx’s game here is to demand a “global” temperature reconstruction. Warmer paleo temperatures demonstrated by ice cores from the Arctic? Well, that’s not the globe! What about Antarctica? Also not the globe! Clear evidence of settlement and civilization revealed by melting glaciers in Europe? That’s just one place! Evidence of warmer medieval temperatures and multi-century megadrought in California lake beds? Just a convenient coincidence! Etc., etc., etc.
Of course, a mishmash of cherry picked tree ring proxies from a patch of trees in Russia and misused American stripbark bristlecones can give you good consensus global temperature reconstruction science. But the numerous proxies from all over the globe that don’t e.g. invert their data to show warming rather than cooling- those are just a few data points.
Reacher51 said: “I suspect that bdgwx’s game here is to demand a “global” temperature reconstruction.”
That is exactly what I demand. They exist so it is not unreasonable demand.
They exist in exactly the same form as the data I referred you to. Take the northern hemisphere proxies as representative of the northern hemisphere, and take the southern hemisphere proxies as representative of the southern hemispere, et voila. What do you believe the “global” reconstructions do that is any different, other than preposterously use computer simulations in lieu of actual data, or preposterously tack thermometer reconstructions (from equally non-global thermometers) onto imagined temperatures derived from tree rings?
There is no instrumental proxy that covers every square inch of planet earth. As of AR4, the IPCC had exactly 5 proxies that could even indicate temperature in the southern hemisphere going back 1000 years. There were two proxies in South America, one in Australia, one in New Zealand, and one in Antarctica. There were zero proxies in Africa and zero in any of the vast oceans surrounding the continents. Is that noticeably different from the data you will get from the long list of proxies found on the WUWT page? It doesn’t seem to be.
If you prefer to use other supplemental forms of evidence, such as agricultural records, then read Lamb. He made this his life’s work, long before people developed their current religious zeal and flipped the scientific method by starting with their preferred answer and then shoehorning in any data they could find to support it. Lamb found nothing special whatsoever about our modern period, almost certainly because there exists nothing special about it, other than a tribal fever that easily obscures any common sense or reason that people might otherwise have.
This is not actually so special either, of course, people having marveled at freakish and unprecedented weather and changing climates throughout history, but it is especially pathetic that our few centuries of the Enlightenment can be wiped away so easily.
Reacher51 said: “hey exist in exactly the same form as the data I referred you to. Take the northern hemisphere proxies as representative of the northern hemisphere, and take the southern hemisphere proxies as representative of the southern hemispere, et voila.”
Great. If you already have both the NH and SH reconstructions then it shouldn’t be that hard to combine them together to produce a global average. What ones in that list do that?
Reacher51 said: “What do you believe the “global” reconstructions do that is any different”
They give us the global average temperature so that we can compare with other global average temperature datasets. Ya know…an apples-to-apples comparison. That we way can answer the question of whether the Medieval, Roman, Minoan, and Egyptian warm periods were warmer than today. Showing me a picture of a tree at 70N, 113 W dating to 5000 BP tells me almost nothing about the global average temperature during the Medieval, Roman, Minoan, and Egyptian warm periods. Likewise, giving me a list of local temperature reconstructions by themselves tells me nothing about what the global average temperature was doing.
I’ll say it again. We have all of these local temperature reconstructions so it shouldn’t be hard to combine them into a global average. Several studies do just that. Why not post some of them?
Perhaps YOU could post evidence that temperatures today are unprecedently high compared with the past.
Don’t bother if all you have is Mann’s Hockey Stick.
Graemethecat said: “Perhaps YOU could post evidence that temperatures today are unprecedently high compared with the past.”
I don’t think that I can since the evidence is pretty convincing that it has been warmer in the past. I don’t think we can even eliminate the possibility that it was warmer during the Holocene Climate Optimum.
Firstly, if each one of the individual proxies that you use to understand climate history show the Medieval, Roman, Minoan, etc. warm periods as being warmer than present, then you can determine on this basis that those periods were warmer. This is true without pretending to calculate what the average global temperature might have been.
Similarly, if one discovers that there was a forest growing 5000 years ago someplace that until yesterday was completely covered in ice, then this also shows you that that specific location was far warmer 5000 years ago then it was during the icy period. This should be a very easy concept for you to understand.
Secondly, proxies are generally used to show anomalies, not specific temperatures, and anyway can only be reasonably compared against themselves.
Thermometers may be directly compared to thermometers. Thermometers cannot be reasonably compared to tree rings or to measurements of sea ice extent.
Thirdly, in order even to directly compare thermometers, one would need to ensure not just consistency among the instruments themselves, but also whether they are even measuring at the same time scale. Hourly measurements, for example, are not remotely comparable to average annual measurements.
If I have a thermometer that shows me the average annual temperature where I live, then I may find that the average temp is 68F, and that this temperature hasn’t varied by more than 2F for the past 100 years. If I have another instrument that records hourly temperatures, however, then I can find that in the past year alone the temperature has swung from -25F to 102F. If were to plot those two data series as one graph, I could then I could demonstrate a temperature that has remained almost completely stable at nearly 68F for an entire century, but that suddenly started going berserk and spiking wildly up and down last year. I could then use my graph to demonstrate to the world’s imbeciles that the weather in my town has obviously gone completely haywire (as predicted!). I could also be incredibly successful in do so, since this is exactly the kind of dreck that is highly persuasive to the Climate Faithful. However, regardless of how many millions of people I could convince, it would still not actually be true.
If you take numerous proxies and mash them together into a supposed average temperature that you believe is giving you a specific temperature for planet earth, then you are making every one of the mistakes mentioned above. Individual proxies may give you a useful indication of whether temps were rising or falling over a particular time period in a particular area, but in most cases they are not directly comparable to a mercury or digital thermometer. Even if they were, unless their resolution is exactly one year, then they still wouldn’t be comparable.
This is how you end up with monstrosities like this: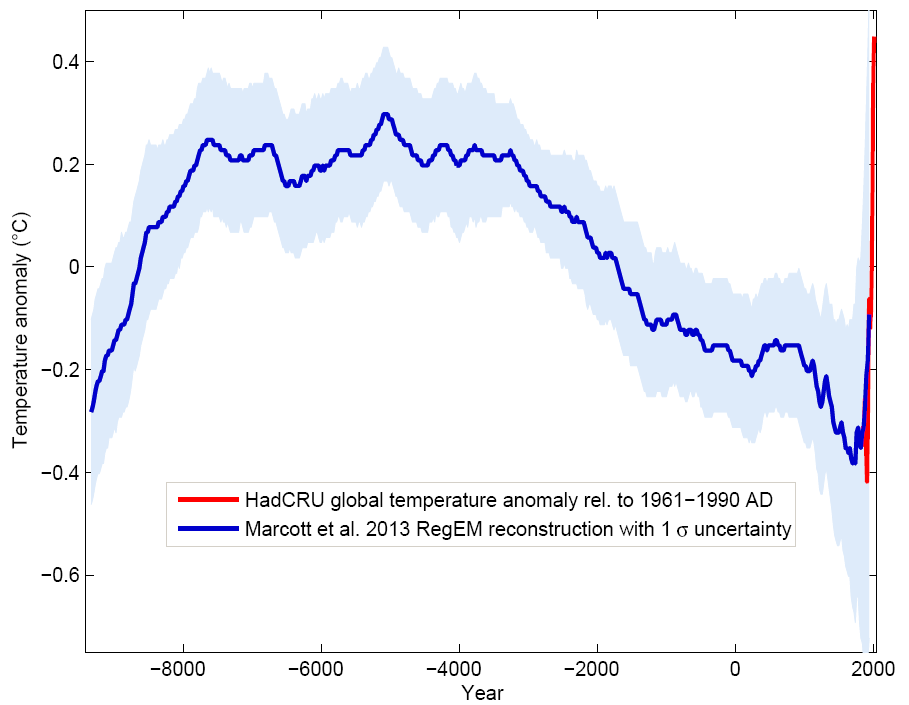
The blue line, which is a mash of proxies with resolution >300 years shows the most modern measured time as arguably being a bit warmer than medieval times but cooler than Roman times (note: in anomaly, not actual temperature). The red line, which appears to contrast with the blue, is showing average temperature anomaly vs. a 30 year average period.
Can you usefully compare a 300+ year average temperature to a 1 year average temperature? No, you cannot. If you were to show each individual year covered by the blue line as an anomaly vs. a particular 30 year period, would you see spikes at least as great as the one shown with the red line? Almost certainly yes.
Compare apples to apples and oranges to oranges, and you will find ample evidence to show that previous warm periods were at least as warm, and often far warmer, than today. Compare apples to oranges, and you can show almost anything you like. But you will fail science class (unless it is climate science, apparently, in which case you will pass with high honors).
So to summarize what you are saying is that you feel MarkW’s claim that “Temperatures still lower than Medieval, Roman, Minoan and Egyptian warm periods and several degrees lower than the majority of the Holocene optimum.” is untestable. Is that the gist?
No, that is not the gist. The claim may be literally untestable in the sense that we do not have a time machine, but the claim can be reasonably surmised.
If you find a proxy that covers all those eras and that can reasonably be considered to imply temperature, then you that proxy to determine relative temperature in a specific location. If you collect a number of reliable proxies from disparate parts of the world and discover that most show e.g. Minoan, Roman, Medieval and Modern warming in order of largest to smallest, then that should be your best estimate of the truth.
Mashing different proxies together in an attempt to come up with a supposed temperature for planet earth is nonsensical. Determining that e.g. the Arctic was warmer in period A than in period B based on a consistent proxy, however, is not, and neither is concluding that a particular area was previously warmer if once there was forest and now there is ice.
“They give us the global average temperature”
Actually they don’t. None of these reconstructions give any reliable information about ocean temperatures on a global basis let alone on a hemisphere basis.
It’s the same reason as why the GAT of today is so useless. Jamming different things together doesn’t give a good “average” at all.
The funny thing is he accepts the ground based network as being global (It isn’t, not by a long shot) but rejects the UAH work despite the fact that it is the closest thing we have to a global measurement.
Whatever data gets him where he wants to go.
I don’t reject UAH. As you can see above I give it equal weight among the other datasets including BEST, HadCRUT, GISTEMP, NOAAGlobalTemp, ERA5, RATPAC, and RSS.
He is adept at concealing his true agenda.
His true agenda seems to shine through clearly via his almost painfully comic devotion to remaining obtuse.
My agenda is to honestly answer the question of whether the Medieval, Roman, Minoan, and Egyptian warm periods are warmer than today. To do that we need to compare the global average temperature as it is today with the global average temperature as it was in the past.
Impossible, the GAT tells you nothing about climate.
CM said: “Impossible, the GAT tells you nothing about climate.”
Then how an MarkW possibly know that Medieval, Roman, Minoan, and Egyptian warm periods were warmer than today?
Simple, there are just a few climate classifications, tell us which one GAT describes.
That’s ridiculous. You don’t need to compare thermometer readings in order to know whether places have become warmer or cooler. Specific temperature differential is an entirely different concept than warming and cooling.
If the Romans were able to plant olive trees all over Europe in places where it is now too cool for olive trees to survive, then you can conclude that those areas are now cooler than they were in Roman times. This conclusion is true regardless of whether you have the foggiest idea of what temperatures were then or are now.
If you take glacier extent as a proxy for temperature and determine that glaciers worldwide were smaller in Roman times than they are today, you can similarly deduce that temperatures were warmer worldwide back then. This deduction also requires no specific knowledge of ancient thermometer readings.
The same thing goes for examining oxygen isotopes and numerous other proxies for temperature. If the question is whether it was warmer two thousand years ago than it is today, then there are numerous indicators that will answer that question for you. None of those necessarily require knowledge of specific temperatures, let alone an average of every single inch of our planet’s 197 million square miles of surface area.
No one seriously cares about the question of precisely how many Celcius degrees the average surface temperature of the earth was on the day that Hannibal crossed the Alps. Even if they did care for some reason, there was no way realistically to guess this average value prior to the satellite era (a fact that didn’t stop people from cranking out bogus unverifiable numbers, of course).
The question of whether the earth was warmer in previous eras is thankfully much easier and more realistic to determine than what a hypothetical thermometer stuck into the earth’s rear end would read. We simply find reasonable temperature proxies in locations all over the world and see what they tell us about relative temperature in those locations. It’s not really that hard to understand, unless you are trying very hard not to.
It is ridiculous to adjudicate the claim that the Medieval, Roman, Minoan, and Egyptian warm periods were warmer than today using the global average temperature?
And I think there is some confusion here. I’m not challenging the use of proxies in determining the global average temperature. In fact, I welcome it. That’s why I’m asking for global average temperature reconstruction; not only is it possible, but they already exist. How else would we determine what it is?
My schtick here so to speak is that the reconstruction be global. If you want to answer the question of whether the planet is warmer back then than today then you need to compare the global average temperature back then to the global average temperature today. It is that simple.
If I were to tell you that the Arctic is currently covered in snow and ice, whereas my backyard is covered in green grass and blooming flowers, would you similarly need me to give you specific thermometer readings or specific temperature values that I guesstimate in order to ascertain that my yard is warmer than the Arctic? If so, then you are probably somewhat challenged by the realities of life.
If, on the other hand, you are capable of understanding that the Arctic is colder based simply on the basis of good natural evidence and without need for made up temperature values, then you could similarly find evidence from all over the world that will inform you about the various ups and downs of temperature and climate in those locations over time. You can then use that information to deduce which periods of history generally had warmer climates and which had cooler.
This is no different than if someone were to magically dig up ancient Roman era thermometers, somehow perfectly preserved in amber from various parts of the world, and then to extrapolate a “global temperature” from those handful of ancient readings. You will come to the same conclusion.
All you need to do to tell whether the past was warmer is to use good proxies to show you whether the past was warmer. You do not need to convert that useful data into bogus pseudo-thermometer data, and nor do you need to extrapolate it into an even more bogus “average temperature” of 200 million square miles of surface area. You simply need to take a reasonable amount of representative and reliable evidence from wherever you can get it in each hemisphere, and then to try not be deliberately obtuse.
It doesn’t have to be a temperature. It can be a binary value indicating the condition C_i = W_i * if(T_older_i > T_newer_i, 1, 0) where C_i is the value of the i’th cell, W_i is the area weighting for that cell, and as long as Σ[Ci, 1, N] > 0 that is acceptable. If you want ‘older’ to be the Roman warm period and ‘newer’ to be today so be it. Just make sure each cell uses the same ‘older’ and ‘newer’ time period and that the cells cover the entire planet.
Please show me the paleo temperature reconstructions made only with empirical data from evenly dispersed cells covering the entire surface of the planet. I assume, incidentally, that each cell will be sufficiently small as to ensure that no one cell will include more than one microclimate, since that would of course yield an incorrect output and force any reasonable person to simply reject the reconstruction out of hand.
I would be especially pleased if you could please provide me with one for the last glacial period. People say that the earth was colder then than it is today, apparently based only on the simple fact that most of it was covered in ice. But I find myself unable to accept that unscientific nonsense and demand to see actual cells covering the whole planet, comprised, of course, only of empirically derived accurate temperatures.
Thanks.
Kaufmann et al. 2020 is an example. Actually, that publication has 5 different reconstructions.
OK, but that is not what I asked for at all.
I asked for reliable temperature data from evenly dispersed cells that could realistically cover the earth’s entire surface, the average temperature of which will supposedly enable us to calculate the globe’s average temperature to a useful degree of precision.
Contrary to your formula above, by the way, there is really no such thing as area weighting of temperature in nature. The surface temperature of Square Mile A is neither more nor less important than the surface temperature of Square Mile B. They average out equally. So it is important that the cells be of equal size and evenly dispersed, or else the precise temperature number we end up with will inevitably be biased toward whichever proxies are most clustered, or alternatively whichever ones we decide to overweight.
It is also important, of course, that the temperature given for each cell accurately represents the true average surface temperature of the area of the cell, which requires that the area onto which we extrapolate a proxy reading be modest. The study you linked to claims to be “globally distributed,” but in reality it is not, as one can clearly see from Fig.6.
The proxies, in fact, come from a total of only 679 sites, which if evenly dispersed over the 197 million square miles of Earth’s surface would result in each proxy representing the temperature of 290,000 surrounding square miles. This by itself would be obviously impossible (obvious assuming a minimum high double digit IQ and sanity), but it is made even more ridiculous by the fact that the sites in the study are not at all evenly dispersed. They are instead rather concentrated.
Moreover, there are only 209 marine sites, which even if perfectly distributed (they aren’t) would result in each proxy representing 670,000 square miles of ocean surface. So whatever value we come to when we derive an “average” from all this, we can be very certain it will not represent a realistic temperature that perfectly describes 197 million squares miles of nature over a 12,000 year time period to a fraction of a degree.
In this context, we have the additional question of of whether the proxies themselves, each of which supposedly provide useful information about hundreds of thousands of square miles of surrounding surface, are in fact giving us realistic temperatures even for the 1sqm on which they rested.
For this question we can skip ahead through all the nonsense about probabilistic ensembles, consensus averages of differing averages of probabilities, etc. to where we simply learn that the temperature uncertainty of the proxies themselves generally ranges from 1.2- 2.9 Celcius degrees, an amount that by itself exceeds the supposed changes in temperature described in the paper.
So we now have limited proxies that can’t possibly give an accurate temperature for the enormous area they are supposed to describe, further find that the proxies can’t accurately be converted into thermometer temperatures at all because they are inaccurate up to 3 degrees, quickly make up a reason to believe that we can harmonize the many different time scales described by different proxies, and then pick a 50 year thermometer record temperature as a baseline for comparison for all of this, even though the proxies themselves generally describe time periods far longer than 50 years, and we then analyze ensembles of this dreck using five different methods, because we have not yet come up with a single method that we can prove generates a correct answer.
But that’s all just a long preamble, because nestled at the end of this we seem to come to the point of the whole exercise, which also coincidentally seems to align perfectly with the agenda that you claim not to have.
Having inanely compared 1000 year averages and 200 year averages of non-thermometer proxies with a 50 year average of spacially disparate thermometer proxies, we are now told that the warmest 1000 and 200 year average periods of the past 12000 years are 0.6C and 0.7C warmer than the last 50 years of the 19th century (and kindly ignore the fact that the instruments used to determine those paleo temperatures are themselves off by 1-3C).
Not content simply to compare an apple with an orange, the authors then insist on comparing an apple to a dead raccoon, informing us further that the past decade averaged a shocking 1C higher than the 50 year average of 1850-1900, and then further comparing that difference to the mere 0.6C difference between the last measured decade and a 1000 year temperature average value found for the Holocene Optimum.
This then, conveniently, brings me right back into my yard, which as we know averaged 68F in the past 100 year period. Last year, the average annual temperature in my yard hit 69.5F, a full 1.5F above the centennial average temperature, which, if we employ the impeccable logic of Climate Science, obviously must mean that last year my yard was hotter than it has been in 100 years.
As if that conclusion were not scary enough, we further find that the average temperature for the month of August was a whopping 83 degrees. I repeat, 83 degrees! In the entire 100 years of annual records of my backyard temperature, not one single year has exceeded an average temperature of 69 degrees, and yet now it is 83F!
So we can see also that August was a full 14 degrees hotter than it has ever been in the past hundred years, again according to the logic of Climate Science.
Thanks to Kaufmann et al. 2020, I can see for a provable fact that I am living in a super special era of wondrous change, the likes of which my backyard has never seen before. I do occasionally wonder, however, whether the misguided scientists of yore would have seen it that way too?
Reacher51 said: “I asked for reliable temperature data from evenly dispersed cells that could realistically cover the earth’s entire surface, the average temperature of which will supposedly enable us to calculate the globe’s average temperature to a useful degree of precision.”
Kaufman et al. 2020 use a grid mesh with 4000 cells of equal area.
Reacher51 said: “So it is important that the cells be of equal size and evenly dispersed, or else the precise temperature number we end up with will inevitably be biased toward whichever proxies are most clustered, or alternatively whichever ones we decide to overweight.”
UAH does not use equal size grid cells. This is why it is important to weight them by the area they cover otherwise you will overweight cells that cover small areas and underweight cells that cover large areas. UAH uses the standard trigonometric weighting for their grids. Using a grid mesh with equal sized cells is not a requirement. In fact, most grid meshes do not utilize equally sized cells. This makes the Kaufman et al. 2020 grid mesh selection uncommon.
Reacher51 said: “The study you linked to claims to be “globally distributed,” but in reality it is not, as one can clearly see from Fig.6.”
It looks well distributed to me. Is it perfect? Nope. Is it more distributed than just looking one or two locations? Yeah…but orders of magnitude.
Reacher51 said: “The proxies, in fact, come from a total of only 679 sites”
Yep. It’s one of the most comprehensive global average temperature reconstructions to date because of the large number of sites and the relative global distribution of them. Don’t hear what I’m not saying. I’m not saying it is perfect. It isn’t. No temperature reconstruction will ever be perfect. But it is far better than the reconstructions that only look at a handful of sites.
Reacher51 said: “For this question we can skip ahead through all the nonsense about probabilistic ensembles, consensus averages of differing averages of probabilities, etc. to where we simply learn that the temperature uncertainty of the proxies themselves generally ranges from 1.2- 2.9 Celcius degrees, an amount that by itself exceeds the supposed changes in temperature described in the paper.”
Remember, the uncertainty of an average is lower than the uncertainty of the individual elements upon which that average is based. The uncertainty depicted in figure 3 is the uncertainty of the global average temperature; not the uncertainty of individual proxies. If you’re interested in how uncertainties combine and propagate through an arbitrary model refer to the Guide to the Expression of Uncertainty in Measurement section 5 and particularly equation 10.
Reacher51 said: “Thanks to Kaufmann et al. 2020”
I just want to make sure it is understood that Kaufman et al. 2020 is one among many global average temperature reconstructions. It is always best to incorporate all other non-egregiously incorrect reconstructions when assessing the point of consilience.
Also note that even though the Kaufman et al. 2020 reconstructions strongly suggest that it is warmer today than the Medieval, Roman, Minoan, and Egyptian warm periods we cannot eliminate the possibility that the Holocene Climate Optimum is was warmer. And that was only 7000 years ago. Some reconstructions go much further back and are quite decisive on the fact that the Earth was warmer in the distant past..like…by a lot.
The number of cells doesn’t matter if you are making up, extrapolating, or assuming the data for most of the cells. 679 locations is what it is.
Also, random error may decrease with an increased number of samples. Instrumental error, however, does not. The average of sh*t is not steak.
I also left out the fact that no one actually knows how accurate any of those proxies really are, since there were no ancient thermometers operating continuously in the same spot for a thousand years during the Holocene against which to check that claim. So those numbers are at best an informed guess, and moreover the time resolutions between proxies aren’t identical, leading to yet more made up formulas for how to supposedly turn apples and oranges into applorange. Since there is no knowable correct answer against which to check any of these things, the exercise turns into a giant Ouija game in which people inevitably come to exactly the conclusion they were subconciously hoping to come to.
As for what it all represents, the ocean is 70% of the earth’s surface, and there are only 209 proxies measuring its history. If you were to randomly move each of those 209 marine proxies 500 or 1000 miles from where they were, what would the result be? Presumably you could easily end up with an average temperature e.g. 1C lower than what was found in the current spots, which in turn would entirely change the supposed historical surface temperature record which you seem to believe can somehow be compared to crappy bucket data, engine intake data, and Argo floats, all of which were located in entirely different patches of sea, and all of which will give you any output you want if you extrapolate their readings to empty “cells,” cook up formulas for how to weight those fictitious readings, etc. It’s all still garbage.
As for the actual studies which underlie this particular paper, I was too lazy to get into it, but the 679 proxies are really not as magnificent as you seem to think. Steve McIntyre has a wealth of posts describing in great detail the egregious cherry picking and utter misuse of proxies in Pages2K, as well as by Marcott, Shakun, and most certainly Mann. They are well worth reading, because not only is the Kaufmann study a jumble of assumptions and mixing of data of different fruits, but the entire edifice of proxy measurements on which it all rests also turns out to be a fairly large pile of doo doo.
Here are some McIntyre posts on Pages2k, which he has been picking apart for years. You can find similar commentary on Marcott, Mann, etc. proxies simply by searching within the site:
https://climateaudit.org/?s=pages2k
Reacher51 said: “The number of cells doesn’t matter if you are making up, extrapolating, or assuming the data for most of the cells.”
And yet that’s exactly what UAH does and nobody seems to have an issue with it.
Reacher51 said: “Here are some McIntyre posts on Pages2k, which he has been picking apart for years. “
Yeah, PAGES2K has problems. They all do. None of them are perfect and none them will ever be perfect. There will always be reasons for McIntyre to “nuh-uh” them.
Ask McIntyre to do what every other scientists does…provide a better alternative to PAGES2K so that we can all see just how bad the problems he insists are there bias the PAGES2K result.
You can plainly see how bad the problems are simply by reading McIntyre. He lays it out very clearly. There is no need to wait for him to engage in a bogus exercise of giving a value for the Earth’s hypothetical rectal thermometer in 9022 BC.
The problems with PAGES2K are numerous, clearly explained, and much more than simply being less than perfect. It’s all there already for anyone who cares to understand it.
Reacher51 said: “You can plainly see how bad the problems are simply by reading McIntyre.”
No. I can’t. He doesn’t provide what he thinks is the corrected result so that we can do the subtraction PAGES2K_biased – PAGES2K_corrected to see just how bad those problems are. What if PAGES2K_biased has a RMSE of 0.1 K (or less) vs PAGES2K_corrected? Does that mean PAGES2K_biased was incapable of providing a useful picture of the global average temperature?
Let me give you a concrete example that nobody rejects. Classical mechanics says F=m*a. Relativistic mechanics says there is a problem with this because the m is actually the relativistic mass m_r = m * sqrt[1-(v/c)^2] [*]. It’s just that F_biased isn’t that different from F_corrected when v is low so we all just say “meh” and conclude that for most use cases it doesn’t make material difference. My point is that in the same way if PAGES2K_biased isn’t that different from PAGES2K_corrected then we’re all going to say “meh” and conclude that for most use cases it doesn’t make a material difference.
That’s why scientists tend to scoff at arguments that do not quantify the problems enumerated. I call these “nuh-uh” arguments. They are not very convincing. Don’t hear what I’m not saying. I’m not saying they aren’t legitimate. I’m saying that in lieu of a quantification we don’t know if the existing evidence is biased at all. Remember scientific knowledge is based on the best available evidence and is never perfect. If you don’t present a better alternative then you haven’t followed through on expanding the knowledge base.
[*] F = m_r*a isn’t actually correct either. But that is detail not worth discussing at the moment. This rabbit hole gets real deep real fast.
A much more apt analogy would be deciding whether to move into an apartment building in Miami after discovering that, contrary to the plans submitted to the town, the builders never actually put in a foundation, and the “steel rebar” turns out to have been made of compressed cardboard.
Coming up with excuses not to see the pathetic mess of bad data and statistics in PAGES2K, Shakun, etc., is not impressive. If you have a genuine interest in learning about the natural world, then you should read what McIntyre has to say and consider it. If you are simply looking for excuses not to have to engage with anything that makes your tribe look stupid, then you are wasting everyone’s time.
Only in your Alice in Wonderland fantasyland.
Rest of your BS ignored.
He thinks the average uncertainty is the uncertainty of the average. He’s never constructed a beam to span a gap. In his world view if you use multiple tiny 2″x4″ boards you can reduce the uncertainty by dividing by the number of tiny boards you use.
If you cut a 2″x4″x8′ board into one inch chunks and glue them all together your uncertainty of the total will somehow be less than the uncertainty of the standalone 8′ board!
TG said: “He thinks the average uncertainty is the uncertainty of the average.”
Nope.
The average uncertainty is Σ[u(x_i), 1, N] / N.
The uncertainty of the average sqrt[Σ[(1/N)^2 * u(x_i)^2, 1, N]].
Refer to the GUM section 5 equation 10.
TG said: “If you cut a 2″x4″x8′ board into one inch chunks and glue them all together your uncertainty of the total will somehow be less than the uncertainty of the standalone 8′ board!”
Nope.
And I see you’re back to conflating sums with averages. They are not the same thing.
Let’s review. Let X be a set of N numbers.
sum(X) = Σ[X_i, 1, N]
avg(X) = Σ[X_i, 1, N] / N
Do you see the difference?
You need to show where this equation
Σ[u(x_i), 1, N] / N.
is in the GUM.
I have attached a screen shot of the version I have. I could not find your equation anywhere in the GUM. Please show a screen shot of your reference.
You also should provide references as to how an “average” or statistical mean is considered a function that provides a measurement.
The GUM expects a function to be something like an equation that allows calculating the volume of a cylinder by using a combination of other physical measurements. See Section 4.1.
The only time a mean provides a meaningful value is when you are measuring the same thing, multiple times, with the same device, and errors are random. Then, the mean of the measurements can be assumed to be the true value. However, the uncertainty is best described by the standard deviation in this case so you also know the range of values that were measured.
Here is reference from a different JCGM, Part 6. Please note a simple average is not a scientific law or a relationship known to hold true. You need to learn more about measurements, what they are and are not. Statistics parameters like averages are not measurements and do not fall under how uncertainties can be propagated.
I don’t mind extending this discussion but before we go any further we have to agree on what sums and averages are. If I cannot convince you that sum(X) = Σ[X_i, 1, N] and avg(X) = Σ[X_i, 1, N] / N then there’s no way I’m going to be able to convince you that the formulas in Taylor, Bennington, the GUM, etc. are correct.
Do you understand what a sum is? Do you understand what an average is? Do you understand that your 2x4x8 board example is one in which you invoked a sum as opposed to an average?
I’m not trying to be patronizing here. It’s just that this conflation of sums and averages is a repeated occurrence not just in conservations with me, but with Bellman as well. At this point I have no choice but to think you don’t fully understand what those terms mean. So let’s talk about what sums and averages are before we go any further.
The irony is overwhelming.
“we go any further we have to agree on what sums and averages are. If I cannot convince you that sum(X) = Σ[X_i, 1, N] and avg(X) = Σ[X_i, 1, N] / N then there’s no way I’m going to be able to convince you that the formulas in Taylor, Bennington, the GUM, etc. are correct.”
The average uncertainty, avg(X) = Σ[X_i, 1, N] / N, is basically useless. That is the *AVERAGE uncertainty. It’s only use is to distribute the total uncertainty evenly across all data elements thus masking the actual individual uncertainties. It is *NOT* the uncertainty of the average!
In your sum, sum(X) = Σ[X_i, 1, N] , if X is the uncertainty then the total uncertainty propagated to the mean is this equation, not avg(X).
The average uncertainty is *NOT* the uncertainty of the mean!
“At this point I have no choice but to think you don’t fully understand what those terms mean.”
The only one that doesn’t seem to understand is you. The average uncertainty is *NOT* the uncertainty of the mean! Yet that is what you continue to advocate.
Can you explain how Variance_total = V1 + V2 for independent, random variables is somehow not true? That Variance_total = (V1 + V2)/2 is what the true variance should somehow be? Can you explain how so many statistic textbooks have it wrong?
Can you explain how variance of an independent, random variable is not somehow related to the uncertainty of that independent, random variable?
If you can’t explain these questions then it is *YOU* that doesn’t understand the difference between total uncertainty and average uncertainty.
The X in sum(X) = Σ[X_i, 1, N] and avg(X) = Σ[X_i, 1, N] / N is not uncertainty. It is just the sample of values. The uncertainty of those functions is u(sum(X)) and u(avg(X)). We are not talking about the uncertainty u yet. Do you understand the difference between sum(X) and avg(X)? Do you understand that they yield different values for the same sample X?
I don’t think you understand what they mean in terms of MEASUREMENTS.
Explain what an average is without a variance. What does it represent? Does it have any meaning?
Can you run an experiment 10 times, find the average and report the average without at least a standard deviation? Does your experiment resolve anything without knowing the standard deviation if not the uncertainty also?
Why do you quote absolute temperature means from a temperature database without also quoting the variance/standard deviation?
How does converting a stations record to an anomaly affect the variance?
Is the variance of each random variable (station) added to each other random variable?
Do you propagate the variances as you continue to average (combine) station random variables? Show us some of those calculations?
Read these links. Before you respond.
Data Do Not Have Means: Or, The Deadly Sin of Reification Strikes Again! – William M. Briggs (wmbriggs.com)
Averages and Aggregates | Mises Institute
Here is a comment Briggs made on the above post. It is very applicable to the differences between mathematicians and engineers.
Mucking around with temperatures and trying to find “trends” and correlations is ignoring the causes of temperatures and is really mental masturbation for all the good it will do.
Why do you think engineers especially consider your obsession with temperature trends, especially the GAT to be inaccurate AND meaningless?
“sum(X) = Σ[X_i, 1, N]
avg(X) = Σ[X_i, 1, N] / N”
So what? What exactly does the avg(X) tell you?
avg(X) (if X is uncertainty) only spreads the total uncertainty over all members of the data set. It does *NOT* calculate the uncertainty of the mean!
If X is the stated value of a measurement, then avg(X) only spreads a single value of length across all members of the data set. It doesn’t mean that each element is avg(X) in length.
if Total = x_1 + x_2 + … +x_N
then
ẟtotal = ẟx_1 + ẟx_2 + … + ẟx_N + ẟN)
Since N is a constant ẟN is zero.
It is *total* uncertainty that is of use in the real world, not a hokey average uncertainty that masks the individual uncertainty of the individual random, independent uncertainties.
If you just pick ONE board out of a pile of random, independent boards of different lengths and with random, independent uncertainties just what is the probability that you will get one that exactly matches the average length and average uncertainty?
TG said: “So what? What exactly does the avg(X) tell you?”
It tells you Σ[X_i, 1, N] / N. Literally and exactly.
Do you understand that sum(X) = Σ[X_i, 1, N] / N is different from avg(X) = Σ[X_i, 1, N]? Do you understand that sum(X) is different from avg(X) when X is a sample board lengths, areas, or whatever other scenarios you’ve conjured?
We can’t even begin to discuss the uncertainty of sum(X) or avg(X) until you first understand what sum(X) and avg(X) themselves are.
He obviously understands the concept of average perfectly well and is trying to make a more interesting and relevant point. You are being deliberately obtuse.
Reacher51 said: “He obviously understands the concept of average perfectly well and is trying to make a more interesting and relevant point.”
I genuinely don’t think he does. He repeatedly conflates the concepts of sums and averages. This has been going on for months. And it’s not just in conservations with me. He does it with Bellman as well.
Here is example. I’ll be discussing the uncertainty of the average and then he’ll say “If you cut a 2″x4″x8′ board into one inch chunks and glue them all together your uncertainty of the total will somehow be less than the uncertainty of the standalone 8′ board!” which is an example involving a sum; not an average.
BTW…the uncertainty of a sum is more than the uncertainty of the individual elements upon which the sum is calculated while the uncertainty of the average is less than the uncertainty of the individual elements upon which the average is calculated.
Let’s see.
It is *YOU* that thinks Σ[X_i, 1, N] / N is a sum of the lengths of X_i.
It is *YOU* that thinks Σ[X_i, 1, N] is the average length of X_i.
And you think it is others that don’t understand sums and averages?
“ I’ll be discussing the uncertainty of the average and then he’ll say “If you cut a 2″x4″x8′ board into one inch chunks and glue them all together your uncertainty of the total will somehow be less than the uncertainty of the standalone 8′ board!” which is an example involving a sum; not an average.”
You keep stating that the more data elements you have, i.e. N, the less uncertainty you have! So if you cut the board into chunks then N goes up and the uncertainty should go down!
You apparently can’t even get this straight.
“BTW…the uncertainty of a sum is more than the uncertainty of the individual elements upon which the sum is calculated while the uncertainty of the average is less than the uncertainty of the individual elements upon which the average is calculated.”
The uncertainty of the average is *NOT* less than the uncertainty of the data elements. The AVERAGE uncertainty may be less but even that is not guaranteed! If you have just two data points, one with an uncertainty of 1 and the other with an uncertainty of 9 then the average uncertainty is 5. But 9 is *NOT* less than 5!
And the uncertainty of the average is 10, not 5. Whether you directly add the uncertainties and get 10 or you do a root-sum-square sqrt (1^2 + 9^2) > 9 you get a total uncertainty greater than the uncertainty of either data element alone.
You just can’t help showing how little you know, can you?
TG said: “It is *YOU* that thinks Σ[X_i, 1, N] / N is a sum of the lengths of X_i”
Nope. The sum is Σ[X_i, 1, N].
TG said: “It is *YOU* that thinks Σ[X_i, 1, N] is the average length of X_i.”
Nope. The average is Σ[X_i, 1, N] / N.
TG said: “You keep stating that the more data elements you have, i.e. N, the less uncertainty you have! So if you cut the board into chunks then N goes up and the uncertainty should go down!”
For an average…AVERAGE.
Your example of laying boards end-to-end is an example of a sum…SUM.
Do you understand why laying boards end-to-end and adding up their individual lengths is a SUM operation? If you don’t understand why that is a SUM and not an AVERAGE then ask questions.
TG said: “The uncertainty of the average is *NOT* less than the uncertainty of the data elements.”
Yes. It is. Refer to GUM equation 10.
TG said: “The AVERAGE uncertainty may be less but even that is not guaranteed!”
We are talking about the uncertainty of the average; not the average uncertainty which is has no functional utility.
TG said: “And the uncertainty of the average is 10, not 5″
Patently False. The uncertainty of the average of two elements with ±1 and ±9 individual uncertainty is ±4.53. Use the NIST uncertainty machine to verify this if you wish.
Same old idiocy, ready to be rehashed next month ad nauseum.
“For an average…AVERAGE.”
I keep asking what use the average value is, be it for the stated values or for the uncertainty. I *never* get a coherent answer.
Especially with measurements of different things using different devices there is no guarantee that *any* of the data values will match either the mean or the average uncertainty. The is even *more* true for multi-nodal things like temperature!
Calculating these average values are nothing more than mental masturbation. I guess is not surprising that you and bellman are so enamored of them!
Yes. It is. Refer to GUM equation 10.”
The AVERAGE uncertainty can be less than *some* of the individual uncertainties. The uncertainty of the average can’t be. The average of the stated values is the sum of the stated values divided by the number of elements. The uncertainty of the average of the stated values is totally driven by the uncertainty of the sum of the stated values since the number of elements is a constant and cannot contribute to the uncertainty of the average!
The average uncertainty, on the other hand is the sum of the uncertainties divided by the number of elements.
The uncertainty of the average is *NOT* the same thing as the average uncertainty. And the average uncertainty is not the uncertainty of the mean!
But you and bellman are in good company (snicker) since you believe as most climate scientists do. They have no understanding of reality either.
I admit that this is not my field, but as far as I can see there are many different types of uncertainty that arise for entirely different reasons.
In a case in which uncertainty arises from e.g. random, unbiased fluctuation of a measuring instrument, then averaging out an increasingly large number of samples will decrease the uncertainty of the correct underlying value.
However, in a case in which uncertainty arises because nobody actually has a solid understanding of what the correct underlying value really should be, then increasing samples does nothing to reduce that uncertainty.
The example equation 10 you give would seem to apply to the former, whereas the numerous uncertainty problems of paleo proxy temperatures would seem to apply to the latter.
Reacher51 said: “In a case in which uncertainty arises from e.g. random, unbiased fluctuation of a measuring instrument, then averaging out an increasingly large number of samples will decrease the uncertainty of the correct underlying value.”
To be pedantic the uncertainty of the average decreases with an increasing number of elements in the sample.
It is important to note that the uncertainty of the individual elements remains the same.
And the uncertainty of the correct underlying value is by definition zero.
I think this is actually the concept you meant to type. It just came out weird. Is that right?
To be pedantic, this was and remains, bullshit.
No, I am trying to express to you that the main uncertainties in climate proxy temperature measurements are systematic and not definitively known, whereas the equation you keep referring to from the GUM seems to assume that systematic error has been already dealt with and that the uncertainties of each value are essentially random and can be dealt with in a standard statistical manner. So in the case of most paleo proxy measurements, which attempt to estimate a specific temperature against a background of a multitude of other factors, including uncertain time periods, and without a truly reliable method of calibration, it is not the case that the uncertainty of the average decreases with an increasing number of elements in the sample. That principle does not apply in this case.
To that last point, I refer you to an ISO guide on the GUM:
3.4.8 Although this Guide provides a framework for assessing uncertainty, it cannot substitute for critical thinking, intellectual honesty and professional skill. The evaluation of uncertainty is neither a routine task nor a purely mathematical one; it depends on detailed knowledge of the nature of the measure and of the measurement. The quality and utility of the uncertainty quoted for the result of a measurement therefore ultimately depend on the understanding, critical analysis, and integrity of those who contribute to the assignment of its value.
Equation 10 from the GUM is for uncorrelated random errors. If there is a systematic error the GUM advises including corrections or correction factors as an input to the function that computes that combination of measurements. In this way the effect of the adjustments can be included in the uncertainty of the combination. Here is what the GUM says about adjustments (corrections and correction factors).
This is actually one of the reasons (there are others) that you see temperatures expressed in anomaly terms as opposed to absolute terms. The use of anomalies cancels out one form of systematic error and does so in a way in which you don’t even need to know the magnitude of the error and does not contribute anything to the uncertainty of the function f (the combining function) since the partial derivate of the function f wrt to the adjustment ∂f/∂A is always 0 regardless of the magnitude of the adjustment A.
BTW #1…there are a few posters here that reject GUM equation 10 (and equivalent formulations from Taylor, Bennington, NIST, etc.) and its implications especially in regards to the case when the function f is f = avg(X) = Σ[X_i, 1, N] / N since it says u(f) = u(X) / sqrt(N) where u(X) is the same individual uncertainty of all elements in X. In fact, most of the discussion with Bellman in this very article is related to this rejection of established statistical and uncertainty analysis techniques. Bellman has the patience of Job in trying to explain this to them.
Watch…it is possible that one of them will “nuh-uh” this very post. I’ll then derive the uncertainty of the average from GUM equation 10 or whichever formulation they prefer whether it be from Taylor, Bennington, etc. and then they’ll “nuh-uh” the derivation once they see it doesn’t give them the answer they want.
BTW #2…UAH actually uses propagation of uncertainty techniques consistent with the GUM in their publication Christy et al. 2003 specifically in regards to the uncertainty of the average which they assess as u(avg) = u(element) / sqrt(N) just like everyone else in every other discipline of science.
As far as I can tell, the +\- 1-3C for the various proxies in Kauffman do not primarily refer to random error, and consequently the uncertainty of the average of the samples is in no way reduced by increasing sample size.
Reacher51 said: “As far as I can tell, the +\- 1-3C for the various proxies in Kauffman do not primarily refer to random error, and consequently the uncertainty of the average of the samples is in no way reduced by increasing sample size.”
If the each proxy was affected by the same systematic error then Kaufman et al. would have corrected the bias. If each one has its own unquantified and independent error then when all of them aggregated those errors will distribute randomly. It’s only when all proxies are contaminated by the same error that they become systematic.
“ If each one has its own unquantified and independent error then when all of them aggregated those errors will distribute randomly.”
More unadulterated BS!
This is *ONLY* true for multiple measurements of the same thing using the same device!
If you use different devices or are measuring different things, (i.e. different proxies) then you simply can *NOT* assume the errors will distribute randomly!
Can you prove that multiple measurements of different things using different devices *always* generate random errors which cancel? If you can’t prove it then you can’t just assume it!
Exactly what I thought.
This is handwaving bullshit, what you want and need to be true.
Have you told Christy yet that he can reach impressively small uncertainty values just by increasing the number of points?
1mK, here they come!
“This is actually one of the reasons (there are others) that you see temperatures expressed in anomaly terms as opposed to absolute terms. The use of anomalies cancels out one form of systematic error and does so in a way in which you don’t even need to know the magnitude of the error and does not contribute anything to the uncertainty of the function f (the combining function) since the partial derivate of the function f wrt to the adjustment ∂f/∂A is always 0 regardless of the magnitude of the adjustment A.”
This is total, unadulterated BS.
Let’s progress through the typical procedure for getting anomalies.
If you follow all that uncertainty through all the steps the uncertainty just grows and grows and grows. It becomes larger than the absolute value of the anomaly meaning you have absolutely no idea if that anomaly is anywhere near being accurate. The uncertainty of that anomaly just overwhelms what you are trying to identify.
That’s the major reason the Global Average Temperature calculated from the surface record is just so useless.
Please note that this is the uncertainty for just ONE measuring station! When you have hundreds of measuring stations the uncertainty becomes even larger with every station you add! ẟstation1 + ẟstation2 + … + ẟstation_n
TG said: “This is total, unadulterated BS.”
It is absolutely correct and can be proved with middle school level math.
Let T be the true temperature, B be a systematic bias, and M be the measured value, and A is an anomaly.
M1 = T1 + B
M2 = T2 + B
A = M2 – M1 = (T2 + B) – (T1 + B) = T2 – T1
Notice that B completely cancels out.
Now let X be a set of A values and f = avg(X) = Σ[A_i, 1, N] / N.
f = Σ[A_i, 1, N] / N
f = Σ[M2_i – M1_i 1, N] / N
f = Σ[(T2_i + B) – (T1_i + B), 1, N] / N
Therefore…
∂f/∂B = 0
In other words, it does not matter what B is because ∂f/∂B = 0 always thus the magnitude of B does not contribute anything to the uncertainty.
TG said: “1. Find the mid-range daily temp. (Tmax -Tmin)/2. The uncertainty of that mid-range temperature is ẟTmid = ẟTmax + ẟTmin.”
Wrong. The uncertainty of q = (Tmax -Tmin)/2 is ẟq = sqrt[(1/2)^2 * ẟTmax^2 + (1/2)^2 * ẟTmin]. This can be confirmed with the NIST uncertainty machine. Don’t just “nuh-uh” it. Do it. Prove this for yourself.
Idjit—how do you know they aren’t changing over time?
More importantly, how do you know that B = B?
Hint: you don’t and can’t.
CM said: “More importantly, how do you know that B = B?”
The same reason I know 1 = 1 or e = e or sqrt(N) = sqrt(N). It is self evident.
IT IS NOT A CONSTANT!
This is why you are hopelessly lost, trying pontificate on a subject about which you are in abject poverty.
If you had ANY metrology experience you might have a hope, but you are stranded in the middle of the Mojave desert without a map.
CM said: “IT IS NOT A CONSTANT!”
What is not constant?
Read the attached screen shot of Taylor description of how to handle products and quotients. The fact that the numerator is addition or multiplication is not an issue.
However, division, as you can see is done by ADDING a fractional uncertainty to the remaining uncertainties.
Lets assume we have one item in the denominator and that it is a constant. Let’s call it “u”.
You need to convince yourself that:
δq / |q| = (δx / |x|) + (δy / |y| + (δu / |u|)
and that this represents what Dr. Taylor shows. You also need to convince yourself that δu of a constant |u| = 0, so that you end up with:
δq / |q| = (δx / |x|) + (δy / |y| + … + (0 / |u|) which gives
δq / |q| = (δx / |x|) + (δy / |y| + …+ 0
In other words, dividing by a constant has no effect on the total uncertainty.
If you have a problem with this, maybe you should take up the issue with Dr. Taylor and have him add an addendum to his book.
We really need to pool these discussions. I see you are making exactly the same mistake Tim makes.
“Wrong. The uncertainty of q = (Tmax -Tmin)/2 is ẟq = sqrt[(1/2)^2 * ẟTmax^2 + (1/2)^2 * ẟTmin].”
Nope. Look at Taylor 3.18 again.
If q = x/w where w is a constant then
ẟq/q = ẟx/x + ẟw/w ==> ẟq/q = ẟx/x
The constant falls out of the uncertainty equation because it is zero.
Once again, YOU ARE CALCULATING AVERAGE UNCERTAINTY, not uncertainty of the average!
It is total uncertainty that get propagated forward in an uncertainty analysis, not the average uncertainty!
It’s like just picking one individual element in the data set at random and saying this is the uncertainty I am going to propagate forward and to heck with all the rest! That’s what the average uncertainty does. It spreads that one value across all the data elements and you then want to pick that one value as the total uncertainty of the entire data set.
Physically it’s like picking one board out of a pile from different mills and different batch runs and saying this is the total uncertainty I’m going to use when building a beam from several boards taken out of the pile.
The average uncertainty is simply useless in the real world when you are using different things measured by different devices. If there is systematic uncertainty in the measuring device then the average uncertainty won’t give an accurate answer even when measuring the same thing using the same device.
TG said: “Nope. Look at Taylor 3.18 again.”
Let’s do it together.
(a) Let X be a set of measurements
(b) Let δx be the uncertainty for every x_i in X
(c) Let q1 = sum(X) = Σ[x_i, 1, N]
(d) Let q2 = avg(X) = sum(X) / N = q1 / N
(e) Note that δN = 0
(f) Note that δ(sum(X)) = δq1
(g) Note that δ(avg(X)) = δq2
For q1 we use Taylor 3.16.
(1) δq1 = sqrt[ Σ[δx_i^2, 1, N] ] using Taylor 3.16
(2) δq1 = sqrt[ Σ[δx^2, 1, N] ] using (b)
(3) δq1 = sqrt[ δx^2 * N ]
(4) δq1 = δx * sqrt(N)
For q2 we use Taylor 3.18.
(5) δq2 / q2 = sqrt[ (δq1^2/q1)^2 + (δN/N)^2 ] using Taylor 3.18
(6) δq2 / q2 = sqrt[ (δq1^2/q1)^2 + 0 ] using (e)
(7) δq2 / q2 = δq1 / q1
(8) δq2 = δq1 / q1 * q2
(9) δq2 = δq1 / q1 * (q1 / N) using (d)
(10) δq2 = δq1 / q1 * (q1 / N)
(11) δq2 = δq1 / N
(12) δq2 = (δx * sqrt(N)) / N using (4)
(13) δq2 = δx / sqrt(N) using the radical rule
(14) δ(avg(X)) = δq2 = δx / sqrt(N)
Notice that I calculated the uncertainty of the average δ(avg(X)) and not the average uncertainty Σ[δx_i, 1, N] / N.
Don’t just “nuh-uh” Taylor 3.18 here. Follow each step 1-14 one by one. Do it yourself. Don’t make any arithmetic mistakes and prove this for yourself. If you have a question about a particular step ask.
“ Let q2 = avg(X) = sum(X) / N = q1 / N”
You are *still* calculating the AVERAGE UNCERTAINTY!
” δq1 = sqrt[ δx^2 * N ]”
You are assuming all uncertainties are equal! How do you justify that assumption?
“Let δx be the uncertainty for every x_i in X”
It’s the same for this – the same uncertainty for everything.
Let’s say you are working in a machine shop and your current project is rebuilding a 350 cu in small block engine. Do you :
Now, let’s say you are a journeyman carpenter charged with building roof trusses for the roof of a new house. Do you measure the stated value +/- uncertainty of all the boards you have, find the average stated value and average uncertainty and then assume all the boards are of average length and uncertainty when you start building the trusses?
Let’s do this with your equations:
(a) Let X be a set of measurements
(b) Let ẟx_i be the uncertainty for each individual element.
(c) Let q1 = sum(X) = Σ[x_i, 1, N]
(d) Let q2 = avg(X) = sum(X) / N = q1 / N
ẟq1 = ẟx_1 + ẟx_2 + … + ẟx_N + ẟN ==>
ẟq1 = ẟx_1 + ẟx_2 + … + ẟx_N
Now, using direct addition instead of root-sum-square to lessen confusion:
ẟq2/q2 = ẟx_1/x_1 + ẟx_2/x_2 + … + ẟx_N/x_N + ẟN/N ==<
ẟq2/q2 = ẟx_1/x_1 + ẟx_2/x_2 + … + ẟx_N/x_N
Now, multiply each term by q2 and then substitute
(x_1 + x_2 + … + x_N)/N into each term.
Ex: (ẟx_1/x_1)((x_1 + x_2 + … + x_N)/N) +
(ẟx_2/x_2) ((x_1 + x_2 + … + x_N)/N) +
–
–
Factor out the N and you get a mess divided by N -> the average uncertainty!
Agian, you can run but you can’t hide. You ae calculating the average uncertainty – which is useless!
bdgwx said: “Let q2 = avg(X) = sum(X) / N = q1 / N”
TG said: “You are *still* calculating the AVERAGE UNCERTAINTY!”
Please tell me this a typo.
q2 is not even an uncertainty let alone the average uncertainty.
TG said: “(c) Let q1 = sum(X) = Σ[x_i, 1, N]”
TG said: “ẟq1 = ẟx_1 + ẟx_2 + … + ẟx_N + ẟN”
I’m going to stop you right here. Which equation from Taylor are you using here?
“bdgwx said: “Let q2 = avg(X) = sum(X) / N = q1 / N”
TG said: “You are *still* calculating the AVERAGE UNCERTAINTY!”
bdgwx: Please tell me this a typo.
*YOU* labeled the equation as avg(X), not me! No typo from me!
“q2 is not even an uncertainty let alone the average uncertainty.”
q2 *is* an average.
ẟq2 *is* the average uncertainty!
You can run but you can’t hide!
I’ve given you this multiple times! 3.4, 3.8, 3.16, 3.17, 3.18, 3.47. 3.48
In none of these is the average uncertainty calculated, i.e. ẟq2 or avg(X) (which ever you want to use).
The total uncertainty is the uncertainty of the average, not the average uncertainty.
I note that you didn’t address a single one of the issues I brought up about using average uncertainty in rebuilding an engine! Is the subject too hard for you? Or are you just not willing to admit that using the average uncertainty is useless in the real world? Why are you always avoid addressing real world issues?
Where would *you* use the average uncertainty in the real world? Be specific.
TG said: “*YOU* labeled the equation as avg(X), not me! No typo from me!”
I did label it as avg(X). Notice that I did not label it as avg(ẟX) or even ẟavg(X).
avg(X) is not either the uncertainty of the average nor the average uncertainty. It’s not even an uncertainty!
Do you understand that avg(X) is not avg(ẟX) or ẟavg(X)? Do you notice the presence and location of the ẟ symbol here?
TG said: “ẟq2 *is* the average uncertainty!”
No it isn’t. Using Taylor’s notation ẟ means uncertainty-of. So ẟq2 is the uncertainty of q2. q2 is the average so ẟq2 is the uncertainty of the average. If you need parenthesis to help you out that is ẟq2 = ẟ(q2) = ẟ(avg(X)) = ẟ(Σ[x_i, 1, N] / N).
TG said: “TG said: “(c) Let q1 = sum(X) = Σ[x_i, 1, N]”
TG said: “ẟq1 = ẟx_1 + ẟx_2 + … + ẟx_N + ẟN””
Now let’s get back to this. What equation from Taylor are you using here? How does your ẟq1 follow from q1 here?
I’ve said this before but I’ll say it again and maybe it will sink in. A mean/average is a statistical parameter calculated from a distribution of data points. Other statistical parameters are variance, standard deviation, mode, median, quartiles, kurtosis, and skewness.
None of these can be considered a physical value calculated from a defined functional relationship. A functional relationship as dealt with in both Dr. Taylor’s book and the GUM is a defined functional relationship that is used to develop another physical measurement value. Functional relationships that are like [ PV = nRT, pi r^2, velocity = D/T, A = L*W, etc.]
There is only one use of a mean in metrology, to obtain a true value. But even that has some serious conditions attached to it. Multiple measurements of a single thing, with the same device. Even then, the distribution must be Gaussian (normal), with kurtosis and skewness = 0. This seldom occurs which says the mean has error (different from uncertainty) built in.
The mean of a series of data, be it temperatures or weights or classes, is NOT a physical measurement determined from a functional relationship. The best one can say is that an average/mean is found by using a mathematical definition and describes the central tendency of a series of data. That definition must be used along with the other statistical parameters of the series, especially variance, to evaluate the distribution. If the skewness and kurtosis are not equal to zero, the median or mode may be a better description of the central tendency.
It is basically useless to argue about the average uncertainty because it is not a description of a physical quantity. It is one reason the standard deviation is a better descriptor of a set of temperature data than trying to calculate the error of medians to averages of medians all the way through to a GAT median average.
I for one will not argue about the uncertainty further. However, I will insist that when one quotes a value, that it be named properly, i.e., median, and that a standard deviation of the data series used to calculate an “average” also be quoted. The SEM is not the proper statistic to use for describing a mean, only the population standard deviation is the correct statistic.
“Do you understand that avg(X) is not avg(ẟX) or ẟavg(X)? Do you notice the presence and location of the ẟ symbol here?”
When you define your function as the average value and then find the uncertainty of that function you are finding the average uncertainty.
You can try to cover that up with word salad if you like but you aren’t fooling anyone!
*you* defined ẟq2, not me:
Let q2 = avg(X) = sum(X) / N = q1 / N
δq2 / q2 = sqrt[ (δq1^2/q1)^2 + (δN/N)^2 ]
Did you forget?
“BTW #1…there are a few posters here that reject GUM equation 10 (and equivalent formulations from Taylor, Bennington, NIST, etc.) and its implications especially in regards to the case when the function f is f = avg(X) = Σ[X_i, 1, N] / N since it says u(f) = u(X) / sqrt(N) where u(X) is the same individual uncertainty of all elements in X.”
More unadulterated BS.
First, this is *NOT* equation 10. See attached. Eqn 10 has nothing in it about dividing by sqrt(n).
This *ONLY APPLIES* when your measurements are of the *SAME THING* and you only have a few measurments. Then you can assume a students T-distribution. That means a *normal distribution* of error around the mean.
You *NEED* to show that the data set made up of temperature measurements that are measures of different things using different devices create a students T-distribution before you can apply this equation!
You’ll never be able to show this as being true – because it isn’t!
For temperature the GUM equation 10 is the controlling equation from the GUM:
He’s definitely on a roll today.
TG said: “More unadulterated BS.
First, this is *NOT* equation 10. See attached. Eqn 10 has nothing in it about dividing by sqrt(n).”
Here we go again. Let’s walk through this step by step.
(a) GUM 10 is u_c^2(y) = Σ[(∂f/∂x_i)^2 * u^2(x_i), 1, N]
(b) Let y = f = avg(x) = Σ[x_i, 1, N] / N.
(c) Let u^2(X) = u^2(x_i) for all x_i
(d) Note that ∂f/∂x_i = 1/N for all x_i
Now we begin…
(1) u_c^2(y) = Σ[(∂f/∂x_i)^2 * u^2(x_i), 1, N]
(2) u_c^2(y) = Σ[(1/N)^2 * u^2(X), 1, N]
(3) u_c^2(y) = [(1/N)^2 * u^2(X)] * N
(4) u_c^2(y) = 1/N^2 * u^2(X) * N
(5) u_c^2(y) = N/N^2 * u^2(X)
(6) u_c^2(y) = u^2(X) * 1/N
(7) u_c(y) = sqrt[u^2(X) * 1/N]
(8) u_c(y) = u(X) / sqrt(N)
Go through this step-by-step. Don’t just “nuh-uh” it. Do it! Prove this for yourself.
TG said: “This *ONLY APPLIES* when your measurements are of the *SAME THING*”
Patently False. Throughout much of the GUM the combination y using function f is not only for measurements of different things, but measurements of completely different types with completely different units or in some cases no units at all. Your “SAME THING” requirement is completely made up.
TG said: “You *NEED* to show that the data set made up of temperature measurements that are measures of different things using different devices create a students T-distribution before you can apply this equation!”
Patently False. GUM equation 10 works for any distribution. The only requirement is that the uncertainty u be “standard” mean expressed as a standard deviation. Don’t believe me? Read the GUM, verify it with the NIST uncertainty machine, etc. Just don’t unilaterally make up requirements that don’t exist because the result does not agree with your preconceived position.
TG said: “You’ll never be able to show this as being true – because it isn’t!”
I literally proved it above with GUM 10. I’ve done so with Taylor 3.9 and 3.16, Taylor 3.47, Bevington 3.14, and anything else you’ve told me to use and yet I get the exact same result every time. Even you started to prove it on your own a couple times only to make an arithmetic mistakes like erroneously asserting Σa^2 = (Σa)^2.
“= Σ[(∂f/∂x_i)^2 * u^2(x_i), 1, N]”
What in blue blazes do you think you are calculating here?
YOU ARE CALCULATING AVERAGE UNCERTAINTY!
You are doing so using root-sum-square!
sqrt{ ( u_1^2 + u_2^2 + … = u_N^2) / N^2 ]
Which becomes sqrt[ total_uncertainty^2) / N
which becomes total uncertainty/N
Bellman can’t give a cogent argument as to what use the average uncertainty is. Can you?
The average uncertainty is *NOT* the uncertainty of the average!!!!!!!
The uncertainty of the avg is what you started with.
avg(x) = Σ[x_i, 1, N] / N.
But the uncertainty of the avg is:
ẟavg = ẟx_1 + ẟx_2 + ….+ ẟx_N + ẟN/N
which reduces to ẟavg = ẟx_1 + ẟx_2 + ….+ ẟx_N
If you want to use root-sum-square for the addition go ahead. It doesn’t matter. The uncertainty of ẟN/N still drops out and you are left with just the uncertainty of the individual elements being propagated onto the average!
It is that PROPAGATED uncertainty that is of interest. The average uncertainty is of no use whatsoever – at least in the case of multiple measurements of multiple things using multiple devices!
bdgwx said: “(1) u_c^2(y) = Σ[(∂f/∂x_i)^2 * u^2(x_i), 1, N]”
TG said: “What in blue blazes do you think you are calculating here?”
The uncertainty of the function f. It is literally GUM 10. How can you possibly not recognize it especially considering you just posted it?
TG said: “You are doing so using root-sum-square!”
No. I’m using GUM 10.
TG said: “The uncertainty of the avg is what you started with.
avg(x) = Σ[x_i, 1, N] / N.”
Patently False. That’s not even an uncertainty of anything. It’s just the average of sample X.
TG said: “But the uncertainty of the avg is:
ẟavg = ẟx_1 + ẟx_2 + ….+ ẟx_N + ẟN/N”
Patently False. That does not follow from anything in Taylor.
TG said: “The average uncertainty is of no use whatsoever”
Nobody is calculating or concerned with the “average uncertainty” here. I don’t even know what use it would have. The only thing I’m calculating and concerned with is the “uncertainty of the average” which is a completely different thing.
Once again you are running but you can’t hide! You are calculating AVERAGE UNCERTAINTY!
Eqn 10 *Is* root-sum-square!
You are still running! But I still see you!
“Patently False. That does not follow from anything in Taylor.”
Malarky! It’s in Rules 3.4, 3.18, and 3.47!
Uncertainties add – period. It doesn’t matter if it is direct addition, root-sum-square, or fractional uncertainties.
There is no uncertainty in a constant and therefore it cannot add to the uncertainty.
You can calculate an average uncertainty but of what use is it? NONE! You had to calculate the total uncertainty in order to calculate the average – and it is the total uncertainty that gets propagated, not the average uncertainty!
“Nobody is calculating or concerned with the “average uncertainty” here.”
Then why do you divide the total uncertainty by the number of elements if not to get the average uncertainty? It doesn’t matter if you calculate the average uncertainty using direct addition to get total uncertainty or whether you use root-sum-square, you are *still* calculating an average uncertainty!
The only one you are fooling here is yourself! You *know* there is no use for the average uncertainty but you don’t want to admit it. u_total/N *is* the average uncertainty! Cognitive dissonance is not very becoming!
TG said: “You are calculating AVERAGE UNCERTAINTY!”
Patently False.
At no time did a calculate Σ[u(x_i), 1, N] / N or even care about it. I don’t even know what use it would have.
TG said: “Eqn 10 *Is* root-sum-square!”
Patently False.
GUM 10: u_c(y) = sqrt[ Σ[(∂f/∂x_i)^2 * u^2(x_i), 1, N] ]
RSS: u_c(y) = sqrt[ Σ[u^2(x_i), 1, N] ]
Surely you can spot the difference.
BTW…RSS can be derived from GUM 10 given y = f = Σ[x_i, 1, N].
TG said: “Malarky! It’s in Rules 3.4, 3.18, and 3.47!”
Patently False.
Try it!
TG said: “You can calculate an average uncertainty but of what use is it? NONE!”
I’m not calculating Σ[u(x_i), 1, N] / N. It is of no use AFAIK which is why I’m not calculating it.
What I am calculating is u(Σ[x_i, 1, N] / N) which is completely different and is useful since it is the uncertainty of the average.
TG said: “Then why do you divide the total uncertainty by the number of elements if not to get the average uncertainty? “
The steps above using GUM 10 are 1-8. Which step specifically are you talking about?
TG said: “The only one you are fooling here is yourself! You *know* there is no use for the average uncertainty but you don’t want to admit it.”
I’m more than willing to accept that. In fact, I’ve been trying to tell you that!
TG said: “u_total/N *is* the average uncertainty!”
There is no “u_total/N” in steps 1-8 above using GUM 10.
“Throughout much of the GUM the combination y using function f is not only for measurements of different things, but measurements of completely different types with completely different units or in some cases no units at all. Your “SAME THING” requirement is completely made up.”
So what? When you try to use the average equation (i.e. Eqn 10) YOU ARE *STILL* FINDING THE AVERAGE UNCERTAINTY AND NOT THE UNCERTAINTY OF THE AVERAGE!
“Your “SAME THING” requirement is completely made up.”
Sorry, it isn’t. A functional relationship doesn’t mean what you think it does! Constants still don’t have any uncertainty and uncertainty of the variables propagate in the same manner as I’ve showed.
“verify it with the NIST uncertainty machine”
How do you use the NIST uncertainty machine with a data set consisting of independent, random variables which can form *any* distribution including bi-modal or multi-nodal let alone a skewed distribution? I see no place to enter skewness or kurtosis which can certainly occur with multiple measurements of different things using different measurement devices!
Once again, you are back with Bellman in assuming that all measurements and uncertainties generate well-behaved distributions like Gaussian, Poisson, or uniform. That way you don’t have to deal with the real world!
TG said: “So what?”
The “so what” is that the combining function f does not require the inputs to be of the same thing. It doesn’t even require the inputs to have the same units.
TG said: “When you try to use the average equation (i.e. Eqn 10) YOU ARE *STILL* FINDING THE AVERAGE UNCERTAINTY AND NOT THE UNCERTAINTY OF THE AVERAGE!”
Excuse me?
GUM 10 is not “the average equation”. Nor is it calculating the “AVERAGE UNCERTAINTY”. And it only calculates uncertainty of the average if the function f itself computes the average.
I’m curious…what do you think GUM 10 is calculating?
“The “so what” is that the combining function f does not require the inputs to be of the same thing. It doesn’t even require the inputs to have the same units.”
Equivocation! It is *still* AVERAGE UNCERTAINTY! It is not uncertainty of the average!
“GUM 10 is not “the average equation”.”
The function you defined calculates the average! In this case it’s the average uncertainty!
Here is what you defined for the function:
Let y = f = avg(x) = Σ[x_i, 1, N] / N.
You even used the descriptor of “avg*!
So what you found was the average uncertainty!
And that is *NOT* the uncertainty of the average! N is a constant and cannot add to the uncertainty!
As usual, you can run but you can’t hide!
TG said: “Equivocation!”
It is unequivocal. The function f used in GUM 10 does not in anyway require the inputs to be of the same thing. It doesn’t even require the inputs to be of the same type with the same units or even have units at all. The GUM even provides examples of f where the inputs are not the same thing.
TG said: “ It is *still* AVERAGE UNCERTAINTY! It is not uncertainty of the average!”
I know. Mathematically that is Σ[u(x_i), 1, N] / N != u(Σ[x_i, 1, N] / N). Burn that into brain.
TG said: “So what you found was the average uncertainty!”
Patently False.
I calculated u(f) = u(Σ[x_i, 1, N] / N) which is the uncertainty of the average.
You are discussing Σ[u(x_i), 1, N] / N which is the average uncertainty.
What I calculated of u(f) = u(Σ[x_i, 1, N] / N) is not the same thing as what you are discussing of Σ[u(x_i), 1, N] / N.
“I know.”
Then why can’t you tell us what use it is to calculate the average uncertainty when it is total uncertainty that must be propagated forward? You have to calculate total uncertainty in order to find the average uncertainty so what does the extra step buy you except mental masturbation?
TG said: “Then why can’t you tell us what use it is to calculate the average uncertainty”
I can’t tell you what use it is because I know of no use for it. That’s why I’m neither calculating it nor considering it all. I just don’t care about it in the slightest.
TG said: “You have to calculate total uncertainty in order to find the average uncertainty”.
Nobody cares about average uncertainty except you.
Burn the following statements into your brain.
I don’t care about Σ[u(x_i), 1, N] / N. And I’ve never calculated it.
I only care about u(Σ[x_i, 1, N] / N]). I calculate it by letting f = Σ[x_i, 1, N] / N] and find u(f) per GUM 10.
If you have an issue with what I’m doing then address what I’m actually doing instead of deflecting and diverting into topics no one is discussing.
” Let y = f = avg(x) = Σ[x_i, 1, N] / N.”
u(Σ[x_i, 1, N] / N)
“I can’t tell you what use it is because I know of no use for it. That’s why I’m neither calculating it nor considering it all. I just don’t care about it in the slightest.”
It *is* what you are calculating. The uncertainty of the average is the total uncertainty. What you are calculating is the total uncertainty divided by N:
Sum/N.
That is the average uncertainty. It is what you would calculate if you want to associate one single value of uncertainty across each of the individual elements in the data set.
The value you *should* be propagating is the total uncertainty. That is the value that should be carried forward with the average value.
ẟx_1 + ẟx_2 + … + ẟx_N + ẟN
It’s the only value that makes any sense in the real world. It’s why you refuse to address the issues I brought up about rebuilding an engine. You *know* I am right but you just can’t admit it!
My guess is that you can’t even describe the ramifications to the engine of using your average uncertainty, can you?
TG said: “It *is* what you are calculating.”
What do you call u(Σ[x_i, 1, N] / N)?
What do you call Σ[u(x_i), 1, N] / N?
TG said: “ẟx_1 + ẟx_2 + … + ẟx_N + ẟN”
What equation from Taylor did you start with to get this? What steps did you use get from there to here?
Did you miss this word “observations” in your rush to plug into equations you don’t understand?
It means individual measurements of the same measurand!
THIS IS IMPOSSIBLE WITH TEMPERATURE MEASUREMENTS!
You get one shot and then you are done:
Hey professor, what is square root of one?
YES!
“To be pedantic the uncertainty of the average decreases with an increasing number of elements in the sample.”
You’ve been shown over and over how this is wrong. You’ve even admitted that fractional uncertainties add. When you add elements their uncerainty thus gets added as well.
Are you now going to tell us that fractional uncertainties DO NOT add?
TG said: “You’ve been shown over and over how this is wrong.”
What I have been shown over and over again by you is that Taylor says the uncertainty of an average is the uncertainty of the individual elements divided by root-N. Literally…you’re own source is inconsistent with your position. I’m more than happy to walk you through the Taylor equations step by step yet again to prove it.
Two questions:
Why do you continue to abuse this poor defenseless equation?
When do the gorillas enter the ring?
You nailed it. The issue is different scenarios.
In the first scenario you usually assume that uncertainty cancels. As many measurements will appear on the minus side of the mean ad on the positive.
Nothing similar can be assumed for scenario 2.
Yet our resident statistical experts alwsys want to assume that the means they calculate, either from the population or from samples is 100% accurate. Therefore uncertainty in the measurements can always be ignored.
Bingo!
bdgwx said: “Do you understand that sum(X) = Σ[X_i, 1, N] / N is different from avg(X) = Σ[X_i, 1, N]? “
Typo…that should be…Do you understand that avg(X) = Σ[X_i, 1, N] / N is different from sum(X) = Σ[X_i, 1, N]?
Is X the stated value of the data elements or the uncertainty of the data elements?
Do you even understand what the difference between the two is?
All you have posted here is meaningless word salad!
If yo have a pile of random length boards does avg(X) = Σ[X_i, 1, N properly describe each board?
“Do you understand that sum(X) = Σ[X_i, 1, N] / N is different from avg(X) = Σ[X_i, 1, N]? Do you understand that sum(X) is different from avg(X) when X is a sample board lengths, areas, or whatever other scenarios you’ve conjured?”
Let’s see:
sum(X) = Σ[X_i, 1, N] / N
How is this the sum of the lengths, areas, or whatever of the boards?
avg(X) = Σ[X_i, 1, N]
How is this an average of the lengths, areas, or whatever of the boards?
It’s not apparent that you know the difference between a sum of the length and the average length. And you are accusing *me* of not understanding?
TG said: “It’s not apparent that you know the difference between a sum of the length and the average length. And you are accusing *me* of not understanding?”
I do understand. sum(X) = Σ[X_i, 1, N] and avg(X) = Σ[X_i, 1, N] / N and those yield two completely different answers. Sticking boards end-to-end and determining the final length from the individual lengths is an example of a sum. Dividing the sum of the individual lengths by the number of boards is an example of an average.
Yet when I talk about an average you conjure up an example of a sum and then gaslight me by claiming how absurd it is to think the uncertainty of the sum can be less than the uncertainty of the individual lengths.
You’re insane if you think this is gaslighting.
Intentional or not, that’s quite funny.
I’m not the fool claiming Tim does not understand what a simple average is.
I was trying to give you a compliment.
As to Tim, I’m sure he understands what a simple average is. The problem is he doesn’t understand how to calculate the variance of a simple average.
CM said: “I’m not the fool claiming Tim does not understand what a simple average is.”
I’m genuinely unconvinced he does not at least in regards to how to craft an example using an average. On multiple occasions we’ve had discussions about the uncertainty of the average and he’ll invoke an example that uses a SUM operation as proof that the uncertainty of the average cannot be lower than the uncertainty of the individual members. Take his example of a 2″x4″x8′ board above that is cut into pieces and then laid end-to-end to reform the original length of the board. The final length is clearly an example of a SUM. And this isn’t even the first time this conflation has occurred.
I’m not trying to poke fun of anyone here. I’m just pointing out that we can’t go any further with the discussion until the concept of an average is fully understood. This includes how to calculate it (which I think he does know) and how to think about it intuitively and craft examples (which I think must be lacking still).
There is also a conflation of the average uncertainty and uncertainty of the average going on as well. Those aren’t the same thing either with the former offering little to no functional utility in the propagation of uncertainty.
Averaging does not reduce uncertainty.
Deal with it.
“On multiple occasions we’ve had discussions about the uncertainty of the average and he’ll invoke an example that uses a SUM operation as proof that the uncertainty of the average cannot be lower than the uncertainty of the individual members.”
The average of the stated values is
avg = (x_1 + … + x_n)/n
The uncertainty for this is
ẟavg = ẟx_1 + … + ẟx_n + ẟn
Since ẟn = 0 the uncertainty of the average becomes:
ẟavg = ẟx_1 + … + ẟx_n
(I can do this in fractional uncertainty if you wish but ẟn/n is still zero and doesn’t contribute to the uncertainty of the avg.
Average uncertainty is:
(ẟx_1 + ẟx_2 + … + ẟx_n)/n
That is *NOT* the same equation as for the uncertainty of the average!
Prove my math wrong.
It is *YOU* that doesn’t understand averages as applied to data with uncertainties.
CM said: “You’re insane if you think this is gaslighting.”
Bellman said: “Intentional or not, that’s quite funny.”
This has to be one of the funniest exchanges I’ve seen on WUWT in awhile. +1 to both of you!
Y’all have bizarre senses of humor.
Here is an example of real physical uncertainty. We’ll use numbers that are easy to deal with.
Let build a temporary walkway across a river where 8 inch diameter pylons have been driven into the dirt.
1st – 1 board 100ft ± 1 in
Possible length of board – 99′ 11″ to 110′ 1″
Average Uncertainty – √1/1 = 1″
Possible length of span – 99′ 11″ 100′ 1″
2nd – 10 boards of 10′ ±1 in for each board
Possible length of board – 99′ 2″ to 100′ 10″
Average Uncertainty – √10/10 = 0.32″
Possible length of span – 99′ 9″ to 103′
3rd – 100 boards of 1 foot ± 1 in for each board
Possible length of total = 91′ 8″ to 108′ 4″
Average Uncertainty –√100/100 = 0.1″
Possible length w/avg Uncer – 99′ 2′ to 100′ 10″
This is what uncertainty is all about when dealing with real physical measurements. Surveying, trusses, compression/tension limits in beams, gear tooth shape, bearing clearance in rotating parts, and number vs torque. You can’t make mistakes or things don’t work correctly and in many cases safety is compromised.
Can you come up with an example where you compute the average avg(X) = Σ[X_i, 1, N] / N and the uncertainty of the average u(avg(X))?
Note that I don’t care at all what the average of the individual uncertainties is. I only care about the uncertainty of the average. Make sure you are reporting u(Σ[X_i, 1, N] / N) and not Σ[u(X_i), 1, N] / N. Those are two different concepts with the later having no functional utility which is why no one cares about it.
Without your bogus root(N) uncertainty “analysis”, your trend charts are meaningless.
Thus you go through this dog and pony show month after month after month after month…
“Yet when I talk about an average you conjure up an example of a sum and then gaslight me by claiming how absurd it is to think the uncertainty of the sum can be less than the uncertainty of the individual lengths.”
The average anything is useless, be it average length or average uncertainty. None of the objects being measured has to be of average length or average uncertainty, especially when you are measuring different things with different devices.
I gave you an example to show that the uncertainty of a sum *is* greater than the average uncertainty.
If you have two data points, 1 +/- .5 and 9 +/- .5, their average is 5. Their total uncertainty is +/-1. Their average uncertainty is +/- .5.
So the sum of their uncertainties *is* greater than the average uncertainty. It *has* to be that way. The average always falls somewhere in the middle so you have values greater than the mean and values less than the mean. When you add the values greater than the mean with the values less than the mean the sum will *always* be greater than some value in between the lowest and the highest.
Why is this so hard to understand?
Because it doesn’t give the answer they want to see?
The surface of th earth is about 200,000,000 mi^2. Divided by 4000 cells gives each cell a size of 50,000 mi^2. That’s a square cell about 200 miles on a side.
And you want us to think that a single value of temperature can represent that cell?
“UAH does not use equal size grid cells. This is why it is important to weight them by the area they cover otherwise you will overweight cells that cover small areas and underweight cells that cover large areas.”
And that is why UAH (or any of the current data sets, be they surface measurements or satellites) truly represents a global average temperature. The satellites cover much more of the earths surface than do the surface measurements so one would expect them to be closer to the GAT than the surface measurements but there is *still* a wide uncertainty interval for such a value.
“Remember, the uncertainty of an average is lower than the uncertainty of the individual elements upon which that average is based. “
You *still* can’t get this straight! The average uncertainty is *NOT* the uncertainty of the total, i.e. the average. Variances add when combining random variables. You simply can’t reduce that variance by arbitrarily dividing by a constant. The variance of the sum remains the sum of the variances!
Suppose you have the total uncertainty of:
.1 + .2 + .3 + .4 = 1.0
Take their average and you get .25.
.25 + .25 + .25 + .25 = 1
The *EXACT* same value as the original sum.
If you lay 100 random boards end-to-end and their total uncertainty is +/- 5″ you simply cannot reduce that uncertainty by dividing by 100! That only gives you the average uncertainty, not the uncertainty of the average! The uncertainty of the sum of the boards will remain +/- 5″!
Again, the average uncertainty is *NOT* the same thing as the uncertainty of the average!
The big problem you have is the “need” to use a geostatistic basis for deriving a GAT. Temperature is not a mineral deposit with varying concentrations over a large area.
You are trying to use a geostatistic basis to arrive at a single number. That is basically saying that a mineral deposit scattered over a large area has a single average value of concentration wherever you decide to mine. Throw a dart and that point will provide the average value. Not likely. The average is worthless in determining the best location.
Likewise, if the GAT is the average over the whole globe, then the expectation is that everywhere is following that trend. At most you would need one accurate thermometer, probably in the Arctic, to show that this value is correct.
Excellent!
Good summary. Let me add that every time an average is calculated information is also lost. This occurs on daily, weekly, monthly, annual, global, and anomalies. Whenever you look at a GAT (Global Average Temperature), ask yourself what is the variance in that mean value. Has the variance been calculated properly from each daily average all the way through to the variance of the single GAT anomaly?
Techniques of an accomplished dry-labber.
Reacher actually already answered you.
T_older > T_newer for olive trees.
T_older < T_newer for glaciers.
T_older > T_newer for Greenland.
There are all kinds of proxies you can do this with.
“ If so, then you are probably somewhat challenged by the realities of life.”
You pretty much nailed with this short, succinct sentence.
It’s why bdgwx also assumes you can jam together multiple measurements of different things using different measuring devices and just assume out of thin air that all the uncertainty associated with all those measurements are random and symmetrical and therefore cancel when you calculate an average. It’s why he thinks you can just jam winter and summer (i.e. NH and SH) assuming that the variance of temps in winter is the same as the variance in summer and calculate an average. It’s why he thinks the average of a multi-nodal distribution (again NH and SH) is representative of the global climate (i.e. the GAT).
Little if any experience in measuring and analyzing real world data. Much like the CAGW scientists who do the exact same thing.
But, neither can you declare that the past was cooler than today.
However, I would point out that when the NH was mostly covered in ICE, it was obviously cooler. When the glaciers melted, it was obviously warmer than now since we are discovering that current glaciers are uncovering things that lived when the glaciers were smaller. Smaller means warmer than today.
If the melting glaciers ever reach the point where they show no living thing ever, THEN you can start making claims that we have reached a temperature never seen before during the Age of Man.
Bravo!
I am still trying to understand how my state experienced the 4th coldest April evah…and everywhere else it’s warm 🤔
Don’t get me started on May.
Weather. It is ubiquitous. Your state is not immune from the variation it causes.
Magical 😉
Weather is not magic. It is just the atmosphere following the laws of physics.
Measuring it and than changing those past measurements is magic.
Measuring it does not require magic either. And nobody said anything about changing past measurements.
“And nobody said anything about changing past measurements.”
Then why do you keep equating all the surface data sets with UAH?
I’m not equating surface datasets with UAH here. I’m trying to convince Derg that weather is not magic.
Which is NOT what he wrote!
More sophistry.
“Weather is not magic. It is just the atmosphere following the laws of physics.”
And personality (for example) is just a human brain following those same laws of physics. How can personality be complicated or not fully understood? It’s just following the laws of physics. Is weather as complicated as personality?
using historical data the cooling trend is now 10,000+ years.
The alarmist response to that is surely, “Objects in mirror may be larger than they appear.”
Nice play on Meatloaf!
Prove to us that the temp rise is outside the bounds of natural variability. Oh yeah, you can’t.
Now, would you please stop wetting your pants about a completely unremarkable and perfectly natural rate of warming?
Are you asking if +0.19 C/decade has occurred before or are you asking if the current +0.19 C/decade trend is natural?
When you don’t want to answer a question, you get quite inventive.
Which question am I supposed to be answering?
The only thing I asked you to do was stop wetting your pants.
So I’m not supposed to be answering a question?
You can’t handle the question.
What question was that?
My comment was regarding “unremarkable and perfectly natural rate of warming” I didn’t know what the context was. Does “perfectly natural” mean +0.19 C/decade trend has occurred before or does it mean the current +0.19 C/decade is of natural cause only? Keep in mind that I always assume comments are in good faith and try to respond in kind.
Applying made-up “adjustments” and “calibrations” to old data is certainly not “good faith”, it is fraudulent.
CM said: “Applying made-up “adjustments” and “calibrations” to old data is certainly not “good faith”, it is fraudulent.”
Why not tell that to Anthony Watts and the rest of the WUWT editors who are promoting and advocating for fraud on a monthly basis? Maybe they’ll listen to you…I don’t know.
And what does this have to do with the +0.19 C/decade trend being unremarkable and perfectly natural rate of warming”?
Why are you repeating this lie over and over?
And if “Anthony Watts and the rest of the WUWT editors” were in fact promoting such (which they are not), they would be complicit.
Your defense of your fraudulent activities is reduced to: “these other people are burning and looting, so its ok for me to do the same.”
More of your sophistry.
Is posting UAH updates on a monthly basis and only UAH updates not promoting UAH? Is authorizing Monckton’s pause posts based on UAH data on a monthly basis not promoting UAH?
Your goal posts are as fluid as Niagra Falls.
As you’ve been told countless times, the UAH calculations do NOT involve assuming numbers made up from vapor, as your cherished “adjustments” are.
CM said: “As you’ve been told countless times, the UAH calculations do NOT involve assuming numbers made up from vapor, as your cherished “adjustments” are.”
I’ve been told repeatedly on here that infilling is making up numbers.
And you were told correctly, dr. adjustor.
UAH infills therefore they make up numbers according to that definition.
The satellites continuously scan the globe, why on earth would this be needed?
I don’t believe you.
CM said: “The satellites continuously scan the globe, why on earth would this be needed?”
The MSUs provide poor coverage.
[Spencer & Christy 1990] figure 4 pg 1115
CM said: “I don’t believe you.”
[Spencer & Christy 1992] pg 850 column 1 paragraph 3
Why don’t you try doing what Spencer does using other data sets and actually see if WUWT will post your results instead of just claiming WUWT will only post UAH? You might be surprised.
So zero datasets that within the likely range of the prediction from the IPCC based on CO2 increases (0.24 to 0.64 deg/decade), much less anywhere close to the best estimate of 0.4 deg/dec. Guess we can declare CO2 not a significant threat.
In the absence of El Nino noise, it is taking on the pattern of the longer-term ocean cycles.
http://www.climate4you.com/images/NOAA%20SST-NorthAtlantic%20GlobalMonthlyTempSince1979%20With37monthRunningAverage.gif
And other cycles..
http://www.climate4you.com/images/PDO%20MonthlyIndexSince1979%20With37monthRunningAverage.gif
7th warmest May. Possibly the warmest in a La Niña year.
The start date for the Monckton pause, not surprisingly, remains unchanged at October 2014.
The “kink” analysis still shows the best fit for a change as being in March 2012. Trend up to March 2012 is +0.12°C / decade, after that it’s +0.24°C / decade.
Some more random trends.
Since January 1997, the start of the previous pause, the trend is now +0.12°C / decade.
Since January 2002, the start of Monckton’s 7 years of global cooling, the trend is now +0.15°C / decade.
Since March 2009, when Monckton was presenting his 7 years of global cooling, the trend is now +0.25°C / decade.
Thanks Bellman, it’s a relief to be reassured that we are all doomed after all, however there looks to be a worrying negative linear trend developing from 2016. Any thoughts?
I’m not suggesting any of the changes in trend are significant. I think as far as UAH data is concerned the 0.13°C / decade trend across the entire data set is as good a first estimate as any.
As to your worrying trend, why are you dragging it down? It’s absurd to suggest that nearly all the temperatures over that period were above the trend. Remove that offset and the negative linear trend shows temperatures where they would have been if the previous trend had just continued.
Read and study this.
https://online.stat.psu.edu/stat501/lesson/14/14.1
Read this tweet by someone who knows his stuff and referenced the above link.
https://twitter.com/BubbasRanch/status/1531461496554852356?t=lFXCIKgxe4IPLVGePPDPNQ&s=19
Most of what you are doing is to try and use linear regression on non-stationary time series. It just won’t work. You might explain to the folks here why stationary time series are important.
What are you on about now? I keep saying you need to correct for auto correlation. That’s why I tend to use the Skeptical Science Trend Calculator for confidence intervals, because I trust it more than I trust my own estimates.
But non of this means you cannot use linear regression. There’s little point calculating trends if the data is non-stationary, as by definition there won’t be one.
Bell. –>. “But non(e)of this means you cannot use linear regression. There’s little point calculating trends if the data is non-stationary, as by definition there won’t be one.”
There will be trends in non-stationary time series. However, they may be spurious.
If you know a time series is non-stationary because of a changing mean, then by definition the trend is not spurious.
If you mean that it’s possible for stationary data to produce spurious trends, then yes. That’s the whole point of doing significance testing, including the need to adjust for autocorrelation.
But if you are suggesting the warming trend over the last 40 or so years could be spurious, then you need to justify that claim. Even the strongest autocorrelation corrections show it to be statistically significant.
And as always you need to ask yourself why you don’t consider this to be a problem when looking at Monckton’s pauses. Correcting for autocorrelation shows these short trends to have enormous confidence intervals, and no indication that there has been a change in the trend.
That should have been, there’s no point calculating a trend for stationary data.
Multiple cyclical time series, combined in a functional relationship, *can* have a trend over a defined interval of time. That’s how triangle and sawtooth waves are formed.
Of course they can. What has that got to do with whether a stationartime series can have a trend?
Look at the variables you are trying to trend. What is the significance. Can you tell from your trend what caused it? You trended against time. Does time create temperature?
You are like day traders in stock markets that try to trend prices only and when to jump in or out. Real marketers do due diligence and investigate financial balance sheets, dividends, sales numbers. In other words the things that change a companies worth.
Simple trends of temps versus time do none of this.
I’ve trended against time, I’ve trended against CO2, I’ve trended against combinations of CO2 and ENSO.
The point about trending against time is to see if something has changed with respect to time. That does not imply time caused the change, but it does allow you to consider the change in a cause agnostic way. First establish there is a change, then consider what might have caused it.
So why are you against comparing change over time, yet keep insisting you should do Fourier analysis which is all about fitting sine waves with respect to time? You seem to think that fitting sine waves will tell you something about the cause, but don’t consider it possible that there might also be causes that cause linear changes over time.
Because trending something over time will never tell you about what causes any trends. It won’t even tell you if trends are spurious. Why do you think the statisticians want to create “long records” out of data that should be two different records.
Read and study this link.
Simpson’s Paradox (Stanford Encyclopedia of Philosophy)
Note carefully the phrase:
Look at this post by Tom Abbott.
https://wattsupwiththat.com/2022/06/01/uah-global-temperature-update-for-may-2022-0-17-deg-c/#comment-3527396
Isn’t it funny how many subpopulations do not match the entire population?
Lastly, not you, bdgwx, stokes, or any other warmist has ever been able to quote what the statistical parameter of variation is for the GAT. The are well known procedures for combining data sets and computing the combined average (mean) and the combined variance. Every average from daily to monthly to annual to global will cause a change in the variance.
What is the variance associated with the GAT from any of the temperature anomaly databases? Don’t quote the error, but the actual variance. Please consider that when averaging summer and winter the variance is going to be very large because of the temperature difference. Likewise for averaging NH and SH.
A mean without a variance also quoted is meaningless. That is one technical reason why the GAT is meaningless among others. If I tell you a mean of 50, it could be from a small variance of data like 49 & 50, or it could be from a large variance like 0 & 100.
Inquiring minds want to know. You should too if you want to know what meaning your trends actually have.
Do you actually understand Simpson’s Paradox? I struggle with it, but I’m pretty sure you cannot invoke it the way you are suggesting. That every place on the earth is cooling, but the average is rising. Could you explain how that could happen is each time series is covering the same period.
I could see how this might happening if your sub populations are different time periods. E.g. you could break the entire time series into periods where there is a negative trend in each, but the overall trend is up because each period is hotter than the earlier periods.
“Do you actually understand Simpson’s Paradox? I struggle with it, but I’m pretty sure you cannot invoke it the way you are suggesting. That every place on the earth is cooling, but the average is rising.”
from wikipedia:
“particularly problematic when frequency data is unduly given causal interpretations.[4] The paradox can be resolved when confounding variables and causal relations are appropriately addressed in the statistical modeling”
This explains it pretty well!
The climate models do not consider confounding variables let alone the impact of combining multi-nodal distributions. such as combining NH and SH temperatures. Anomalies are higher in winter than in summer. So a global average can see a cooling trend while every place on the earth is actually warming. The opposite can be true as well!
It’s why climate models that depend on one basic factor being the driving force for temperature can come up with one thing for the global average while regional reality is something different.
Why do you think the obsession with “long” records exists amongst climate scientists? A whole batch of “short records” is very prone to spurious trends. You can eliminate that with long records. It is one reason why the number of stations was reduced so drastically too.
It’s one reason for creating new information to replace correct recorded measurements. By “homogenizing” you can create a long record where there was not one.
“A whole batch of “short records” is very prone to spurious trends.”
You should point that out to Tim. He’s the one who keeps insisting short term trends often become long term ones.
“You should point that out to Tim. He’s the one who keeps insisting short term trends often become long term ones.”
Once again you confuse the whole issue! A short term trend *can* become a long term trend, that has nothing to do with it being spurious!
Long term trends, at least when done using plain old linear regression, gives *all* records even weight. Data from 50 years ago is given equal weight to present data. That is nothing more than the argumentative fallacy of Appeal to Tradition – “It’s been that way since I was born so it will always be that way!”.
A spurious trend is one that doesn’t actually exist. That is *not* the case where the slope of the trend line has actually changed. That’s not to say that the overall trend won’t change back in the future but you just can’t automatically assume that is going happen because of “tradition”! That is especially true when all confounding variables aren’t considered or even identified!
You are trying to deflect from the question. Of course short term trends can become long trends just as they can just remain short trends by changing to a new slope.
That is not the real question. I pointed out the obsession with creating new information so one can claim a “long” record.
Creating new information to replace correct past temperature records, THAT IS THE ISSUE you need to address.
It is NOT how any other field of science allows data to be manipulated. Why does climate science allow this? What is the purpose for doing so? Please discuss the real issue.
And I really wouldn’t trust some random person posting on Twitter. His claim seems to be completely bogus.
You claiming that the current rate of warming is unprecedented is bogus.
When have I claimed that?
Ah, so you admit that the current rate of warming is perfectly natural, and nothing to do with our evil see-oh-toos.
Isn’t it wonderful what a Super El Niño at the end will do for a trend.
We’re in a La Nina right now. That is pulling the trend down.
It’s almost as if natural forcings completely override any miniscule forcing anthro CO2 may have on the climate, isn’t it?
Calm down dear!
On monthly and yearly timescales absolutely. I’ve been trying to tell people that on these timescales cyclic processes within the climate system provide a much higher modulating impact on the energy inflow and outflows in the atmosphere. That’s why we see a lot of variation on these timescales despite the trend on decadal and higher timescales being decisively up due to the positive planetary energy imbalance.
I see, bdgwx: The approximately two decade pause in global warming from the late 1990s to about 2015 was because “… the trend on decadal and higher [sic] timescales being decisively up due to the positive planetary energy imbalance.” [NB The energy imbalance is de minimis.]
Given your observations, CliSciFi certainly wasted years trying to explain the pause, and then working creatively to erase it. Do you really expect your dead horse to get up and run in response to your constant flogging?
Word salad alert!!!
Can you enlighten me as to what causing the “positive planetary energy imbalance” do you know what it is or do you have a guess. Oh by the way CO2 may be part but it not all is it? Can you tell me what part?
The positive planetary energy imbalance (often referred to as the Earth Energy Imbalance EEI in academic literature) is primarily the result of the radiative forcing of of GHGs. The total positive RF as of 2021 is 3.2 W/m2 of which CO2 contributes about 2.1 W/m2 or 66% [AGGI]. Note that the EEI is the net of all positive and negative RF agents. Aerosols have a negative RF of about -1.0 W/m2 [IPPC AR6 WG1 Figure 2.10]. Volcanic, solar, and various other factors impact the total RF as well. The EEI is then amount of RF remaining to be equilibrated in the climate system.
IIRC, it is increased SW rather than GHG LW affecting EEI over the last couple of decades. [You can look it up if you want.] Anyway, the global warming rate in the 21st Century has been drastically reduced from the rate experienced over the late 20th Century. The latter rate was used to gin up public hysteria and with which CliSciFi models are tuned (incorrectly) to atmospheric CO2 concentrations, leavened by liberal applications of arbitrary amounts of manmade aerosols and funky cloud estimates.
It hasn’t been warming for the past few decades the way the UN IPCC CliSciFi climate models say it should. It doesn’t matter how much one regurgitates misleading RF factoids, the Earth’s climate system is not acting as predicted. It certainly has not been acting in a manner necessitating the fundamental alteration of our society, economy and energy systems.
How much compared to the Super El Niño uptick? It seems UAH6 is trending down towards the pre-Super El Niño levels.
You should see what it does if you start a short trend with a super El Niño.
You have a bad case of Trends on the Brain.
Be sure to tell Lord Monckton that.
Why should I? Anyway, it is a trivial observation that temperatures always trend downward after a Super El Niño.
Because some here think that the trivial observation that temperatures go down after a Super El Niño proves something unusual has happened.
That could be a knee-jerk response to those that think that temperatures going up during a Super El Niño prove something unusual has happened. Well, this latest one did interrupt a relative flat trend during the first couple of decades of the 21st Century. We’ll see what happens between now and the next one.
So far the 21st Century doesn’t look too good for the CliSciFi alarmists. Additionally, Obama and Biden’s sky high energy prices isn’t helping their cause any. Escalating energy prices, higher taxes and the increasing cost of living were always going to kill it anyway. I guess that doesn’t matter, though, because lots of people made lots of money along the way. The rub is we common folk will be left to pay the tab for the banquet we couldn’t attend.
It’s the strong El Nino of a few years ago that has enabled this recent ‘cooling’ trend nonsense. I didn’t think people would fall for it again. I’m too trusting.
TFN, did you not think that the warming trend of the early 20th Century would have disabused the notion that CO2 caused the same warming trend over the same period length in the late 20th Century? You are too trusting for sure.
”It’s the strong El Nino of a few years ago that has enabled this recent ‘cooling’ trend nonsense.”
It’s the strong El Nino of few years ago that has enables this ‘warming’ trend nonsense.
The problem with this is that linear math just doesn’t properly deal with cyclical phenomena.
Tell that to Tim. He was the one who insisted I used that method, as it was the same as Monckton uses.
As usual you want claim that no linear math can describe “cyclical phenomena”, but will no doubt be cheering on Monckton when he does just that, to claim there has been no warming over the last 7 years and 8 months.
Meanwhil, I’m still waiting to see your analysis using cyclical methods.
Nobody insisted that you use anything. Suggestions to use a different kind of analysis might help see errors in your own chosen method.
It was put to me that the kink method was some new approach that duplicates Monckton’s “analysis”. But for some reason nobody actually tested this, and when I do, it shows the best kink is on 2012. This isn’t to your liking so now you insist it’s inappropriate. Yet you still won’t criticise Monckton for doing what Tim insists is exactly the same thing, just approached from the other side of the mountain.
It’s almost as if your criteria for accepting or rejecting an approach is, does it show me what I want to see.
It’s been pointed out to you at least twice in the past that the kink process and the Monckton process both try to identify points where the combination of cyclical processes at play in the biosphere cause a change of slope in the data progression. Yet you stubbornly cling to the belief that linear regression, giving equal weights to both past and present, is the only valid way to analyze even processes that are combinations of different cyclical processes.
You and the climate scientists are all the same. If the slope of the linear progression from 1900 to 2000 is “m” then it will *always* be “m”. It will never change. Unfreakingbelievable.
“You and the climate scientists are all the same. If the slope of the linear progression from 1900 to 2000 is “m” then it will *always* be “m”. It will never change. Unfreakingbelievable”
You really need to get some better material for your trolling. All you do now is make up some lie about what I believe, and then say “unfreakingbelievable”.
I absolutely do not believe you can just fit a linear trend to 100 years of data, ignore whether it’s a good fit or not, and then claim it will never change. Nobody does this, with the possible exception of Lord Monckton. For example:
“ignore whether it’s a good fit or not”
It’s not a matter of whether it is a good fit or not! It’s a matter of whether or not recent residuals are growing, thus indicating that something has happened. Then its a matter of trying to figure out what has happened. First, however, you need to identify the point at which something happened.
You keep on arguing that identifying the point at which something happened is somehow invalid! Therefore you can just keep on keeping on with the long term trend!
And it’s not a matter of which different specific year or month the change started as found by different processes somehow invalidates each other. That’s just plain nit-pickiing. It’s like arguing exactly when winter *weather* started last year, was it November or September! Or did summer weather start in May, June, or July? The fact is that the weather *did* change.
It’s the fact that residuals are growing that shows it’s not a good fit. Observation and analysis would suggest the main change was in the mid 70s if you are still talking about the 1900 to present period. If you are talking about just the UAH data, there is no obvious sign of a change, but if there was a single point the best estimate would be 2012. If you allow 2 change points you can get something closer to the first pause but followed byaccelerated warming up to present.
And again, stop lying about me. I am not saying it’s invalid to find the point at which something happened. All I’ve said is a) you need to test if a change actually happened, that the change is significant, and b) you need to have a valid way of identifying the point.
“And again, stop lying about me. I am not saying it’s invalid to find the point at which something happened.”
Then why do you keep arguing that the kink algorithm and Monckton’s method are INVALID!
Or have you now changed your mind and are willing to admit that they *are* valid!
You say that if the residuals are growing then the linear trend is not a good fit but then turn around and claim that the growth in the residuals might not be significant and that you need to find a valid way of identifying the point that it occurs – implying that the kink algorithm and Monckton’s method are not valid.
You just can’t help yourself. I’m not lying about you. You are lying to yourself about you!
Point to the comment whereI said the kink method was INVALID, or stop lying.
And stop pretending Monckton’s cherry-pick has anything to do with the kink analysis or any other change point analysis.
Back to the cherry picking sophistry, again.
“And stop pretending Monckton’s cherry-pick has anything to do with the kink analysis or any other change point analysis.”
See what I mean? You simply can’t help yourself! Both Monckton and the kink algorithm identified the same point in time within a 30 day interval. If you say one is invalid then the other is invalid as wall.
All you are doing is trying to dismiss the validity of finding where the residuals change so you can continue to point to the long term trend as a predictor of the future.
You *still* haven’t identified any other change point analysis method, you’ve just claimed others exist. If they exist then what are they? If those other methods don’t exist then what the kink algorithim and the Monckton process finds are *the* methods available for use today. And it’s obvious that you don’t agree that they give valid answers. That’s *your* problem, not the problem of the methods.
“See what I mean? You simply can’t help yourself! Both Monckton and the kink algorithm identified the same point in time within a 30 day interval. If you say one is invalid then the other is invalid as wall.”
Wut?? Monckton identifies October 2014, the kink algorithm identifies March 2012. How are they the same point in time within a 30 day interval?
“All you are doing is trying to dismiss the validity of finding where the residuals change so you can continue to point to the long term trend as a predictor of the future.”
More lies. How many more times do I have to say that I am not claiming the long term trend as a predictor of the future. .
“You *still* haven’t identified any other change point analysis method, you’ve just claimed others exist.”
I’ve also pointed out this is not something I have any expertise in. I used the segmented package in R last month to produce this graph, that also has a change of trend in 2012.
“It’s been pointed out to you at least twice in the past that the kink process and the Monckton process both try to identify points where the combination of cyclical processes at play in the biosphere cause a change of slope in the data progression.”
Is that what you are saying the point of the pause is this time? Could you explain what combination of cyclical processes caused the instantaneous warming of around 0.25°C in October 2014?
“Yet you stubbornly cling to the belief that linear regression, giving equal weights to both past and present, is the only valid way to analyze even processes that are combinations of different cyclical processes.”
Stop lying. I do not believe that. There are many valid ways of analyzing the time series. I’ve asked you two to demonstrate how you would analyze it using nothing but cyclical processes and to provide some evidence that there is nothing but cyclical processes, but so far just a deafening silence.
“Is that what you are saying the point of the pause is this time? Could you explain what combination of cyclical processes caused the instantaneous warming of around 0.25°C in October 2014?”
Can you!
That’s the whole problem with the CAGW people. They have done *NO* research on what the cyclical processes might be! And you expect me, a retired electrical engineer, to somehow pull these processes out of my research concerning the climate?
“Stop lying. I do not believe that. There are many valid ways of analyzing the time series. I’ve asked you two to demonstrate how you would analyze it using nothing but cyclical processes and to provide some evidence that there is nothing but cyclical processes, but so far just a deafening silence.”
I’m not lying about you. You just proved it with your challenge for *me* to figure out what all the cyclical process might be!
And there *are* many valid ways of analyzing time series. Fourier analysis and wavelet analysis are but two of them. Statistical analysis of cyclical processes, the ones you are so dependent upon, is simply not a very good tool for identifying what the underlying cyclical processes might be.
Someone else posted to you about using Fourier analysis and wavelet analysis. To do so you need a function to analyze. Can you provide me the function to analyze? If not then you are asking a question impossible to answer. It’s a sure bet statistical analysis isn’t going to provide that function! I’ve not seen any such function anywhere in the CAGW literature I’ve read.
“Can you!”
Why should I? I don’t think it happened.
What I do think is the ENSO cyclic process produced a large El Niño in 2016, which can give you a spurious trend line starting a year or so earlier. And the fact that it requires a big rise in temperatures is a good indication that the trend change is spurious.
“That’s the whole problem with the CAGW people. They have done *NO* research on what the cyclical processes might be!”
Ignore the CAGW people in your head and read scientists. There’s a lot of research into ENSO and other cyclic processes.
“I’m not lying about you. You just proved it with your challenge for *me* to figure out what all the cyclical process might be!”
What a weird non-sequitur. You said I believed that linear regression is the only valid way to analyze time series. How does asking you to provide evidence that all the processes are cyclical as you keep claiming, prove that I only think linear regression is valid?
“And there *are* many valid ways of analyzing time series. Fourier analysis and wavelet analysis are but two of them. Statistical analysis of cyclical processes, the ones you are so dependent upon, is simply not a very good tool for identifying what the underlying cyclical processes might be. ”
How do you do wavelet of Fourier analysis without using statistics? It’s all the same, trying to fit a model to the data.
“Can you provide me the function to analyze?”
Surely the function is the UAH time series. If not, what are you talking about. You keep insisting I do wavelet or whatever analysis on UAH in preference to a linear regression model.
For what it’s worth I run UAH data through the WaveletComp package in R. Not making any claims about the validity of this, I’m just using default values. Note, this means the data is de-trended with a loess span of 0.75.
Here’s the power spectrum. I think this is mainly saying there’s a roughly 4 year cycle throughout the series.
And here’s the reconstruction against the de-trended anomalies. A good fit, but I’m not sure what this is telling me other than ENSO causes oscillations in temperature.
Here’s one I tried with HadCRUT 4. In this case I didn’t de-trend the data, as I was hoping to see a cycle that explains the late 20th century warming. It’s not a very good fit, but maybe I just need to fiddle with the settings.
But that is important.
Now, do you think CO2 is the cause or is ENSO?
If CO2, what is the process whereby CO2 causes ENSO cycles?
“Now, do you think CO2 is the cause or is ENSO?”
Cause of what? Annual temperatures, both. The overall rise, just CO2. That’s what I think, what about you?
“If CO2, what is the process whereby CO2 causes ENSO cycles?”
Why would CO2 cause ENSO cycles?
To be clear. If you are talking about my inexpert wavelet analysis for UAH, it’s against de-trended data. What do you think was causing the trend?
That’s pretty cool. I’m going to have to learn R.
I see some things happening at 2, 4, & 8 years.
The point is that you only examined in variable. We already know that there are cycles made up of a number of various phenomena.
That is one reason I made the point that research is needed to define all these periodic functions with math before one can break them down and find their phases and frequencies.
What you have done is to determine what appears to be a period in UAH. What makes up that periodic frequency is not known.
If you think this is useful, you do the analysis. There’s nothing surprising that there is a periodic oscillation in temperature. It’s mostly caused by ENSO. You keep wanting to ignore ENSO when it comes to the “pause” but then insist it’s possible to claim all the warming of the last 50 or so years was caused by periodic cycle – but you won’t provide any evidence to back up this claim, whilst simply ignoring the obvious way temperature is increasing in line with the CO2 rise, which is not a cyclic process.
Why do you think you never see a cyclical form of an equation for any phenomena in climate?
Has anyone ever published one? I would surely like to see one. Remember some are so long we’ve not even had one full cycle.
Does that make linear projection a correct method?
Because the cyclical processes are slow in their change, and some are very slow, it is easy to look at a linear regression as going on forever. The best that can be done in this case is to try and identify where the cyclical processes might be causing a change in the biosphere by looking for changes in the slope of the data. Past is not the future. If “m” is the slope of the regression line from the past to the present and you all of a sudden see the present data moving to m = 0 (or at least something different) then you may have found a point where the cyclical processes are causing a change. It is worth identifying such a point so you can study what is happening.
If you are going to use linear regression of a cyclical process to forecast the future then you need to properly account for cyclical changes that impact the linear regression. Past is *not* future. Linear regression gives equal weighting to both past and present which is *not* how you should handle cyclical processes.
“If you are going to use linear regression of a cyclical process to forecast the future…”
I’m not.
Of course you are. That’s why you are so adamant about the “kink” process being an incorrect analysis and saying we must depend on the long term linear regression to tell us what is going to happen in the future – just like the climate models.
Stop making things up. I am not saying the kink process is incorrect. I’ve specifically used it in the graph you objected to. All I’ve said is I couldn’t comment on whevere it was better than any other change point detection. As it is the result I get using it is pretty much the same as I got using an R package.
And I have not used linear trends today what will happen in the future. I’ve explicitly repeated that you should not do that.
And yet you imply in your statements and assertions that the kink method and Monckton method are invalid. What other change point methods do *you* know of?
From the point of view in 2012 the temperatures of today are the “future*! Yet you cling to the linear regression line up to 2012 telling us what the temperature should be today!
If you don’t think linear trend lines should be extended into the future then do you also think the climate models are all fake? All they show is an extended linear trend line of the form y = mx + b + c for the future where c is nothing more than an insignificant, random “noise” added in a faint attempt to fake natural variation. They are basically all trained against the linear trend line formed from past data and are nothing more that extensions of that trend line.
Be honest this time. Are the climate models to be believed or not?
It’s June the Second, and my furnace is still running. Stick this into your meaningless GAT trend chart.
Oh wait, you can’t.
May 20th we had 12″ of snow here; and on May 30th it was 77 degrees (F). Be very afraid. LOL
Maybe you should get an engineer to check out your furnace. I haven’t had my boiler on for heating since February.
Of course it is possible we live in different parts of the world and they have different temperatures, and it’s also possible anomalies in the lower troposphere are not identical to those on the ground.
Anomalies in the lower troposphere are supposed to drive average temperatures at the surface. Or is it the other way around? In any case, temperature trends in the lower troposphere are not warming as predicted by the UN IPCC CliSciFi models. AR6 even had to throw out some of the hottest models, even though they kept the remaining models that had (non-existent) tropospheric hot spots. To their credit, though, they did keep the couple of models that didn’t have the (still non-existent) hot spot.
The wheels are beginning to fall off the CAGW bandwagon. Hell, even woke elite ESG international bankers are beginning to point out the emperor has no clothes. And here we are quibbling about meaningless temperature trends, some of questionable provenance.
From the ‘stick your head out of the window and conclude that weather across the whole world must be the same’ style of reasoning.
May 6153BC was warmer. And a few others. May 2022 is the 3,933rd warmest May in the Holocene.
Obviously I should have said it was the 7th warmest May since the satellite era.
I doubt anyone knows what the satellites would have said for May 6153BC with any certainty.
“Obviously I should have said it was the 7th warmest May since the satellite era.”
Even if that were true, and I don’t think anyone really knows for sure (averages of disparate temps = bad), why should we care?
For someone who rejects the satellite records, he sure does rely on them when it’s convenient.
I believe that is documented in the Klimate Koran.
7th out of 40, no big deal. Especially given the state of the various multi-decadal climate cycles. If you can get similar when AMO and PMO go negative, then you might have something worth mentioning.
As to the La Nina, it’s still a pretty wimpy one.
I didn’t claim it was a “big deal”, just interesting.
I’m not sure what you mean by the current La Niña being wimpy. It seems to me to be the strongest since 2011, when the May anomaly was -0.12°C.
https://psl.noaa.gov/enso/mei/
Talk about cyclic. Up and down. Maybe a linear regression will provide a good projection.
Interesting how the temperature trend for the last 40 years matches the ENSO index.
Once again, no room for CO2 in your data.
The R^2 of ONI and 5-month lagged UAH TLT is 0.12. That is not what I’d call a match.
It doesn’t. The temperature trend over the last 40 years has been up, the trend of ENSO is if anything downwards.
Here’s a simple model using a linear combination of CO2 and ENSO, with a lag of 6 months. The model is trained on the data up to the start of Monckton’s pause (green dots) and tested on the pause period (blue dots). The red line shows the prediction and the shaded area is the prediction interval.
And here’s the same if I ignore CO2 and only use ENSO. Not such a good fit.
-1.0 via ONI is considered moderate. And that’s two moderates back-to-back now. May 2022 is the 2nd warmest May during a La Nina. May 2017 ranked #1 and it occurred during a weak La Nina.
Perhaps what goes up must come down. That’s what happens when cycles are in control.
And your evidence that cycles are in control is…?
I’d love to see some evidence that temperatures will come down. But I’ve been hearing this for over ten years now. Either temperatures will drop any time now, because of whatever cycle is in fashions.
Or it’s looking at the last few years to claim that warming has stopped or we are already heading towards a new ice age. And so far, it just hasn’t happened. Each pause that is claimed to show we have reached the top of a cycle only lead to an even warmer pause.
What do you oscillations are? How about cycles? How about precession? How about orbits? Have you done a Fourier analysis to determine there are no underlying wave involved?
Have you done a Fourier analysis to determine there are no underlying waves involved? Have you analyzed any potential waves to determine whether they are spurious or can be supported by a physical mechanism?
You give a functional relationship and I’ll do a Fourier or wavelet analysis.
Haven’t you ever questioned why you’re still trying to predict temps using linear regressions of a single dependent variable of temperature time series when it is obvious that much of climate including temperature is cyclical.
Where is the scientific work to identify and define periodic phenomena like ocean oscillations? Tell why these are not being done. Why are we relying on statistical methods of analyzing one variable rather than developing functional relationships between multiple variables?
“Why are we relying on statistical methods of analyzing one variable rather than developing functional relationships between multiple variables?”
Money.
How about repetitive ice ages as proof? How about the dust bowl? How about the fact that inland CA has suffered from repetitive droughts over thousands of years and is classified as a semi-arid desert?
There are all kinds of proof of cycles in the climate, some with short periods and some with longer periods.
Warming *has* stopped for much of the globe. The fact that we have seen multiple pauses in just the 20th and 21st century is a good indication of cyclical processes at play.
Why do the climate scientists *never* do a wavelet analysis of the climate? Geologists do, that’s how wavelet analysis was first used, to see patterns in the earth over very long periods of time as well as short periods!! Climate scientists *should* be able to do the very same thing – but they don’t. Of course that would mean they would have to work to identify some of those cyclical processes which would shift their focus from scaring everyone that the Earth is turning into a cinder – which subsequently means much of the money source would dry up!
Hockey stick!!!!!!
The Blockheads G & J show up right on schedule with the Holy Trends.
That’s the best you can do?
Arctic sea ice extent ended May its highest at that date since 2013.
So?
It’s within the bounds of natural variability, so what’s your point?
Excuse me were are the error bars? How big are they and what kind of instrumentation are you using that you can tell me you can measure down to a hundred of a degree with any knowledge it right. Have you every tried to do precise measurements down to a hundredth of a degree? I never did it with temperature but I have with voltage and even very expensive gear cannot do that over a few days without being recalibrated. I certain the same applies to the solid state device used today to measure temperature since it all comes down to a voltage measurement. There are ways around that by not with with a single device or multiple devices measuring the same voltage averaging does not fix the problem.
All the information comes from Dr Roy Spencer. If you don;t like it I suggest you complain to this blog which continuously promotes the UAH data set.
So he can argue with all the other Spencer groupies like yourself?
Even if you are just trolling, at least try to make it plausible.
It’s not very effective to have you calling me a Spencer groupie and others saying I hate him and all his works.
bdgwx and bellman both assume that the uncertainties are random and symmetrical so that they cancel – even with multiple measurements of different things using different measuring devices. This the “average” has no uncertainty and is a “true value”. And you can therefore calculate the average out to any number of significant digits you wish.
More lies. You’d avoid making so many false assumptions if you actually read what I say, rather than reacting as if I was a heritic threatening your religious dogma.
For the record, my objection was always to your claim that increasing sample size increases uncertainty. I’ve tried to make clear that whilst increased sampling will reduce uncertainty caused by random measurement errors and sampling, but that this does not apply if there are systematic errors in the measurements or in the sampling.
The problem is that you initially gave an example where all the errors were assumed to be random and then claimed this would mean the measurement uncertainty of the mean would increase by the root of the sample size. We’ve tried for over a year to explain why this was wrong and you refused to accept your mistake. Then all of a sudden you start saying, but what if the errors were all systematic, and insist it was my mistake to claim they were random in the first place.
All I’ve said in regard to this is a) systematic errors will not reduce with sampling, but they will not increase, so your initial claim is still wrong. And b) worrying about systematic measuring errors is odd when your other claim is that averaging will reduce errors if, and only if, you are measuring with the same instrument.
And you’ve been told again and again and again and over and over and over that averaging a time-series of temperature measurements is NOT random sampling!
And I’ll ignore you over and over again, because it has nothing to do with what is being discussed.
100 thermometers being averaged with only random measurement errors. Nothing about it being a time series, nothing about what is being averaged, just the claim that if each has a random independent uncertainty of ±0.5°C, then the measurement uncertainty of the mean can somehow be ±5.0°C.
OF COURSE IT DOES! WHAT DO YOU THINK THESE TREND CHARTS ARE?!?
Sheesh.
And your example of 100 thermometers is just more sophistry because they do NOT and can NOT measure the same quantity.
“WHAT DO YOU THINK THESE TREND CHARTS ARE?!?”
Something different to this discussion.
“And your example of 100 thermometers is just more sophistry”
It’s not my example, it’s Tim’s.
You own statistics say that when you combine random variables you have to add their variances! What is adding uncertainties but adding variances?
Each and every different temperature measuring location is an individual random variable. Thus, when you combine them, you add their variances.
σ_total = sqrt( σ1^2 + σ2^2 + …. + σn^2)
Exactly the same as Taylor’s rule for combining uncertainties of different things.
ẟ_total = sqrt( ẟ1^2 + ẟ2^2 + …. + ẟn^2)
You want us to believe that ẟ_total ALWAYS = 0 because all error is random, symmetrical, and it all cancels out. Thus you don’t have to worry about propagating error when calculating an average of global temperature! The propagated uncertainty for the mean of any and all samples equals zero so the error of the average mean calculated from the sample means is the standard deviation of the sample means.
It’s an assumption that just doesn’t hold water in the real world.
Nor does taking an average diminish the total uncertainty.
The uncertainty of the sum of values divided by the number of values gives the uncertainty propagation formula of
ẟ_total = sqrt[ (ẟ1^2 + ẟ2^2 + … + ẟn^2) + ẟN^2 ]
since N is a constant it’s uncertainty equals 0 and the number of values contributes nothing to the total uncertainty.
If you take 100 random boards and lay them end to end the uncertainty of the final length remains the SAME no matter what constant you divide the sum of their stated values by. If the total uncertainty of their sum is +/- one foot, that uncertainty remains when you find the average length of the boards laid end-to-end. It *has* to be that way in the real world. You simply cannot change the possible interval those boards laid end-to-end could have by arbitrarily dividing the total uncertainty by a constant. That range of possible lengths will stay the same ALWAYS.
It is *exactly* the same for independently measured temperatures measured at different locations using different measuring devices. The variance of those independent random variables when combined is the sum of their variances. And their standard deviation (i.e. their uncertainty) will be the square root of the added variances. You can’t lessen that total variance by dividing by a constant.
All *you* do is wind up with by dividing by a constant is to get an AVERAGE UNCERTAINTY. But that average uncertainty is *NOT* the same thing as the total uncertainty. You just spread the total uncertainty equally among all of the individual elements. But the total uncertainty remains the same when you add them all together!
The average uncertainty is *NOT* the uncertainty of the total!
Let’s use direct addition of the uncertainties.
.1 + .2 + .3 + .4 = 1.0
The average uncertainty would then be 1/4 = .25 so you wind up with
.25 + .25 + .25 + .25 = 1.0
for the uncertainty of the total. The exact same value as the original sum!
Using root-sum-square instead of direct addition STILL causes the uncertainty of total to grow. It just doesn’t grow as fast.
The average uncertainty is *NOT* the same thing as the uncertainty of the average! Since N is a constant it simply doesn’t contribute to the uncertainty of the average. The uncertainty of the average remains the same as the uncertainty of the sum!
(Weary sigh) Tim Gorman continues to make the same mistake as he’s made from the beginning. And given we’ve spent over a year trying to explain it to him, I guess he will never understand.
But for the benefit of any neutral onlooker – his problem is he just doesn’t understand that the uncertainty of a sum is not the same as the uncertainty of the average. Hence he says
σ_total = sqrt( σ1^2 + σ2^2 + …. + σn^2)
which is correct. It means if you add 100 thermometer readings each with a random independent measurement uncertainty of ±0.5°C, the uncertainty of the total will be 0.5 times sqrt(100) = ±5.0°.
But if you then divided this sum by 100 to get the average you also have to divide the uncertainty by the same. So that if the sum was 2315 ± 5.0°C, the mean will be 23.15 ± 0.05°C.
This is obvious just looking at the numbers above. You know the sum is somewhere between 2310 and 2320, so the mean will have to be between 23.10 and 23.20. If Gorman was correct, then somehow an uncertainty range of 2310 – 2320, has to become 18.15 – 28.15 when you divide by 100. But if the mean could be as low as 18.15, that would implyf the sum was 1815, which is well outside the previously stated uncertainty range.
That this is the correct way of propagating the measurement uncertainty to the mean is easily derived from the equations for propagating uncertainties given in all Gorman’s favorite books. But, the reason Gorman doesn’t understand it is explained here:
“Nor does taking an average diminish the total uncertainty.
The uncertainty of the sum of values divided by the number of values gives the uncertainty propagation formula of
ẟ_total = sqrt[ (ẟ1^2 + ẟ2^2 + … + ẟn^2) + ẟN^2 ]
since N is a constant it’s uncertainty equals 0 and the number of values contributes nothing to the total uncertainty.”
His mistake is to not realize that the rules for propagating uncertainty when you are adding and subtracting measurements is not the same as when you multiply and divide. When you add or subtract you add the absolute uncertainties, but when you multiply or divide you add the fractional uncertainties. Hence his equation should be
ẟ_mean / mean = sqrt(ẟ1^2 + ẟ2^2 + … + ẟn^2) / total + ẟN^2 = ẟ_total / total + 0
and as mean = total / N this becomes
ẟ_mean = ẟ_total / N.
QED.
Total BS, which nicely illustrates that you have no understanding of uncertainty propagation.
He doesn’t. He *always* assumes that the average of a set of random, independent variables is the true value. He *always* assumes that the distribution of the individual uncertainties is random and symmetrical so that the uncertainties cancel and the true value is always the average. He simply can’t accept that you have to PROVE that the uncertainty distribution is random and symmetrical which is hard to do when you are combining individual random variables. If you can’t PROVE this then you can’t just assume it! The variances of combined random variables add. You simply don’t divide the total variance by the number of variables to determine the new variance. V_total is *NOT* (V1 + V2)/2!
“He *always* assumes that the average of a set of random, independent variables is the true value.”
Your lies are glaring.
“He *always* assumes that the distribution of the individual uncertainties is random and symmetrical so that the uncertainties cancel and the true value is always the average.”
And so on. Also self defeating as that is the assumption you make when you say
σ_total = sqrt( σ1^2 + σ2^2 + …. + σn^2)
A formula only correct if all uncertainties are random and independent.
“If you can’t PROVE this then you can’t just assume it!”
It’s a hypothetical problem, I can assume anything l like just as you do. But I also keep trying to explain to you what happens with different assumptions, e.g. all the measurements have a non random bias.
“The variances of combined random variables add.”
And you are back to using “combine” without specifying how you are combining them.
“You simply don’t divide the total variance by the number of variables to determine the new variance.”
What variances are you talking about?
“V_total is *NOT* (V1 + V2)/2!”
Depends on what total you are talking about. Adding two random variables would give you (V1 + V2). Adding two random variables and dividing by 2 would give you (V1 + V2)/2.
Nope. You *always* assume that the uncertainties cancel. ALWAYS!
It’s the only way you can assume that standard deviation of the sample means actually describes the uncertainty of the mean calculated from them. You assume that all of the uncertainties in the sample means just go to zero!
Why then do you ALWAYS assume that sample means are 100% accurate?
Assuming something that is not true in the real world is *NOT* the same thing as assuming something that *is* true in the real world.
Assuming that all error cancels is not the real world. Assuming that all error does *not* cancel IS the real world.
I gave you quotes from 4 statistical textbooks in another thread. They all say V_total = V_1 + V_2. Have you ever seen a negative variance? Can *you* find a textbook that says V_total = V_1 – V_2 when combining independent, random variables?
You are trying to hide when you question what combining random, independent variables involve.
And what does (V1 + V2)/2 tell you? It is an AVERAGE variance and you lose information, you no longer know what the actual variances of each random variable is! Why are you always so interested in statistical descriptions that *LOSE* actual information?
“Nope. You *always* assume that the uncertainties cancel. ALWAYS!“
Then show me the comments where I’ve said that along with their context. Arguing with you is so frustrating because you keep describing scenarios with your own assumptions, and then I point out your conclusion is wrong you change the assumptions and attack me for using your original assumptions.
“It’s the only way you can assume that standard deviation of the sample means actually describes the uncertainty of the mean calculated from them.”
I say that’s true, only if all samples are completely random, independent and there are no systematic measurement errors.
“Why then do you ALWAYS assume that sample means are 100% accurate? ”
I don’t. If you actually read anything I’ve told you you’d know that. But I assume it’s much easier to argue with a straw man of your own invention than work with what I actually say.
“Assuming something that is not true in the real world is *NOT* the same thing as assuming something that *is* true in the real world.”
Well done.
“Assuming that all error does *not* cancel IS the real world. ”
True. What do you think assuming all errors add is? The real world or not?
“I gave you quotes from 4 statistical textbooks in another thread. They all say V_total = V_1 + V_2.”
I keep asking how you are combining these random variables. V_1 + V_2 is correct if you are adding (or subtracting) two random variables. (providing the variables are independent)
“Have you ever seen a negative variance?”
(cautiously wonders where this is going)
Of course I haven’t. Negative variances don’t exist. That’s the point of squaring the errors.
“Can *you* find a textbook that says V_total = V_1 – V_2 when combining independent, random variables?”
I hope not. Why, have you?
“You are trying to hide when you question what combining random, independent variables involve.”
I see you’ve lost all interest in the negative variance question now.
I’m not trying to hide from anything. It’s an important question. Combining random variables can mean many things, and the rules for variances are different in each case.
“And what does (V1 + V2)/2 tell you?”
It’s the variance of the average of two independent random variables.
“It is an AVERAGE variance and you lose information, you no longer know what the actual variances of each random variable is!”
Try thinking about what you are saying. You lose as much information by adding two variances and dividing them by two, as you do by adding two variances.
“I don’t. If you actually read anything I’ve told you you’d know that. But I assume it’s much easier to argue with a straw man of your own invention than work with what I actually say.”
You continue to say the standard deviation of the sample means is the uncertainty of the mean calculated from the sample means.
That says that you do *NOT* propagate the uncertainty of those sample means onto the mean you calculate from them!
Meaning you *do* assume all of the uncertainty from the individual data elements cancel. That’s the only way the uncertainty of that calculated mean can be the standard deviation of the sample means!
You can run but you can’t hide from that fact!
Or are you now going to try and say that the standard deviation of the sample means is *not* the uncertainty of the mean calculated from the sample means? Pick one and stick with it!
“You continue to say the standard deviation of the sample means is the uncertainty of the mean calculated from the sample means.”
I don;t think I’ve ever said that, let alone continuously. For a start I don’t usually say “standard deviation of the sample means” because it’s an ugly and misleading phrase. I prefer “the standard error of the mean”. And for the second, you don;t calculate it from the sample means – that’s your and Jim’s misunderstanding about how it’s calculated.
What I have said is that the standard error of the mean is similar to the idea of uncertainty of the mean. But as usual, that depends on certain assumptions, and does not take into account biased sampling.
“That says that you do *NOT* propagate the uncertainty of those sample means onto the mean you calculate from them!”
Again, I don’t know why you keep going on about sample means. Or why you would want to propagate the uncertainties onto the single sample mean.
“Meaning you *do* assume all of the uncertainty from the individual data elements cancel. That’s the only way the uncertainty of that calculated mean can be the standard deviation of the sample means!”
You really need to define your terms at some point. What uncertainties from individual elements? I assume you mean measurement uncertainties rather than their error. Then what do you mean by the uncertainty of the sample means, by which I assume you are talking about a sub set of the overall sample. Is that the actual standard error of that mean or iust the measurement uncertainty?
Really you keep trying to turn this into something much more complicated than it is. You all I want to do in these simple examples is to take your sample of measurement, say the 100 thermometers. Take their average. Then estimate the standard error of the mean as an indication of how close that sample is likely to be to the population mean. You do that by finding the sample standard deviation and dividing by root N, or 10 in this case. I don’t particularly care what the the individual measurement uncertainty is, because a) it’s likely to be much smaller than the uncertainty from the sampling, and b) it’s already present in the variance of the sample.
None of this means I’m assuming all values are exactly correct, nor do I dismiss the possibility that there may be major flaws in the measurement or sampling process, that could mean that even a precise value, i.e low SEM will be true.
It’s *NOT* an ugly and misleading phrase. It is the PROPER phrase to use! You *are* calculating the standard deviation of the sample means. And that is *NOT* the accuracy of either the sample means or the average of the sample means!
“https://www.scribbr.com/statistics/standard-error/”
Hmmm….
https://www.middleprofessor.com/files/applied-bios
“The standard error of the mean (SEM) is used to determine the differences between more than one sample of data.”
Hmmmm…..
https://www.yourarticlelibrary.com/statistics-2/st
———————————————————
“Suppose that we have calculated the mean score of 200 boys of 10th grade of Delhi in the Numerical Ability Test to be 40. Thus 40 is the mean of only one sample drawn from the population (all the boys reading in class X in Delhi).
We can as well draw different random samples of 200 boys from the population. Suppose that we randomly choose 100 different samples, each sample consisting of 200 boys from the same population and compute the mean of each sample.
Although ‘n’ is 200 in each case, 200 boys chosen randomly to constitute the different samples are not identical and so due to fluctuation in sampling we would get 100 mean values from these 100 different samples.
These mean values will tend to differ from each other and they would form a series. These values form the sampling distribution of means. It can be expressed mathematically that these sample means are distributed normally.
The 100 mean values (in our example) will fall into a normal distribution around Mpop, the Mpop being the mean of the sampling distribution of means. The standard deviation of these 100 sample means is called SEM or Standard Error of the Mean which will be equal to the standard deviation of the population divided by square root of (sample size).
The SEM shows the spread of the sample means around Mpop. Thus SEM is a measure of variability of the sample means. It is a measure of divergence of sample means from Mpop. SEM is also written as σM.”
—————————————————————–
Hmmmmmmmm……….
I guess all these authors must be wrong since you say they are.
Ask him what the square root of one is…
Tim, tell him it’s 1.
Take heart, you got one thing right today…the rest was a complete train wreck.
Here, next try this one for extra credit:
What is the number of observations for temperature measurements?
In Tim’s example it was 100.
Go on. Now do your “but you can only measure anything once, so you have to treat every thermometer as an average of 1, and not bother trying to average them all together” spiel.
Now you’re dodging and weaving, again. Tim’s 100 thermometers was a hypothetical that was designed to get you to see the differences in your holy averages. Of course it didn’t work.
What a silly person. Honestly what do you think we are arguing about. Tim says 100 thermometers will have an average that is ten times bigger than the individual uncertainties and uses obviously wrong algebra to make his point. And now you suddenly think the argument changes if you have a different number of thermometers. All the time carefully avoiding saying if you actually agree with Tim’s arithmetic.
“It’s *NOT* an ugly and misleading phrase.”
It’s misleading because people confuse it with standard deviation (meaning the standard deviation of the sample or population). Search for standard error verses standard deviation of the mean and that’s the first distinction that comes up, e.g.
https://www.investopedia.com/ask/answers/042415/what-difference-between-standard-error-means-and-standard-deviation.asp
You can have a standard deviation or a standard error of anything, but usually standard error generally is taken to imply standard error of the mean, and standard deviation of the sample.
I think the real difference between the term standard error and standard deviation is that SD is meant to be a descriptive statistic where as SE is inferential. If you estimate SEM by dividing the sample SD by root N, then calling it a standard deviation is misleading or just wrong. It would only be a standard deviation if you actually took a number of sample means and worked out the deviation directly from them.
Yes the standard error estimates what the variability across multiple samples would be. Read the whole post, it explains how you calculate that estimate. Nowhere does it actually suggest you work it out using multiple samples.
I get a 404, but I think that’s describing how you can use the SEM, not how you calculate it. I hope you can read it as you keep asking what the use of the mean of the SEM is.
Third link is to “St. Thomas Aquinas Views on Politics”.
It seems the article you were trying to link to is describing what the SEM is, not how you calculate it in a practical sense. Otherwise it’s literally suggesting it would be a good use of time to sample 20,000 boys just to work out how certain you were about a sample of 200.
Note, that all of your sources call it the standard error of the mean despite you insisting this is wrong.
“What I have said is that the standard error of the mean is similar to the idea of uncertainty of the mean”
That is *NOT* what you have said. You’ve said the standard deviation of the sample means *is* the uncertainty of the mean.
And it ISN’T!
“Again, I don’t know why you keep going on about sample means. Or why you would want to propagate the uncertainties onto the single sample mean.”
This statement only shows how little you have learned about metrology!
The uncertainty of the sample mean is the propagated uncertainty from the individual elements in that sample! You simply can’t ignore it like you and bdgwx always want to do. It determines the ACCURACY of the sample mean which, in turn, determines the accuracy of the average you calculate from the sample means.
You *continually* confuse precision with accuracy even after multiple efforts to educate you on the subject!
“What uncertainties from individual elements? I assume you mean measurement uncertainties rather than their error. Then what do you mean by the uncertainty of the sample means, by which I assume you are talking about a sub set of the overall sample. Is that the actual standard error of that mean or iust the measurement uncertainty?”
Now you are throwing crap against the wall hoping something will stick!
WE ARE TALKING ABOUT MEASUREMENTS! TEMPERATURE MEASUREMENTS!
What in Pete’s name did you think was under discussion?
The uncertainty of the sample mean is the uncertainty of the individual elements in the sample propagated onto the sample mean. That definition is what I’ve been using forever. If you are confused by it then it must be because of deliberate confusion by *you*!
I can see right now that you are trying to weasel your way into being able to say that you’ve been saying this all along but I just didn’t understand!
“Then estimate the standard error of the mean as an indication of how close that sample is likely to be to the population mean. “
This has been explained to you over and over again as well! One sample will *NOT* give you a good estimate of the population mean UNLESS IT IS A GAUSSIAN DISTRIBUTION! And you have yet to prove that multiple measurements of different things using different devices will generate a Gaussian distribution! This applies to both the stated values as well as the uncertainty values!
TEMPERATURE MEASUREMENTS ARE MEASUREMENTS OF DIFFERENT THINGS USING DIFFERENT DEVICES! It’s just that simple! Any sample you pull from the population will carry along the uncertainty of each individual measurement! That uncertainty *MUST* be propagated forward to determine the accuracy of *anything* you calculate from the individual measurements!
“ I don’t particularly care what the the individual measurement uncertainty is, because a) it’s likely to be much smaller than the uncertainty from the sampling, and b) it’s already present in the variance of the sample.”
More crap! When have you *ever* calculated the variance of a temperature sample? When has any so-called climate scientist? And I’ve already shown you that the propagated uncertainty will *NOT* be less than the uncertainty from the sampling! That just goes hand-in-hand with your claim that uncertainty goes down as you add data elements! That bigger samples reduce uncertainty!
Bigger samples might increase precision but it won’t decrease uncertainty – not in temperature measurements which are random, independent variables where the variances (uncertainties) add when you combine them! You may as well say that variances subtract when you combine random, independent variables!
“The uncertainty of the sample mean is the propagated uncertainty from the individual elements in that sample! … It determines the ACCURACY of the sample mean which, in turn, determines the accuracy of the average you calculate from the sample means.”
How does it determine the accuracy? As you keep saying, precision is not accuracy.
What I’m trying to understand from all your rants is, when you say the uncertainty of each sample mean, are you talking just about the measurement uncertainty, or are you calculating the standard error of the mean?
And then, why do you think splitting the sample into sub samples will give you a better value for the mean and it’s uncertainty than just taking one bigger sample.
“WE ARE TALKING ABOUT MEASUREMENTS! TEMPERATURE MEASUREMENTS!
What in Pete’s name did you think was under discussion?”
I thought we were discussing averaging and propagating uncertainties in general. You keep trying to turn this into a discussion about planks of wood, and I think at the start of this thread we were just talking about random variables.
“The uncertainty of the sample mean is the uncertainty of the individual elements in the sample propagated onto the sample mean.”
But, as I’m trying to say, that’s not the uncertainty of the sample mean. It’s just the uncertainty caused by measurement uncertainty.
“I can see right now that you are trying to weasel your way into being able to say that you’ve been saying this all along but I just didn’t understand!”
All along I’ve been saying you do not take multiple small samples, but one big one. I don;t think I’ve changed my view on this.
“This has been explained to you over and over again as well! One sample will *NOT* give you a good estimate of the population mean UNLESS IT IS A GAUSSIAN DISTRIBUTION!”
And I’ve been replying that it could be a good estimate if sample is big enough. And it does not depend on the distribution being Gaussian, no matter how large you right the letters.
“And I’ve already shown you that the propagated uncertainty will *NOT* be less than the uncertainty from the sampling!”
Only by misunderstanding how to do that propagation.
“That is *NOT* what you have said. You’ve said the standard deviation of the sample means *is* the uncertainty of the mean.”
It’s quite possible I have said that at points in the past. It’s been a long debate and fruitless debate.
I would argue that as a concept standard error of the mean is essentially the same concept as the standard uncertainty in measurement, a measure of the likely error associated with the mean, or using different definitions, a range that characterizes the dispersion of the values that could reasonably be attributed to the.
But as with all things statistical there are assumptions in that, including the concept that the sample was random and independent, and that there is no systematic error in the measurements.
This is why any uncertainty calculation used in global temperature data sets, do not simply divide the standard deviation by root N, but take into account multiple sources of potential uncertainty.
John R Taylor: An Introduction to Error Analysis, The Study of Uncertainties in Physical Measures
Second Edition, Chapter 3 Propagation of Uncertainties
“Briefly, when quantities are multiplied or divided the fractional uncertainties add.“
The above post is responding to Carlo, Monte saying
“Total BS, which nicely illustrates that you have no understanding of uncertainty propagation.”
in reply to me saying “when you multiply or divide you add the fractional uncertainties”.
I could tell you the point of the distinction you think you are making, but what would be the point? A waste of time.
Hilarious. You could explain the distinction between “when quantities are multiplied or divided the fractional uncertainties add.” and “when you multiply or divide you add the fractional uncertainties”, but you are such a genius nobody reading the comments would understand it so you cannot be bothered.
You think you can find a few formulae to plug into and get something that supports your preconceived notions.
Good luck with this.
The problem is that he never understands the formula’s he’s quoting! He does things like confusing constants with independent variables.
Yes, and if he did understand them, he might see where the generalized rule he’s trying to use comes from.
It’s strange. When this first started, I knew next to nothing about metrology, I just knew that it seemed unlikely, given common sense and statistics that uncertainty would generally increase with sample size.
I was told I couldn’t comment if I didn’t know what all the equations for propagating uncertainties were. Gorman told me I had to use that specific equation from Taylor.
Then, when I show it’s patently obvious how the equation demonstrates that you and the Gormans are just wrong, you suddenly start insisting you cannot use those equations.
Fine. If you can, show me what equations I should be using, demonstrate how they prove that uncertainty if the mean always increases with sample size, and ideally provide a source that explicitly says that. Otherwise, it just looks like you are scrabbling around, trying to come up with any explanation for why your preconceived notions can’t be wrong.
And now you’re da expert.
A PeeWee Herman, another pinnacle of sophistry.
“And now you’re da expert.”
Nope. And probably just as well if you and the Gormans are examples of what being an expert in metrology does to your brain.
You don’t even understand what uncertainty is, just like all your fellow climate $cientologists who “reviewed” Pat Franks paper.
Just for the record, did you ever grace us with your definition of uncertainty? I seem to remember quoting the definition from the GUM, and you not agreeing with it.
What is this, another round of Stump the Professor.
Why do you care what I think, go read the GUM for yourself.
“I seem to remember quoting the definition from the GUM, and you not agreeing with it.”
I owe you an apology. I finally tracked down the comment I was thinking of, and it was Jim who insisted that
Not you. All you said to me quoting the GUM definition was
Just give it up, you are hopeless.
I’ll give your helpful suggestion all the consideration it deserves.
Goody.
Here is a layman’s definition.
What you don’t know and can never know.
Every measurement has uncertainty and the best you can do is to estimate how broad the interval is around each measurement you make and how large the accumulation of uncertainty will be.
That is why there is never an average uncertainty. The uncertainty of an average must carry the total accumulated uncertainty when calculating a sum. Because the sum is uncertain, the average will have the entire uncertainty. Another way is to quote the variance/SD of the ENTIRE distribution for which the average applies. (Please note: the Standard Error or SEM is not the SD of the distribution.)
“What you don’t know and can never know”
Not a very useful definition if you want to quantify the uncertainty.
“The uncertainty of an average must carry the total accumulated uncertainty when calculating a sum.”
And this is why you need a definition, and understand what it means. If you just have some vague hand wavy “it’s just what you don’t know” you can make up any nonsense. If you have a proper definition, you can actually test if that makes sense.
“Another way is to quote the variance/SD of the ENTIRE distribution for which the average applies.”
And now you are saying it is something else. So what is the uncertainty of the average, the uncertainty of the sum of the variance of the distribution or the standard deviation of the distribution? Not, one will increase as sample size increases the other two will generally remain the same.
Now you are taking the dunce cap, placing it on your head and sitting on the stool in the corner.
Your ignorance is abject and total, and you lecture experienced professionals about which you know NOTHING.
All you’ve taken out of the GUM is the equation that you think tells you what you want. This is mathematical abuse.
Hey smart guy, what is the square root of one?
“Then, when I show it’s patently obvious how the equation demonstrates that you and the Gormans are just wrong, you suddenly start insisting you cannot use those equations.”
You *still* can’t discern between average uncertainty and the uncertainty of the average!
You aren’t the expert you think you are. You are a statistician that still can’t understand that a measurement is “stated value +/- uncertainty”. Uncertainty is not error. Average uncertainty is not total uncertainty. All uncertainty doesn’t cancel. Uncertainty is not a probability distribution that is always a random, symmetrical distribution where all error cancels. The standard deviation of sample means is the uncertainty of the resultant mean.
Yet you still claim that average uncertainty is uncertainty of the mean. You still claim that uncertainty is error. You still claim that an uncertainty interval is a probability distribution. You still claim that the standard deviation of the sample means is the uncertainty of the resultant mean because all uncertainty cancels.
“Fine. If you can, show me what equations I should be using, demonstrate how they prove that uncertainty if the mean always increases with sample size”
I *DID* show you what equations you should be using and how they prove that uncertainty of the mean grows when you have independent, random variables – i.e. multiple measurements of different things using different devices.
Variance total = V1 + V2 + V3 + … Vn
The more random variables you combine the wider the variance gets. It is *exactly* the same for uncertainty which is the variance of the independent, random measurement variables.
You keep denying this is the case even after you were given quotes from four different textbooks stating it is how you handle combining multiple random, independent variables.
It is *YOU* who bears the burden of showing how these textbooks are wrong. I’ve now asked you twice to show how these textbooks are wrong but you just keep repeating that they are while actually showing nothing!
“Variance total = V1 + V2 + V3 + … Vn”
And you are still confusing the total with the average. Try it for yourself. Take a set of dice, and keep rolling them. Record the results in two columns. Column A, record the sum of your dice for each roll. Column B, the mean of value of the dice for that roll. Then after a number of such rolls calculate the variance of each column. Are they the same?
You do understand that dice are integers, not measurements?
Apparently not.
You do understand that it doesn’t matter for this example, and that’s easier to tell someone to roll some dice then it is tell them to produce multiple random numbers from a continuous probability distribution?
It tells me Tim has you pegged, a statistician with no knowledge of real measurements.
Really. You think the variance of the mean of multiple random variables is equal to the sum of all the variances. You could try to provide a reference for that, or you could just do an experiment – but no, you just like to troll from the sidelines.
Really. You show up to defend to the last breath tiny uncertainty values for these temperature trend charts by looking for anything you think supports this nonsense—and voila, dividing by root(N) is just the ticket. Anyone who dares to throw the cold water of reality much be put down with any means necessary. With realistic uncertainty limits, the trends are quite meaningless. So you show up month after month after month with your root(N) uncertainty nonsense, telling Tim Gorman he doesn’t understand.
This is circular reasoning at its best, par for the course for climate $cientologists.
And then you claim I’m trolling.
Your act has worn thin and is nothing but a joke.
I’m trying to explain where someone has made a simple mathematical mistake, and then for some reason, probably insanity, I stay around because I’m fascinated how far people will go to avoid accepting the simple point.
It’s a really simple question here. Is the variance of a sum of random variables the same as the variance of the mean of the random variables? It’s a simple yes no question that can easily be resolved by checking the answer online, by going through the maths, or by checking agains real random variables.
I did it last night. You and Tim are so confident I began to worry I might have made a horrible mistake, so fired up R, and generated some sets of random numbers. Using a standard normal distribution, with variance 1, I found that adding two random variables had a variance of close to 2. But taking the mean of two variables, the variance was 0.5. Repeat for 4 variables. Sum has variance 4, mean has variance 0.25.
(At this point I do realize I’d made a mistake. I said to divide the variance of the sum by N, that should have been N^2)
Averaging does not reduce uncertainty, regardless of whatever random numbers you sling around.
And the real issue remains that a time-series of temperature measurements is not random sampling.
That is just one of the problems. None of this follows sampling theory at all. They are assuming a station is a “random” sample of the entire population of all temperatures when it is not.
Exactly right.
“I’m trying to explain where someone has made a simple mathematical mistake”
You have yet to show where my math is wrong.
y = x_1 + x_2 + … + x_n
y_avg = (x_1 + x_2 + … + x_n) / n
Anything wrong so far?
ẟy = ẟx_1 + ẟx_2 + … + ẟx_n)
Anything wrong so far?
ẟy_avg = ẟx_1 + ẟx_2 + … + ẟx_n + ẟn
Is this wrong?
Since ẟn = 0
ẟy_avg = ẟx_1 + ẟx_2 + … + ẟx_n
Is this somehow wrong?
You get the same result if you use fractional uncertainty.
ẟy_avg/ y = ẟx_1/x_1 + … + ẟn/n
Since ẟn is zero you wind up with
ẟy_avg/ y = ẟx_1/x_1 + … + ẟx_n/x_n
NO ẟn/n in the equation.
Is this wrong?
Remember, fractional uncertainties ae PERCENTAGES. You cannot change them to absolute values through substitution.
If your data element is 5cm +/- 1% then the uncertainty is +/- (.01) * 5cm = +/- .05cm.
Take your y = mx and use fractional uncertainty
ẟy/y = ẟx/x
If you introduce m on one side of the equation then you must introduce it on the other side.
then you get ẟy/(mx) = ẟmx/mx
So you get ẟy = (ẟmx/mx) * mx and then ẟy = ẟmx. Since m has no uncertainty you finally get ẟy = ẟx which is obviously wrong.
Can you point out how this math is wrong? It is what happens when you try to convert a percentage to an absolute value!
“You have yet to show where my math is wrong.”
I’ll try.
It’s all OK up to this point.
“ẟy_avg = ẟx_1 + ẟx_2 + … + ẟx_n + ẟn
Is this wrong?”
Yes. That’s where you go wrong. The equation you are using is for adding or subtracting values. But you are not adding n to the sum to get the mean, you are dividing the sum by n. So you need to treat that as a separate step and use the appropriate equation.
“You get the same result if you use fractional uncertainty.
ẟy_avg/ y = ẟx_1/x_1 + … + ẟn/n”
And now you are making the same mistake in reverse. You add the values to get the sum, not multiply them. Again, the only way to do this is step by step.
“Remember, fractional uncertainties ae PERCENTAGES. You cannot change them to absolute values through substitution.”
And this is wrong. If I know a/b is 0.05, and I substitute a value for b, say 200, I know that a = 0.05 * 200 = 10.
“Take your y = mx and use fractional uncertainty
ẟy/y = ẟx/x”
And now your algebra is just wrong. y = mx, we can substitute mx for y because they are the same, we do not have to put m into both sides of the equation.
“then you get ẟy/(mx) = ẟmx/mx
then ẟy = ẟmx. Since m has no uncertainty you finally get ẟy = ẟx which is obviously wrong.”
Yes it’s obviously. You’ve substituted the formula for y into x, so your journey is now
ẟy/y = ẟx/x ⇒
ẟy/y = ẟy/y ⇒
ẟy/(mx) = ẟ(mx)/mx
This doesn’t tell you anything because ẟ(mx) is just ẟy. And you would need to know the rule for multiplying a measure by an exact number to know what ẟ(mx), which is what we’ve been trying to establish in the first place.
I’ve no idea how knowing ẟm = 0, gets you to ẟmx = ẟx. It would help if you were clearer about what you mean by ẟmx. Is it it ẟm times x, ẟm times ẟx, or as it should be ẟ(mx). But in no case can I see how it becomes ẟx.
..the one that gives the number you want to see…
One that gives me the result I know to be correct. Funny how doing something the right way, the way laid down in the holy books, also by coincidence gives me the correct result.
I wouldn’t expect you to understand why that’s the case, so you carry on doing it the wrong way if it gives you the result you want.
You keep wanting to focus on the case where all data elements have the same uncertainty. Why is that?
That is *NOT* the case with temperatures!
It was your example, remember? 100 thermometers each with an uncertainty of ±0.5°C.
It makes it easier to calculate the uncertainty of the sum and the average if they are all the same as you can just reduce it to a multiplication, but the argument works just as well with 100 different uncertainties, it’s just the sum (in quadrature or not) of all the uncertainties.
And it makes no addition to the point about adding fractional uncertainties when you divide by N, as you are just using whatever the single final uncertainty of the sum.
in y = mx, “m” has absolutely nothing to do with uncertainty. All of the uncertainty is in “x”.
That’s why Taylor writes ẟB = 0. In this formula ẟm = 0.
Neither can contribute to the uncertainty.
The constant merely becomes a way to more easily write out the actual uncertainty sum.
mẟx is a substitute for
ẟx1 + ẟx2 + … + ẟxm.
It requires the uncertainty of each to be exactly the same. This just isn’t the case with temperature.
For temperature you *have* to write it out since the uncertainty is not the same for all temperature data.
ẟT_total = ẟt1 + ẟt2 + … + ẟtm
Can you make it even simpler? I think not.
Or wronger.
“in y = mx, “m” has absolutely nothing to do with uncertainty. All of the uncertainty is in “x”.”
Apart from scaling the uncertainty, that’s all.
“Neither can contribute to the uncertainty.”
So why do you think Taylor writes ẟq = Bẟx. Doesn’t he understand that B has an uncertainty of 0 so cannot affect the uncertainty of q?
“This just isn’t the case with temperature.”
So why did you start by saying all the temperatures had the same uncertainty? But as I say, it makes absolutely no difference. As usual you are just looking for a loophole. We can calculate the uncertainty of the sum by adding all the different uncertainties – no need for them all to be the same.
“ẟT_total = ẟt1 + ẟt2 + … + ẟtm”
See, I told you you could do it. Now plug ẟT_total into the equation for dividing by m.
It was a hypothetical, you silly person.
And it’s that hypothetical question we keep arguing about. Then when that fails the goal posts are moved – to no effect as the answers the same.
So now you have resorted to saying the + sign signifies multiplication?
Do you *really* see an “*” or “x” anywhere in the equation?
“And this is wrong. If I know a/b is 0.05, and I substitute a value for b, say 200, I know that a = 0.05 * 200 = 10.”
Your example is so restrictive it is useless except in the one situation where all elements have the same uncertainty. This was pointed out to you at least twice concerning Taylor’s example and you *STILL* continue to ignore it!
——————————————————-
Taylor: “we might measure the thickness of 200 IDENTICAL sheets of paper and then calculate the thickness of a single sheet as t = (1/200) x T. According to the rule (3.8) the fractional uncertainty in q = Bx is the sum of the fractional uncertainties in B and x. Because ẟB = 0, this implies that
ẟq/q = ẟx/x.
————————————-(caps and bolding mine, tg)
In other words the *average* uncertainty *IS* the uncertainty of each element. Thus the total uncertainty ẟq = ẟx * the number of elements.
The *general* rule is if x = x1 + x2 + … + xn then the uncertainty for q is
ẟq = ẟx1 + ẟx2 + …. + ẟ2n.
The average is (x_1 + x_2 + … + x_n)/n
The uncertainty becomes
ẟq = (ẟx_1 + ẟx_2 + … + ẟx_n + ẟn)
since ẟn = 0
ẟq = ẟx_1 + ẟx_2 + … + ẟx_n
If x_1 = x_2 = … = x_n then
ẟq = nẟx
You keep wanting to talk about one restrictive case, y = mx. That is *NOT* the general rule. The general rule works in *all* cases, including if all elements have IDENTICAL uncertainties.
Of course this all goes hand in hand with your considering the uncertainty of the mean as the average uncertainty!
“So now you have resorted to saying the + sign signifies multiplication?”
Please try to concentrate and read Taylor for meaning.
You are the one who keeps insisting you can only uses these equations if you understand all the conditions. Yet here you are using the equation that is clearly stated as being for the propagation of uncertainties involving products and quotients, and using it to find the uncertainty for adding.
In case this still baffles you, I am not saying the plus sign signifies multiplication, I’m saying your use of that equation only makes sense if you are multiplying all your numbers, not adding them.
You’re insane, three fries short of a happy meal.
So you are saying Taylor is wrong again?
It amazes me. People will invent all sorts of reason why the rules of propagating uncertainties in Taylor and every other source I’ve seen don;t apply if you are not following every vague condition. But will happily ignore the actual title of the equation.
Still trying to goad me into answering your stupid question, still not going to work.
DYOFHW.
I know Taylor is right. I’m trying to establish if you think he is or not, and if he is what you think is BS about saying you have to add fractional uncertainties when multiply or divide values.
The only way I can find this out is by asking you, and the fact that you think it’s a trick question gives a good indication of what you actually believe.
And answering it with another of your cheap shots will be another indication.
Translation: WHAAAAAAAAAA!
TG: “Remember, fractional uncertainties are PERCENTAGES. You cannot change them to absolute values through substitution.”
Me: “And this is wrong. If I know a/b is 0.05, and I substitute a value for b, say 200, I know that a = 0.05 * 200 = 10.”
TG: “Your example is so restrictive it is useless except in the one situation where all elements have the same uncertainty. This was pointed out to you at least twice concerning Taylor’s example and you *STILL* continue to ignore it!”
If anyone else can fathom a relevance to Tim’s reply I’d be grateful if they could let me know.
Apart from anything else, there is only one fractional uncertainty here, the one being converted to an absolute uncertainty.
Quit whining.
Quit.
“In other words the *average* uncertainty *IS* the uncertainty of each element. Thus the total uncertainty ẟq = ẟx * the number of elements.”
You still can;t get this the right way round. ẟq is the uncertainty of a single sheet of paper, ẟx the uncertainty of the measurement of the stack. The formula is ẟq = ẟx / the number of elements. Or if you prefer, ẟq = ẟx * (1 / the number of elements).
The rest is your usual problem of trying to argue from a specific example to a general case. In the specific example it’s assumed all sheets are the same thickness, and so the average of the stack is the same as every single sheet of paper. But that doesn’t mean the equation stops working if you are using it to determine the uncertainty of a mean of different sized objects.
And what you say about each sheet having the same uncertainty makes no sense. There is no uncertainty in the individual sheets. What you are doing is calculating the thickness of an individual sheet from the size of the stack and then saying what the uncertainty of that measurement is. Measurements have uncertainty, not the objects.
Another total FAIL, no wonder you can’t understand what Tim writes.
No wonder you can’t provide a definition of uncertainty if you think an individual sheet of paper has an uncertainty.
Are you for real? Seriously, is this just an act?
ABCs for anomaly jockeys: The pieces are identical, and all have the same uncertainty of thickness.
You are thick if you think the uncertainties are all zero.
“The average is (x_1 + x_2 + … + x_n)/n
The uncertainty becomes
ẟq = (ẟx_1 + ẟx_2 + … + ẟx_n + ẟn)”
What’s the point?
You ask me to explain why this is wrong. I do. And you just repeat it as true. You are genuinely incapable of learning. You cannot understand what the difference between adding n and dividing by n. You ignore all the conditions for each equation, you ignore the requirement not to mix addition and multiplication when propagating uncertainties.
“If x_1 = x_2 = … = x_n then
ẟq = nẟx”
Now you are just making stuff up.
“You keep wanting to talk about one restrictive case, y = mx.”
It was the equation you used. It’s the only equation that matters because when you are dividing the sum by the count you have already determined the uncertainty of the sum. It’s how you have to do it, because as Taylor says, you cannot add the numbers and then divide in a single step. It doesn’t matter how you determined the uncertainty of the sum, whether all the uncertainties were the same or different. You just at this point need to know what that uncertainty is.
“The general rule works in *all* cases, including if all elements have IDENTICAL uncertainties. ”
All the rules work regardless of whether the uncertainties are identical or not. All are expressed in terms of uncertainty 1 + uncertainty 2 + uncertainty 3 etc.
“Of course this all goes hand in hand with your considering the uncertainty of the mean as the average uncertainty!”
Ahhrgggg!!!!
Talking through your hat, again.
“Yes. That’s where you go wrong. The equation you are using is for adding or subtracting values. But you are not adding n to the sum to get the mean, you are dividing the sum by n. So you need to treat that as a separate step and use the appropriate equation.”
Nope! See Taylor 3.18!
q = x/u
ẟq/q = ẟx/x + ẟu/u
You’ve already admitted that fractional uncertainties add. You keep avoiding answering the question of whether or not you are going to stick by that.
I *am* using the appropriate equation!
“ But you are not adding n to the sum to get the mean, you are dividing the sum by n”
I am *NOT* adding n to get the mean. I am adding the uncertainties just as every does, from Taylor to the GUM!
avg = (x1 + x2 + x3) / n
You divide by n to get the average. But to get the uncertainty of the average you *add* the uncertainties of all the elements!
ẟavg = ẟx1 + ẟx2 + ẟx3 + ẟn
If you want fractional uncertainties it is
ẟavg/avg = ẟx1/x1 + ẟx2/x2 + ẟx3/x3 + ẟn/n
(remember that fractional uncertainties add, right?)
ẟn = 0 so it falls out of either equation!
“Nope! See Taylor 3.18!”
That’s the rule for propagating uncertainties in Products and Quotients again. You’re just repeating the same mistakes over and over with different symbols.
“q = x/u
ẟq/q = ẟx/x + ẟu/u”
Yes.
“You’ve already admitted that fractional uncertainties add.”
Yes, though it’s hardly an admission. It’s what I’ve been telling you for months, or years.
“You keep avoiding answering the question of whether or not you are going to stick by that.”
Yes. When you multiple or divide vales you add their fractional uncertainties. We all know where this is going. Do I need to read any further to see you make exactly the same mistake I’ve pointed out to you over and over?
“I *am* using the appropriate equation!”
You are here. You weren’t when I was calling you out for using the equation for addition in order to divide by N.
“You divide by n to get the average. But to get the uncertainty of the average you *add* the uncertainties of all the elements!”
No. To get the uncertainty of the sum you add all the absolute uncertainties, to get the fractional uncertainty of the average you add the fractional uncertainty of the sum to the fractional uncertainty of the count (0). And you have to do this in two steps.
“ẟavg = ẟx1 + ẟx2 + ẟx3 + ẟn”
And there you are back to doing it the wrong way. You keep saying you’ve done all the exercises in Taylor. Did you actually get any of them right?
“If you want fractional uncertainties it is
ẟavg/avg = ẟx1/x1 + ẟx2/x2 + ẟx3/x3 + ẟn/n”
And again no. You cannot just cherry pick which equation you use. One is the correct one for part of your average. The other is correct for the other part. It says clearly at the top of each equation what it is for.
“(remember that fractional uncertainties add, right?)”
I’m sure this is meant to be some big gotcha in your mind.
“ẟn = 0 so it falls out of either equation!”
And read the rest of my comments, or read Taylor to understand that whilst ẟn falls out of the equation, n itself has an important role in the final result.
“And now your algebra is just wrong. y = mx, we can substitute mx for y because they are the same, we do not have to put m into both sides of the equation.”
You can *ONLY* do so if all the uncertainties are equal! The most restrictive case you can have!
If x = a sum of measurements, e.g. x = x1 + x2 + x3
then “m” simply doesn’t apply. You are stuck in the box where you have a multiplicity of IDENTICAL things with IDENTICAL uncertainties and you can get the final uncertainty by multiplying the total uncertainty by the number of things you have!
You think you can *always* get to this restrictive case by finding the average uncertainty and spreading across all data elements! You say you don’t believe that but it’s what you keep falling back on every single time!
Without seeing this firsthand, I could not believe it is possible for someone to be so ignorant.
There is an old psychology paper/study that is totally apt for these guys, simply titled:
“Unskilled and Unaware”
Not a survival trait. But then bellman depends totally on others for survival!
The study was amazingly simple—they used undergraduates who(m) they would interview after taking an exam and before the results were released: “How well do you think you did on the exam?” Then they would compare their subjective feelings with the actual test results. There was a very strong inverse correlation, students who thought they did poorly scored the highest, while those who thought they well were at the bottom.
“If x = a sum of measurements, e.g. x = x1 + x2 + x3
then “m” simply doesn’t apply.”
You’re just making any old manure up now. Show me where Taylor or anyone says that.
Please! No more irony, I can’t handle to load!
I’ve posted these links elsewhere but I’ll do it again for your convenience.
From:
https://intellipaat.com/blog/tutorial/statistics-and-probability
Here is another web page to read.
AP Statistics: Why Variances Add—And Why It Matters | AP Central – The College Board
Yes, and the first expression is a weighted variance, which I tried to explain months ago to these guys without success.
The mean has no variance! The data elements have variance. That’s why the proper description of a random variable is the mean AND the variance!
When you assign the average value of the data elements to each element you make the variance zero.
That’s why when you assign the average uncertainty to each data element you make the variance of the uncertainties equal 0. It’s why the average uncertainty is so useless!
As a statistician you are a poor example. As a metrology expert you are even worse!
“The mean has no variance! The data elements have variance.”
You are getting your means mixed up. The mean I’m talking about is the mean of a set of random variables. It too will be a random variable and will have a variance.
“When you assign the average value of the data elements to each element you make the variance zero.”
No idea what you are on about now.
“That’s why when you assign the average uncertainty to each data element you make the variance of the uncertainties equal 0.”
Still no idea what you are getting at. Why are you assigning an average uncertainty to each element?
“It’s why the average uncertainty is so useless!”
Then why do you keep mentioning it. You are like a dog with a bone, somewhere you’ve pulled the idea of average uncertainties from the back of your head, and now that’s all you can think about. And then mixing them up with misunderstandings about random variables.
There’s a relationship between the average uncertainty and the uncertainty of the average, but they are not going to be the same, and the average uncertainty is not useful, whereas the uncertainty of the average is.
Go back to your dice games.
“You are getting your means mixed up. The mean I’m talking about is the mean of a set of random variables. It too will be a random variable and will have a variance.”
The mean is *NOT* a variable MEASURMENT! It is a calculated value determined by the individual elements in the data set.
“No idea what you are on about now.”
Of course you don’t. That’s because you don’t actually understand what you are speaking of.
If I have a data set of 5 +/- 2, 6 +/- 3, and 7 +/- 4 then my my average uncertainty is (2 + 3 + 4) / 3 = 3.
The variance of the uncertainty is [(2-3)^2 + (3-3)^2 + (4-3)^2 ] = (-1)^2 + 0 + (1)^2 = 2
Now we spread the average uncertainty across all elements the way you want to do.
The variance of the uncertainty becomes (3-3)^2 + (3-3)^2 + (3-3)^2 = 0 + 0 + 0 = 0.
True variance of the uncertainty is 2, your variance is 0. They are *not* the same!
“Still no idea what you are getting at. Why are you assigning an average uncertainty to each element?”
I’m *not*, you ARE. That’s what you do when you say the uncertainty of the mean is the average uncertaInty!
The uncertainty is related to the variance. You want to make the uncertainty zero so you assign the average uncertainty to all data elements as well as to the mean! That way you don’t have to worry about propagating the uncertainty of the data elements onto the mean. And if those means are sample means then you can use the standard deviation of the sample means as the uncertainty of the mean calculated from the sample means!
“Then why do you keep mentioning it.”
The only one that keeps mentioning it is you! You use it to try and refute the truth that the uncertainty of the mean is not the same thing as the average uncertainty!
It is *YOU* that needs to stop referring to both the average uncertainty and the standard deviation of the sample means being an uncertainty and start referring to the uncertainty of the mean.
“There’s a relationship between the average uncertainty and the uncertainty of the average, but they are not going to be the same, and the average uncertainty is not useful, whereas the uncertainty of the average is.”
Then why do you continue to refer to the standard deviation of the sample means as the uncertainty of the mean calculated from those sample means instead of propagating the uncertainty of the sample means onto the average of the sample means?
“The mean is *NOT* a variable MEASURMENT! It is a calculated value determined by the individual elements in the data set.”
Do you have memory issues? You were talking about combining random variables into a mean. The mean of a set of random variables is a random variable.
And this also applies to uncertainty of the sample mean. It’s made up of randomly selected elements, each of which is therefore a random variable, and so the sample mean will be a random variable. And of course, each value is a measured value and the measurement itself is a random variable. This is why the sample mean has uncertainty, even though the population mean is not random.
“True variance of the uncertainty is 2, your variance is 0. They are *not* the same!”
Why are you doing this and why do you think it matters? What reason do you have for knowing the variance of the variance?
You have no problem adding different variances to get the variance of the sum of random variables. It doesn’t bother you that sum doesn’t contain the variance of the variance. Why do you think it matters when you divide through by the square of the number of variables to get the variance of the mean?
And non of this has anything to do with finding the average variance or the average uncertainty.
Not sure if it’s worth replying to the rest of the comment, as it’s mostly just Tim fighting his own straw men. But here goes.
“That’s what you do when you say the uncertainty of the mean is the average uncertaInty!
You want to make the uncertainty zero so you assign the average uncertainty to all data elements as well as to the mean!
The only one that keeps mentioning it is you! You use it to try and refute the truth that the uncertainty of the mean is not the same thing as the average uncertainty!
It is *YOU* that needs to stop referring to both the average uncertainty and the standard deviation of the sample means being an uncertainty and start referring to the uncertainty of the mean.
Then why do you continue to refer to the standard deviation of the sample means as the uncertainty of the mean calculated from those sample means instead of propagating the uncertainty of the sample means onto the average of the sample means?”
I don’t, I don’t, I don’t, I don’t, I don’t.
But then you divide by your idol root(N).
As opposed to you multiplying by root(N).
if you declare your random variables as samples, you multiply the SEM/SE by the √N to obtain the population Standard Deviation. The SD of the population is what you should be discussing, not the SEM of your samples.
“if you declare your random variables as samples, you multiply the SEM/SE by the √N to obtain the population Standard Deviation.”
Ye gods are back to this again.
Yes, if you take thousands of different samples of the same size, work out the standard deviation of their means you would have an estimate of the standard error of the mean, and if you multiplied that by √N it would give you an estimate of the population standard deviation. But why would you do that.
Take all the samples, put them together, and you have an estimate of the standard deviation and dividing by √N, which is now a much bigger value, you have a much better SEM.
“The SD of the population is what you should be discussing, not the SEM of your samples.”
As I’ve said the last few times, it depends on what you want to be uncertain about. Standard deviation will tell you how close an individual object will be to the mean, the SEM will tell you how close the estimate of the mean is to the actual mean (with all the usual caveats about systematic errors and such like).
Both have their uses, and it’s important not to confuse them.
You are uncertain about many, many things!
By the way, are you accepting that the correct determination of the standard error of the mean is SD / √N, and not SD * √N?
Here’s a huge clue for you: You don’t know what you don’t know.
I suppose you have it recorded someplace that I really wrote this nonsense?
By nonsense do you mean multiplying by root N. Are you saying you think Tim is wrong and you do not multiply by root N to find the uncertainty of the mean?
Dance, dance, dance!
You delusion that averaging temperature measurement reduces uncertainty.
“Dance, dance, dance!” he sang whilst refusing to answer the question.
He’ll never get it. I suspect he’s being paid to never get it.
This is the essence of what CMoB believes.
I remember when I suggested you should relax and take any necessary meditation before replying, and you accused me of committing an ad hominem logical fallacy.
Now you are going down the Moncktonian libel, claiming that secretive organizations are paying me fast sums of money just to explain to you how multiplication works.
Does it ever occur to you that someone trying to discredit WUWT might be better paying someone like you or Carlo to discredit the cause.
Ahhh! Donald Rumsfeld!
It was amusing to see him demand that I play his game four times!
I can’t demand you do anything. Just question why you wouldn’t want to explain what you believe. It’s a simple question, do you think it’s ever correct to use the uncertainty of the sum for the uncertainty of the mean? The fact you see this as a game which will make you look silly whatever you say, says it all.
It *does* matter. The subject at hand is uncertainty.
Have you *ever* seen a dice whose face value is uncertain?
Have you *ever* picked a card from a deck whose value and suit is uncertain?
Please answer yes so the rest of us can move on to ignoring you!
“Have you *ever* seen a dice whose face value is uncertain?”
Yes, most of them. That’s why they are used in games of chance.
“Please answer yes so the rest of us can move on to ignoring you!”
I wish you’d told that’s all I had to do.
tg: ““Have you *ever* seen a dice whose face value is uncertain?”
bellman: “Yes, most of them. That’s why they are used in games of chance.”
I have over 500 dice here in my backpack that I use in D&D gaming. Not a single one has a face value that is uncertain. I would *love* to see a dice that you have whose face value is uncertain!
<blink>
Did my eyes really see this?
Ummmm, lots of times new players will show up with no dice. Rather than them buying some I just give them a set. When they know they want to continue they can buy a set they like and keep the ones I give them as a spare.
When I’m running low I buy cheap ones off ebay or etsy. I guess I’m just a nice guy.
(7 dice per set, D20/D12/D10/D8/D6/D4 plus a percentage die).
(and I love the look on the faces of 10 year old kids when they see a 72 yr old guy doing D&D!)
bellman certainly has no dice! The only way dice are uncertain is that you don’t know what the outcome of a roll will be (wasn’t pointing at D&D).
I remember playing Squad Leader (a long time ago), it was supposed to be a Stalingrad simulation and I was the Russians. I got a big fire group assembled with a high-value leader (colonel I think it was). The Germans also had a big group across the street but I got to fire first.
I roll the dice—no effect, total whiff (1 out 36 chance IIRC).
The German rolled—the opposite happened, another long-odds result. I lose like 2/3 of my group and my leader is KIA. Was pointless to play it out any farther.
“The only way dice are uncertain is that you don’t know what the outcome of a roll will be”
I think I’ll just leave that here.
“Not a single one has a face value that is uncertain.”
Well of course if you just choose a side and place it on the table there is no randomness. Usually I find in game playing the best use of a die is to roll it in the hand and throw it on the table, then which face is showing will be random.
bellcurveman goes for the snark, and fails.
It was a Boojum.
Dice are not measurements. There is no uncertainty about what the face of a die says.
Same with cards. If you pick a card that is the 6 of clubs there is no uncertainty. It isn’t the 5 of clubs, the 7 of clubs, or the 6 of spades.
Neither dice or cards are random, independent variables such as measurements of different things.
You can’t even get your analogies correct!
You were talking about random variables. It doesn’t matter what they represent the rules for calculating the variance of the mean are the same. Dice are definitely examples of random variables, it’s just that they are discrete rather than continuous.
“There is no uncertainty about what the face of a die says.”
Really? You know what the result of the die roll will be fore it happens? You must have cleaned up at craps.
“Same with cards.”
Why do you keep having to divert the discussion. There’s a reason I said to use dice rather than cards, and that’s to avoid getting into these philosophical discussions about probability.
“Neither dice or cards are random, independent variables such as measurements of different things.”
To be clear, do you think the variance of a pair of dice added will be the same as the mean of a pair of dice, or are you saying the special properties of dice stop them from behaving like that?
But as I said, if you don;t like dice, just run a random number generator with the distribution of you choice on your computer. It makes you look really clueless to continuously make statements about random variables, but then hide your eyes with holy dread whenever I suggest testing it with real experiments.
“You were talking about random variables. It doesn’t matter what they represent the rules for calculating the variance of the mean are the same. Dice are definitely examples of random variables, it’s just that they are discrete rather than continuous.”
No, dice are *not* random variables. They are counted items. Random variables like measurements can assume *any* value, not a set of fixed values. Once again, you are confusing probability with being actual measurement values.
And there is no such thing as the variance of a mean. A mean is a mean. The data used to calculate the mean can have variance but not the mean itself.
“Really? You know what the result of the die roll will be fore it happens? You must have cleaned up at craps.”
So what? That is still probability! And for a counting measure that probability distribution specifies specific outcomes. How does the random variable known as a measurement equate to that?
“and that’s to avoid getting into these philosophical discussions about probability.”
ROFL!! You don’t know which card you will pull from the deck just like you don’t know which face of the die will come up! So how are they different?
“To be clear, do you think the variance of a pair of dice added will be the same as the mean of a pair of dice, or are you saying the special properties of dice stop them from behaving like that?”
If you have one six-sided dice the mean is 3.5 and variance is 2.9. If you have two D6’s the mean is 7 and the variance is 5.9. For three D6’s the mean is 10.5 and the variance is 8.8. What makes you think the variance equals the mean for D6’s?
It’s just like uncertainties. The more elements you add the wider the variance (uncertainty) gets.
So what’s your point?
“Random variables like measurements can assume *any* value, not a set of fixed values.”
A random variable can be continuous or discrete. First link I pulled out of the hat
https://www.cuemath.com/algebra/discrete-random-variable/
But doesn’t matter because as I said, you can always drop the dice and use a pseudo random number generator, or if that’s too difficult you could try taking thousands of measurements.
“Once again, you are confusing probability with being actual measurement values.”
You do realize that random variables are all about probability don’t you?
“And there is no such thing as the variance of a mean”
There is if there is uncertainty caused by sampling or measurements. You’re the one who keeps talking about the standard deviation of the means. How do you think you get the deviation if you don’t have any variance?
“If you have one six-sided dice the mean is 3.5 and variance is 2.9. If you have two D6’s the mean is 7 and the variance is 5.9. For three D6’s the mean is 10.5 and the variance is 8.8. What makes you think the variance equals the mean for D6’s?”
That’s the mean of the sum. What I want to know is what you think the variance of the mean. The mean of the average of two D6s is 3.5, the mean of the average of 3 D6s is 3.5, what are their variances?
“It’s just like uncertainties. The more elements you add the wider the variance (uncertainty) gets.”
And I’m asking about how many elements you average.
“So what’s your point?”
The point is to find out what the variance of an average of several random variables is.
Hey, here’s an idea! Turn on a GCM, it will tell you what you want to know.
What’s *really* hilarious is you thinking a constant has a fractional uncertainty and that a constant is an independent variable!
It was a pedantic point, and there’s no point making a fuss over it. All I was saying is that the key concept is that there is no uncertainty, it’s an exact number as Taylor puts it, rather than it being constant.
I say a constant can have an uncertainty. G for example is constant but what that constant is is not known with absolute certainty. Pi is a constant which can be calculated to infinite precision, but if you use it in a calculation with just a few decimal places the answer will not be exact.
Duh! NIST reports the uncertainty intervals for these.
Your root(N) analysis is still lame.
Stop whining. You were being a smart-ass trying to show off your “expertise” and you got caught.
A constant *can* have an uncertainty, that’s exactly what I pointed out. And that uncertainty must be included in any analysis of total uncertainty. You can show that it is too small to be of significance, i.e. it is far less than the resolution of your measuring equipment, but you can’t simply dismiss it out of hand.
With pi you can calculate it out past the point of resolution of your measurements and so you can make a judgement not to include it in your uncertainty analysis. But you should still make that an explicit judgement, you don’t just hide it or ignore it.
“in reply to me saying “when you multiply or divide you add the fractional uncertainties”.” (bolding mine, tg)
And exactly what is the fractional uncertainty of a CONSTANT?
ẟN/N is ZERO!
So when you ADD the fractional uncertainties the constant does nothing to the sum of uncertainties!
“And exactly what is the fractional uncertainty of a CONSTANT?”
That depends on the constant, but in this case we are not talking about a constant but an exact number, and the uncertainty is zero.
“So when you ADD the fractional uncertainties the constant does nothing to the sum of uncertainties!”
I’ve explained several times why this isn’t the issue. Adding zero does nothing to the sum of uncertainties, correct. The issue is that one value is defined in terms of the other multiplied, or divided by the exact number. That’s what forces the two absolute uncertainties to be different, precisely because the two fraction uncertainties are the same.
Word salad.
Could you say what words you are having problems with, and I’ll try to fund better ones? I think everything in that sentence makes sense and the meaning seems clear to me.
No wonder you are so confused: “depends on the constant” — completely meaningless with a huge hole available for equivocation.
“depends on the constant”
A constant is a constant. If it isn’t a constant then it should have an uncertainty associated with it that can be included in the uncertainty analysis. How many constants have *YOU* used on WUWT where you have stated an uncertainty for the constant! If you don’t state the uncertainty then it *is* an exact number!
I really don’t care, it’s nit picking an irrelevant pedantic point I was making. The equation works whenever you multiply or divide a measurement by an “exact number”, i.e. one with no uncertainty. Whether you insist that that makes it a constant or not, I just don’t care. It’s the result that’s important.
As long as you can divide by root(N), you are happy.
tg: And exactly what is the fractional uncertainty of a CONSTANT?”
“That depends on the constant, but in this case we are not talking about a constant but an exact number, and the uncertainty is zero.”
A difference that makes no difference. Measurements are defined as “stated value +/- uncertainty”. If a “constant” is not an exact number and is uncertain then its uncertainty *has* to be noted in any functional relationship and must be included in the uncertainty analysis.
How uncertain is the number of elements in a data set, i.e. N?
“Adding zero does nothing to the sum of uncertainties, correct. The issue is that one value is defined in terms of the other multiplied, or divided by the exact number.”
You admitted that the total uncertainty is the sum of the fractional uncertainties. Whether you multiply or divide using a constant it’s fractional uncertainty gets ADDED into the total uncertainty, it doesn’t multiply or divide the total uncertainty!
So are you now going to revoke your agreement that fractional uncertainties add?
I’ll note here that in Taylor he defines in both 3.8 and 3.18 that the multiplication and division is of VARIABLES, not of constants! I gave you the exact quote and bolded where it says the elements are MEASUREMENTS and not constants!
As usual you just continue to ignore anything that refutes what you are saying. You are incapable of leanring!
Maybe he can elucidate on the uncertainty of pi as used in A = pi * r^2.
ROFL!
Using Taylor’s equations and symbols, we use the rules for multiplication of non–independent values.
δA / A = δπ / π + δr / r + δr / r
And as π is an exact number with no uncertainty this is
δA / A = 2 δr / r
Multiplying by A = π r²
δA = 2 π r δr
Hence, if r = 10 ± 0.2cm
δA = 4 π cm²
and the area is approximately
314 ± 13 cm².
Or you could do it by percentages.
δr / r = 2%
Using the rule for powers, this means the percentage uncertainty of the square of r is doubled to 4% and the uncertainty of π is zero, so
δA / A = 4%
and 13 is about 4% of 314.
Try again.
OK, second attempt π is an exact number with no uncertainty.
Do you want me to try again, or do you think it isn’t an exact number with no uncertainty.
Note I’m saying π, not some numerical approximation of it.
Find someone else for your clickbait games.
Who apart from you do you think is reading any of this and clicking on anything?
To be clear, you are saying you think π is not an exact number.
“How uncertain is the number of elements in a data set, i.e. N?”
It’s zero, that’s why it’s an exact number. Really, I don’t know why you find this so confusing. You claim to have read Taylor. It’s exactly the same terminology he uses.
“You admitted that the total uncertainty is the sum of the fractional uncertainties. Whether you multiply or divide using a constant it’s fractional uncertainty gets ADDED into the total uncertainty, it doesn’t multiply or divide the total uncertainty!”
Have you actually read the comment(s) where I explain this? The uncertainty of the exact number is zero, it gets propagated into the uncertainty, but as it’s zero it makes no difference. What makes a difference is that it’s also the divider for the value – the mean is equal to the total divided by N, and so requires the absolute uncertainty of the total to be divided by N to get the absolute uncertainty of the mean.
“So are you now going to revoke your agreement that fractional uncertainties add?”
I have no idea what you are talking about, and I expect you don’t either. You add fractional uncertainties to get the uncertainty when values are multiplied or divided. There’s no need for an agreement, that’s the way it works. .
“I’ll note here that in Taylor he defines in both 3.8 and 3.18 that the multiplication and division is of VARIABLES, not of constants! I gave you the exact quote and bolded where it says the elements are MEASUREMENTS and not constants!”
It’s Taylor 3.4 I’m referring to, and you’re the one who keeps calling them constants. I preferred the term exact numbers, which is what Taylor calls them.
“As usual you just continue to ignore anything that refutes what you are saying. You are incapable of leanring!”
Maybe if you could provide some evidence that refutes what I and Taylor are saying, we could look at it. But first you need to actually try to engage with the argument rather than looking for any word play that might provide a distraction.
“ What makes a difference is that it’s also the divider for the value – the mean is equal to the total divided by N, and so requires the absolute uncertainty of the total to be divided by N to get the absolute uncertainty of the mean.”
Not according to Taylor, Bevington, or the GUM.
The fractional uncertainty is *NOT* divided by N.
The fractional uncertainty of the average is calculated from X_sum/N, the average value.
That fractional uncertainty is ẟX_sum/X_sum + ẟN/N
There is no division of the uncertainty by N. It is just ẟX_sum/X_sum.
“The fractional uncertainty is *NOT* divided by N.”
You must be smarter than this. I’m not dividing the fractional uncertainty by N.
“There is no division of the uncertainty by N. It is just ẟX_sum/X_sum.”
Have you ever actually read what I wrote? That’s the fractional uncertainty of the sum. It’s equal to the fractional uncertainty of the average ẟX_avg/X_avg (not sure why you are labeling it X, but I assume that’s what you mean.) .
Now as ẟX_avg/X_avg = ẟX_sum/X_sum. It means that ẟX_avg has the same proportion to ẟX_sum, as X_avg has to X_sum.
And what is the proportion of X_avg to X_sum? How do you get from the sum to the average? You divide by N.
“That’s the fractional uncertainty of the sum.”
And that is the *ONLY* uncertainty that is of interest. Average uncertainty is not used anywhere in the real world that I know of!
Why? What interest do have in what the sum of 100 thermometers is, let alone the uncertainty of the sum?
And why are you still talking about the average uncertainty? How many times do I have to tell you that it’s the uncertainty of the average I’m interested in, before it penetrates even your mental block.
As has been pointed out to you multiple times fractional uncertainties apply when you have a functional relationship involving multiple INDEPENDENT VARIABLES! Like a stubborn old mule you are simply unable to internalize that difference!
Take the equation y = mx where m is a constant. The uncertainty is ẟy = ẟm + ẟx. Since m is a constant ẟm equals zero and the actual uncertainty is given by ẟy = ẟx. It simply does not matter where on the number line m lies, it can be less than zero (i.e. a fraction like 1/N) or greater than zero, it remains a constant and does not impact the uncertainty in y.
If you have a functional relationship like y = x/w where both x and w are VARIABLES then you use fractional uncertainties. But both x and w *have* to be variables, not constants. Constants do not define a relationship between a dependent variable and an independent variable. Only the independent variable can vary, not the constant. That’s why you graph y versus x and not y vs m in a linear equation! “m” may determine the slope but it does *not* determine the uncertainty of y, only x does that!
If you would do as I have asked multiple times and actually study what Taylor says you would see from the page you attached you will find:
“If several quantities x,…..,w are measured with small uncertainties ẟx, …., ẟw, and the measured values are used to compute” (bolding mine, tg)
The number of elements in a data set is *NOT* a measured value. Measured means the elements are INDEPENDENT VARIABLES. The number of elements in a data set is a CONSTANT, not a variable.
So the only contributing uncertainty factor in an average is the uncertainty associated with the sum of the data elements used to calculate the average. You simply cannot reduce that uncertainty by dividing by a constant.
“As has been pointed out to you multiple times fractional uncertainties apply when you have a functional relationship involving multiple INDEPENDENT VARIABLES!”
That’s just wrong. There is no requirement in that equation for the uncertainties to be independent. If you know they are independent you can read on down in Taylor and see the equation using the square root of the sum of the squares of the fractional uncertainties. But it makes no difference in this case as one of the variables has an uncertainty of zero. The effect is identical.
“Take the equation y = mx … it remains a constant and does not impact the uncertainty in y.”
I’ve explained how this works in detail here. By the way, there is no requirement for m to be a constant, just an exact value with no uncertainty.
“If you have a functional relationship like y = x/w where both x and w are VARIABLES then you use fractional uncertainties. But both x and w *have* to be variables, not constants.”
Taylor specifically shows what happens when one of the values is exact, and that’s regardless of whether it’s a constant or not. In one example the value is pi (a constant), and in another it’s the number of sheets of paper in a stack (an exact variable).
“The number of elements in a data set is *NOT* a measured value.”
Of course it’s a measured value – how else do you know what it is. Counting is a measure, and if it isn’t you would have to explain a) why you allow it to be used in the equation for adding, which also specifies they are measured quantities, and b) why Taylor uses fractional uncertainty in the section “measured quantity times exact number”.
“That’s just wrong. There is no requirement in that equation for the uncertainties to be independent.”
Every thread on this site is about temperature, it’s measurement, and what those measurements mean!
Each temperature measurement in every temperature data base *IS* an independent, random variable with its own independent uncertainty!
Multiple measurements of different things using different devices with different uncertainty intervals.
Yet *YOU* keep wanting to come back to multiple measurements of the same thing using the same measurement device so you can claim that all uncertainty cancels and the calculated mean is 100% accurate – it is always the true value.
It’s a holdover from your statistical training where not a single learning example ever showed the data as a “stated value +/- uncertainty” but only as a stated value!
So you just always ignore the uncertainty. That allows you to claim the sample means of a population are 100% accurate and the standard deviation of the sample means defines the uncertainty of the mean calculated from the sample means.
“Taylor specifically shows what happens when one of the values is exact, and that’s regardless of whether it’s a constant or not. “
Taylor shows how to scale uncertainty when you are moving from a measurement of a stack of the same thing to just one of those things. You *STILL* can’t get this straight! If the uncertainty of the measurement of 200 objects that are identical then the uncertainty of each individual object is total uncertainty divided by 200. But the example SPECIFICALLY states that each of the individual objects have to be identical and have the same individual uncertainty! Yet you continually ignore that restriction!
MC was right. You continually cherry-pick formulas that you hope prove you are right but you *never* take the time to understand what the context of the formula actually is!
If those 200 objects are *NOT* identical with identical uncertainty then total-uncertainty divided by 200 will *NOT* tell you the uncertainty of each individual object. How you can not understand that is just amazing!
“Of course it’s a measured value – how else do you know what it is.”
It is *NOT* a measurement! It is a count with no uncertainty! You COUNT how many elements you have, you don’t measure them.
Wow! You are really grasping here!
“why Taylor uses fractional uncertainty in the section “measured quantity times exact number”.”
As usual you DIDN’T BOTHER to read the text leading up to the equation!
—————————————————
According to the rule (3.8), the fractional uncertainty in q = Bx is the sum of the fractional uncertainties in B and x. Because ẟB = 0 this implies that
ẟq/ |q| = ẟx / |x|
——————————————————– (bolding mine, tg)
Since ẟB = 0 it does not contribute to the uncertainty of the functional relationship! THAT’S TRUE FOR ANY FUNCTIONAL RELATIONSHIP WITH A CONSTANT!
Uncertainty is only associated with measurements and not with constants! The uncertainty of a constant is *ALWAYS* zero!
“Taylor shows how to scale uncertainty when you are moving from a measurement of a stack of the same thing to just one of those things.”
Yes, that’s one example.
“You *STILL* can’t get this straight! If the uncertainty of the measurement of 200 objects that are identical then the uncertainty of each individual object is total uncertainty divided by 200.”
And for some reason you think this rule doesn’t apply if you are calculating the mean of different sized things. The rule is the rule, the maths, the logic and the statistics are the same. All you need to know is you have a thing with an uncertainty and you multiply it by an exact number. You keep getting bogged down in the details. You think that if an example is not exactly the same as another problem it must be of no use to the problem.
“But the example SPECIFICALLY states that each of the individual objects have to be identical and have the same individual uncertainty!”
Yes, because he want’s to say he’s found the thickness of an individual sheet of paper rather than the average thickness. He does not say they all have to have the same uncertainty. That makes no sense as you are not measuring the individual sheets.
“If those 200 objects are *NOT* identical with identical uncertainty then total-uncertainty divided by 200 will *NOT* tell you the uncertainty of each individual object. How you can not understand that is just amazing!”
Indeed it won’t. What it will tell you is the uncertainty of the mean thickness of the sheets.As you keep saying, you have to read these things for understanding.
“It is *NOT* a measurement! It is a count with no uncertainty! You COUNT how many elements you have, you don’t measure them.”
Your desperation to find excuses for why you can’t use the equation is really contradictory. You accept the 200 sheet example. You accept that 200 can be used in this case, yet by your definition it isn’t a measure and so shouldn’t work. Yet you are quite happy to use the count in the equation for adding and subtracting, despite that also requiring all values are measures.
“Wow! You are really grasping here!”
“MC was right. You continually cherry-pick formulas that you hope prove you are right but you *never* take the time to understand what the context of the formula actually is!”
Cherry-picking formulas is an odd concept in maths. Either the formula are right or not. If you are are saying there a multiple formulas that can be used to calculate the uncertainty of the mean, and they all give completely different results, then that does not say very much for the subject.
I’ve used different formulas, this one you wanted me to use in the first place, Taylors special case for exact numbers, the general partial differential equation in the GUM CM was so keen for me to use. And I’ve tested this experimentally, and I’ve thought through the problem terms of errors and uncertainty, and all cases it comes back to the simple observation – the uncertainty of a mean can not be greater than the uncertainty of the individual elements. It’s just a mathematical impossibility.
BZZZZZZT!
-70 points
This identifies your background as a mathematician and not an engineer or scientist. Formulas are only correct if the basic assumptions and conditions are met for using that formula. If the basic assumptions and conditions are not satisfied, then the formula will not predict the correct values.
Do you know what sensitivity analysis is? This is a concept taught to all people who deal with physical phenomena. Its primary purpose is to determine how well the basic assumptions and conditions are being met. Uncertainty is a fundamental property of dealing with this.
V = IR is a basic formula. However, it only works if “I” is truly what you think it is and if “R” is exactly what you think it is. Analysis of DC circuits is pretty easy. Not so much when AC is introduced.
“This identifies your background as a mathematician and not an engineer or scientist”
Thanks, but I have to keep denying I’m a mathematician, it’s an interest not a profession with me. If you want a real mathematician talk to Monckton, he’s even proved the Goldbach Conjecture.
“Formulas are only correct if the basic assumptions and conditions are met for using that formula.”
As any mathematician will tell you. But the accusation wasn’t that I was misapplying an equation, it was that I was cherry-picking one. That implies there is more than one applicable equation which will give completely different result, and I’m choosing the one that agrees with observation, rather than the one that makes uncertainties increase with sample size.
“If the basic assumptions and conditions are not satisfied, then the formula will not predict the correct values.”
Correct, but you have to show the assumptions don’t apply to my chosen equation, but do apply to yours. The only claim I’ve seen regarding this is that you can only use the equation for propagating uncertainties when multiplying, if all the values are measured, and that the number of items in a sample is not a measured value. But this assumption is contradicted by Taylor who uses the equation with an exact number, with an example involving the count of sheets in a stack.
So either you have to say Taylor is wrong and doesn’t understand his own conditions, or more likely you are wrong to say a count is not measure.
Sorry if that’s thinking too much like a mathematician. What little I learnt from studying it was how to work through a problem rather than accepting what’s written in a book.
Cherry picking is scanning something for a formula that looks right and ignoring all the assumptions and conditions.
You want to prove you haven’t cherry picked, show references with the conditions required to use it.
“Cherry picking is scanning something for a formula that looks right and ignoring all the assumptions and conditions.”
It isn’t. No wonder you have problems accepting Monckton’s pause is a type of cherry picking.
“You want to prove you haven’t cherry picked, show references with the conditions required to use it.”
I was using Taylor (3.8) “Uncertainty in Products and Quotients (Provisional Rule)”
The only requirements is that you are multiplying or dividing “measured” quantities with small uncertainties. It’s claimed that the number of samples is not a measured quantity and so this rule doesn’t apply. I can’t find any formal definition of “measured” in Taylor. So let’s say you are right and he means to exclude anything that involves counting from that equation. T
hat’s not a problem because I can advance to equation (3.9) “Measured Quantity Times Exact Number”, derived from (3.8). Here there is no mention of an exact number such as (1/N) being excluded, on the contrary it’s what this equation is all about. You have the measured quantity x with known uncertainty, and B which has no uncertainty.
In our case we have x the sum of temperatures with the uncertainty of the sum and B the exact value (1/100) which has no uncertainty. All conditions met.
Of course, if you cannot accept the count as a measured quantity, then Tim’s numerous attempts to fit it into (3.4) or (3.16) must also be wrong as that requires all quantities to be measured.
HAHAHAHAHA—guess who was yapping about dogs and bones—the irony is too much, help me!
“As usual you DIDN’T BOTHER to read the text leading up to the equation!”
As usual you are taking my quotes out of context or mixing up different things.
That was in response to you claiming that a count is not a measured value, and I pointed out that Taylor treats it as such.
In Taylor’s special case for multiplying by an exact number, B is an exact number , and by your logic not a measure, yet Taylor shows how the equation you insist only works for measurements and not exact values, leads to the equation involving B, and exact measurement.
You accuse me of not reading Taylor correctly, but all you do is highlight the part where Taylor says ẟB = 0. So I’m still not sure what your point is. Is B a measured value or an exact value. Does it being an exact value mean it can’t be used in that equation, i.e. the one specifically called “Measured Quantity Times Exact Number”.
As usual you keep trying to find one word that you thinks will invalidate all of Taylor’s arguments without understanding the point you are trying to make.
“Since ẟB = 0 it does not contribute to the uncertainty of the functional relationship! THAT’S TRUE FOR ANY FUNCTIONAL RELATIONSHIP WITH A CONSTANT! “
We are not talking about the uncertainty of the relationship, but of the result. You keep insisting that B cannot contribute to the uncertainty of the result, when that’s specifically what the equation says it does.
“ Is B a measured value or an exact value. “
B is an exact value = 200
Again, that is a shorthand way of writing the uncertainty for identical objects with identical uncertainty.
And you somehow think this applies to temperatures?
“We are not talking about the uncertainty of the relationship, but of the result. You keep insisting that B cannot contribute to the uncertainty of the result, when that’s specifically what the equation says it does.”
How does ẟB = 0 possibly add to the uncertainty! We went down this road before and you can’t seem to get it straight.
ẟx1 + ẟx2 + … + ẟx200 is the exact same thing as 200ẟx as long as you have identical objects with identical uncertainty – just as Taylor noted in his text! Again, if you ever bothered to actually work out the chapter questions this would become rather obvious. Stop cherry-picking equations you hope will back you up. Actually study them till you understand them!
Define 200 = B and you get Bẟx!
There still isn’t any uncertainty in B so it can’t affect the overall uncertainty!
Again, it’s just a shorthand way of writing
ẟx1 + ẟx2 + … + ẟx200
so ẟy = ẟx1 + ẟx2 + … + ẟx200
Which would you rather write out?
ẟy = ẟx1 + ẟx2 + … + ẟx200, or
ẟy = 200ẟx?
As a general formula in a textbook you would usually generalize this to ẟy = Bẟx so B could be anything. 200 identical pieces of paper. 500 identical 3/8″ washers. 6 identical pieces of copper flashing. B still won’t have anything to do with what the uncertainty is. That will remain ẟx!
“B is an exact value = 200”
In the equation it can be any exact value. Pi, 1/200 are examples used.
“Again, that is a shorthand way of writing the uncertainty for identical objects with identical uncertainty.”
What are you on about now. Which equation are talking about? I was talking about Taylor (3.9) which is nothing to do with being a short hand for writing B lot’s of identical x’s.
“And you somehow think this applies to temperatures?”
I think (3.9) applies to any measured value that is multiplied by an exact number. I see nothing where Taylor says this can be used with any measured value as long as it’s not a sum of temperatures.
“ẟx1 + ẟx2 + … + ẟx200 is the exact same thing as 200ẟx as long as you have identical objects with identical uncertainty – just as Taylor noted in his text!”
Could you provide that quote. Obviously it’s a true and pointless observation if you are multiplying by an integer. Not sure how it applies if you are multiplying by 1/200 or pi.
“Again, if you ever bothered to actually work out the chapter questions this would become rather obvious.”
Any particular question that will reveal what Taylor really meant?
“Stop cherry-picking equations you hope will back you up. Actually study them till you understand them!”
By cherry picking you mean using the appropriate one for the appropriate case and using the step by step procedure Taylor describes. As opposed to trying to combine addition and division, constantly getting mixed up between absolute and fraction uncertainties, and looking for any loophole you can find that stops you having to admit that the uncertainty of the mean is not the uncertainty of the sum.
“B still won’t have anything to do with what the uncertainty is. That will remain ẟx!”
The equation says the uncertainty is equal to Bẟx. Apart from not understanding fractions, why do you think B is not changing the uncertainty?
And exactly WHY was this statement made?
If you click on the part where it says “Reply to” you can see exactly which comment I was replying to. That should make it clear. But in case you are too lazy to do that, it was in response to you calling my statement
BS.
The implication was that my claim is justified by at least one source.
I’m done trying to educate you, it is quite impossible.
There is a reason for this statement, Herr Doktor Expert, and if you really understood something of the subject, you would know it immediately.
Try. You claim something I said was BS and showed I had no understanding. I presented evidence that my statement was correct and ask you to explain where I’m wrong, and your response is I wouldn’t understand if you told me.
In my experience such a response is usually made by someone who knows they are wrong, but can’t admit it.
Goody, ask me if I care that you think that I think I’m wrong.
Uncertainty is not error.
Averaging does not reduce uncertainty.
The AVERAGE UNCERTAINTY IS NOT THE UNCERTAINTY OF THE AVERAGE!
Why is this so hard to understand?
Did you not even bother to look at the calculation I gave you?
The average uncertainty is:
(δ1 + δ2 + … + δn) / N
The uncertainty of the average is
(δ1 + δ2 + … + δn + δN)
Since δN is zero (since it is a constant) it does not contribute to the total uncertainty and it doesn’t lessen it either.
The average consists of a sum divided by a constant. The propagation of error involves summing the individual uncertainties.
Total uncertainty equals average uncertainty multiplied by N. And it is total uncertainty that also applies to the average since division by a constant does not add or subtract any uncertainty from the total.
Again, if you put 100 boards, each with an individual uncertainty, the total uncertainty is the sum of the individual uncertainties. You can calculate an AVERAGE UNCERTAINTY but all that does is spread the uncertainty evenly across each individual element. The total uncertainty remains the same!
The average uncertainty simply tells you nothing. It doesn’t tell you the uncertainty of each individual element. It doesn’t tell you the variance of the uncertainty distribution. it doesn’t tell you the total uncertainty. All it does is give you a way to calculate the total uncertainty using δavg * N instead of actually having to add up all the individual uncertainties!
Tell us EXACTLY what you think the average uncertainty tells you!
Do you *really* think the average uncertainty will be what you get when you build a spanning beam using the 100 boards?
And, once again, you fail to address how you handle variance when adding individual random variables which is what temperature or multiple boards represent. To you the variance goes down when you combine multiple random variables instead of up!
Why do you think the mid-point of the range all of a sudden becomes more accurate? Answer: Because, as usual, you assume all uncertainty is random and symmetrical which causes cancellation!
You simply don’t know that the true value is the mid-point. The true value could be anywhere between 23.10 and 23.20. ANYWHERE! The average is just one more stated value. It’s uncertainty interval is the entire uncertainty interval.
Stated value equals 23.15 and the uncertainty interval is +/- 5.0.
Again, the uncertainty value only goes down if the errors are totally random and symmetrical. Otherwise the uncertainty does *NOT* cancel and the entire interval applies.
“The AVERAGE UNCERTAINTY IS NOT THE UNCERTAINTY OF THE AVERAGE!”
Correct. I’d stop there if I were you.
“Did you not even bother to look at the calculation I gave you?”
Yes, and they’re wrong. That’s the whole point of my comment. Inevitably you fail to understand what I’m trying to explain to you, and just repeat your own incorrect calculations.
“The average uncertainty is:
(δ1 + δ2 + … + δn) / N”
Correct.
“The uncertainty of the average is
(δ1 + δ2 + … + δn + δN)”
Incorrect. As I explained to you.
“The average consists of a sum divided by a constant. The propagation of error involves summing the individual uncertainties.”
And you still ignore the fact that when you are dividing you have to use fractional uncertainties.
“Yes, and they’re wrong. That’s the whole point of my comment. Inevitably you fail to understand what I’m trying to explain to you, and just repeat your own incorrect calculations.”
You are explaining NOTHING! You can’t even tell the difference between a constant and an independent variable. Your explanations are nothing but delusions you stubbornly hang on to!
“Incorrect. As I explained to you.”
You explained NOTHING! You don’t even understand what a functional relationship is. You apparently think in the equation y = mx that m somehow contributes to the uncertainty in y!
You’ve at least somehow stumbled into the fact that you ADD fractional uncertainties but you can’t seem to correctly apply it! The uncertainty of the average is *NOT* the sum of the uncertainties of the elements divided by N but the sum of the uncertainties of the elements added with the fractional uncertainty of the number of elements, a constant. The fractional uncertainty of N is ZERO so it doesn’t add to the uncertainty of the average!
Therefore the uncertainty of the average is the propagated uncertainty of the individual data elements!
The uncertainty of the average is *NOT* the same thing as the average uncertainty!
The average uncertainty is the sum of the data elements uncertainties divided by the number of elements. It’s only use is to evenly distribute the total uncertainty across all elements. You can therefore get the total uncertainty by using ẟavg * N instead of having to add each individual uncertainty – although you have to do that anyway in order to get the average uncertainty! .That does *NOT* lessen the total uncertainty of the average!
“You explained NOTHING! You don’t even understand what a functional relationship is. You apparently think in the equation y = mx that m somehow contributes to the uncertainty in y!”
Obviously I didn’t explain it well enough for you to understand. Let me try one more time as slowly as possible.
You start with the equation
y = mx
and want to know how it’s possible for m to contribute to the uncertainty of y if the uncertainty of m is zero. The answer is because when you propagate uncertainty in values that are multiplied or divided the fractional uncertainties add. This means, using δ to indicate the absolute uncertainty, the formula for the uncertainty is
δy / y = δm / m + δx / x
Do you at least agree on that part?
Now, if δm = 0. This becomes
δy / y = 0 / m + δx / x
so
δy / y = δx / x (1)
At this point you say, that m has disappeared and so can make no further contribution to the uncertainty equation. And that’s where you make your mistake.
Remember, we know from the first equation that
y = mx
which means we can substitute mx for y in equation (1), hence
δy / (mx) = δx / x
And now we note that both sides of the equation have a division by x, so multiplying through by x gives
δy / m = δx
and multiplying through by m gives
δy = m δx
Just as Taylor says.
“The answer is because when you propagate uncertainty in values that are multiplied or divided the fractional uncertainties add.”
What is the fractional uncertainty of “m”, a constant?
“δy / (mx) = δx / x”
“δy = m δx”
So what’s your point? That is not the same as saying “δy is δx/m.
Uncertainty is *larger* with your derivation, not less! δy is not the average uncertainty either.
If you are going to substitute for y then do it for x as well.
ẟy/y = ẟx/x
ẟy / mx = ẟx / (y/m) = mẟx/y
Rearranging gives yẟy = xẟx(m^2)
so ẟy = xẟx(m^2) / y
What does that tell you?
You substitution makes no real sense. Neither does mine. It only confuses what is actually happening!
ẟy/y = ẟx/x is the simplest form and intuitively makes it easy to see what is happening!
When you substitute for y and then rearrange you ruin the fractional relationship of the uncertainties for x and y.
According to Dr. Expert here, the answer depends on the constant!
He doesn’t understand that if a value is given with no uncertainty interval then it *is* considered a constant and doesn’t contribute to the propagation of uncertainty. If a constant is given with an uncertainty interval then that uncertainty *has* to be included in the uncertainty analysis. If the uncertainty interval is much smaller than the resolution of the measurements involved then it probably can be ignored and treated as an exact number. But that *has* to be stated explicitly!
“He doesn’t understand that if a value is given with no uncertainty interval then it *is* considered a constant and doesn’t contribute to the propagation of uncertainty.”
Fine. If that’s your definition of constant I’ll unpick my nit. I was thinking in terms of a constant as an immutable value, N is the size of the sample and the equation can be used with any value N.
None of this has any relevance to the fact that you are wrong to claim it doesn’t contribute to the propagation of the uncertainty.
“So what’s your point? That is not the same as saying “δy is δx/m.
Uncertainty is *larger* with your derivation, not less! δy is not the average uncertainty either. ”
This really shouldn’t be this difficult for you to understand.
It depends on what the value of m is. If it’s greater than 1 than δy > δx. If it’s less than 1, than δy < δx.
If we apply this to the average of 100 thermometers, than m = 1/100, and so δy is 1/100th the size of δx.
If you are not comfortable with multiplying something by less than 1, you could have started this by saying
y = x / m
And going through the same process we would have
δy = δx / m
“so ẟy = xẟx(m^2) / y
What does that tell you?”
It tells me you don;t know how to simplify an equation.
“ẟy/y = ẟx/x is the simplest form and intuitively makes it easy to see what is happening!”
Obviously it doesn’t or you wouldn’t have such a hard time understanding it. Yes, it says exactly the same thing. The proportion of ẟy to ẟx has to be the same as between y and x. If y is 10 times the size of x, then ẟy is 10 times the size of ẟx. If y is equal to x divided by 100, then ẟy is 1/100th the size of ẟx.
Rearranging as I and Taylor do, makes the relationship clearer, and I hoped would help you to understand where m comes into the equation.
“It depends on what the value of m is. If it’s greater than 1 than δy > δx. If it’s less than 1, than δy < δx.”
You have totally changed the definition of FRACTIONAL UNCERTAINTY when you rearrange the equation!
If “m” is a part of the uncertainty then you should have a factor of ẟm/m in the equation. “m” shouldn’t appear in the uncertainty equation through substitution!
The uncertainty equation for y = mx is ẟy = ẟm + ẟx. Fractional uncertainty does not come into play! ẟm = 0 so ẟy = ẟx.
If y = x/m then the equation is *still* ẟy = ẟm + ẟx because “m” is not a variable!
You use fractional uncertainty when you have multiplication or division by multiple MEASUREMENTS, i.e. variables!
I.e, ẟy/y = ẟx/x
You do not substitute for y in the fractional uncertainty equation.
You’ve already admitted that fractional uncertainties add and then you violate that by including m without including ẟm!
Consider: when m = 0 then ẟy/mx becomes undefined. Thus ẟx/x is undefined. Your substitution doesn’t work for all cases. You’ve just made ẟy = 0 when the actual uncertainty of x may not be zero at all! You’ve just turned a random variable with uncertainty into one with no uncertainty! Do you *really* think that is possible in the real world?
“You have totally changed the definition of FRACTIONAL UNCERTAINTY when you rearrange the equation!”
Then so has Taylor.
“If “m” is a part of the uncertainty then you should have a factor of ẟm/m in the equation.”
It does, but as it’s zero it quickly disappears.
““m” shouldn’t appear in the uncertainty equation through substitution!”
Why?
“The uncertainty equation for y = mx is ẟy = ẟm + ẟx.”
Citation required. And then you can explain why you think Taylor is wrong.
“You use fractional uncertainty when you have multiplication or division by multiple MEASUREMENTS, i.e. variables!”
You still haven’t explained why you think N isn’t a measurement nor explained why you think Taylor is wrong to treat an exact number as a measurement.
“You’ve already admitted that fractional uncertainties add and then you violate that by including m without including ẟm!”
Nothing in that sentence makes sense.
“Consider: when m = 0 then ẟy/mx becomes undefined. Thus ẟx/x is undefined.”
Yes it’s undefined. Did you need me to specify that m is not zero. If m is zero the fractional uncertainty of m is also undefined. But you don’t really need an equation to know what the uncertainty of something multiplied by zero is. Note that if m is zero, so is y.
“Do you *really* think that is possible in the real world?”
Does Taylor? He doesn’t mention that B cannot be zero. Do you have a real world application where a measurement has to be multiplied by zero.
HAHAHAHAHAHAHAHA—please, don’t stop now, Shirley there are more nuggets of non-wisdom in the top hat!
Are you going to tell Tim that Taylor is wrong?
I find it amusing that you’ve now latched onto this fractional uncertainty bone as if it proves something.
It proves that you are wrong – but obviously you would have to understand the simple algebra to see that.
“Again, if you put 100 boards, each with an individual uncertainty, the total uncertainty is the sum of the individual uncertainties.”
No. You said it above. If the uncertainties are random the total uncertainty is square root of the sum of squares of the uncertainty.
“And it is total uncertainty that also applies to the average since division by a constant does not add or subtract any uncertainty from the total.”
Illogical gibberish.
“The average uncertainty simply tells you nothing. It doesn’t tell you the uncertainty of each individual element.”
I’m not interested in the average uncertainty. We are talking about the uncertainty of the average. You said above they are different.
“Tell us EXACTLY what you think the average uncertainty tells you!”
Again, I’m not interested in the average uncertainty. The uncertainty of the average tells you the uncertainty of the average.
As I’ve mentioned many times, this is a little complicated because usually you are interested in the uncertainty of a sample mean with regard to the population mean. But in your case you are only talking about the measurement uncertainty, so that measurement uncertainty is telling you how much uncertainty there is in the sample mean. I.e. treating the mean as an exact average rather than as a sample of the mean.
“Do you *really* think the average uncertainty will be what you get when you build a spanning beam using the 100 boards?”
Average uncertainty is not the uncertainty of the average.
And in neither case is this going to be the same as the sum of 100 boards. If I have 100 boards and I know the average length is 1 ± 0.01m. Then I would expect the total length of the boards to be 100 ± 1m.
And now you are going to nitpick what method you are going to use in adding the uncertainties? The major point is that the uncertainty GROWS in both methods, it just grows faster with direct addition than with root-sum-square!
Unfreakingbelievable! You finally get around to admitting that fractional uncertainties add and then you turn around and say the fractional uncertainty of a constant is not zero! Meaning the fractional uncertainty of an average is the only sum of the fractional uncertainties of the individual data elements since the fractional uncertainty of a constant is zero!
But you can’t seem to admit that the uncertainty of the average doesn’t depend on the number of data elements but only on the sum of the uncertainties of the individual data elements! The number of the data elements doesn’t change the uncertainty of the average other than if you add more data elements the sum of the uncertainties of the data elements GROWS!
Your delusion that adding more data elements decreases the uncertainty of the average ONLY applies in one restrictive situation – the uncertainty must be random and symmetrical otherwise you don’t get total cancellation and adding data elements *will* grow the uncertainty of the average!
Meaningless word salad. The uncertainty of the sample mean is the sum of the uncertainties of the individual data elements making up the sample. The uncertainty of the sample mean is *NOT* zero, that sample mean is *NOT* 100% accurate. It is “stated value +/- uncertainty”
When you combine the sample means you simply can *NOT* ignore the uncertainty of the sample means. Although that *is* what you and the climate scientists all do! You all assume the uncertainty of the sample mean is zero so you can ignore it.
Therefore the standard deviation of the sample means is *NOT* the uncertainty in the mean estimated from combining the sample means. You have to propagate the the uncertainty of the sample means into the mean calculated from the sample means. The standard deviation of the sample means only tells you how precisely you have calculated the mean of the sample means as determined by the spread of the sample means. Even if the standard deviation of the sample means is zero it doesn’t mean that the the mean calculated from the sample means is 100% accurate since you still have to propagate the uncertainty of the sample means forward as well!
So what I said is correct? Why are you arguing about it still?
So in other words you are finally admitting I am correct about how you handle uncertainty? You get the EXACT same uncertainty from multiplying the average uncertainty by the number of boards that you would get from adding the uncertainties of the individual boards! In fact, in order to find the average uncertainty you have to have already added up all the individual uncertainties! So why not just use that sum!
The final uncertainty would *NOT* be ẟavg/N. And the final uncertainty is *not* ẟtotal/N.
Now, come back and tell me once again that I am wrong!
The UAH certainly falls into this group, they don’t propagate uncertainty, and Spencer failed to grasp the importance of Pat Frank’s model uncertainty paper.
And yet bdgwx thinks we all believe UAH data has no uncertainty.
It isn’t whether or not there is uncertainty, it is an issue of which data set has the largest/smallest uncertainty.
TG said: “And yet bdgwx thinks we all believe UAH data has no uncertainty.”
Hardly. I’m one of the few on here that is having to constantly remind people that Christ et al. 2003 say the uncertainty on the monthly anomalies is ±0.20 C.
A number that you quote endlessly, and, if you knew anything about real-world metrology, you would immediately see that it is essentially zero and quite bogus.
Which is wider than the differential value trying to be identified! So how do you actually determine the differential?
It’s actually worse for the surface data sets.
Which makes *all* of it pretty much useless!
If you have a +/- 0.20C uncertainty then how do you distinguish a .13C change per decade? That’s well within the uncertainty interval meaning you actually don’t know if the number is correct or not!
“But you can’t seem to admit that the uncertainty of the average doesn’t depend on the number of data elements but only on the sum of the uncertainties of the individual data elements! The number of the data elements doesn’t change the uncertainty of the average other than if you add more data elements the sum of the uncertainties of the data elements GROWS!”
I don’t admit it because it’s wrong and you’ve done nothing to explain why you think I’m wrong. You just keep asserting the number of elements don’t change the uncertainty of the mean, and that increasing sample size increases the uncertainty. I’ve discussed exactly why you think that and why you are simply misunderstanding the equations. You never try to understand or dispute my points – you just assert I’m wrong and repeat your beliefs.
“Your delusion that adding more data elements decreases the uncertainty of the average ONLY applies in one restrictive situation – the uncertainty must be random and symmetrical otherwise you don’t get total cancellation and adding data elements *will* grow the uncertainty of the average!”
And more assertions. I’ve explained that systematic errors, that is if the mean of the error distribution is not zero will not cancel. You keep confusing this with the idea that the distribution has to be symmetric, which is at least better than your previous assertion that it had to be a Gaussian distribution. But as I’ve also explained this does not mean the uncertainty of the average will grow as sample size increases.
Again this seems very simple and obvious. If each measurement has a random error based around a distribution, than as the number of samples increases, the mean of these errors will trend to the mean of the distribution. If that is zero than they will tend to zero, if the mean is not zero it will tend to that mean. In neither case will the uncertainty grow as sample size increases.
“I don’t admit it because it’s wrong and you’ve done nothing to explain why you think I’m wrong. “
I’ve showed you OVER AND OVER AND OVER AGAIN, why you are wrong!
The average uncertainty *ONLY* spreads the uncertainty evenly over all the data elements. It does *NOT* lessen the uncertainty of anything! In fact it just hides the actual uncertainty of the individual data elements.
If y = ax + bw + cz where a, b, and c are constants
then ẟy = ẟx + ẟw + ẟz + ẟa + ẟb + ẟc.
Of course ẟa, ẟb, and ẟc are all zero so the total uncertainty is ẟx + ẟw + ẟz.
The *average* uncertainty is (ẟx + ẟw + ẟz)/3 but that is *NOT* the uncertainty of the average!
the Value 3 is a constant. It has no uncertainty. If you do the uncertainty analysis of the average uncertainty you get
ẟavg = ẟx + ẟw + ẟz + ẟ3 = ẟx + ẟw + ẟz
Note carefully that “3” is not a variable so you do *NOT* use fractional uncertainties although it wouldn’t make any difference if you do since ẟ3/3 is still zero and fractional uncertainties do add as even you admit!
So the uncertainty of the average is the sum of the uncertainties of the individual elements!
tg: “other than if you add more data elements the sum of the uncertainties of the data elements GROWS!””
bellman: “You just keep asserting the number of elements don’t change the uncertainty of the mean”
No, I stated specifically that if you add data elements with uncertainty then the total uncertainty GROWS.
“increasing sample size increases the uncertainty”
It *does*! Since the total uncertainty is the sum of the uncertainties of the elements there is no way the uncertainty can’t grow. Even root-sum-square grows as you add more and more elements!
You keep trying to say that Taylor, Chapter 3 is wrong in everything it has. His rule 3.4 states:
If several quantities x, … , w are measured with uncertainties ẟx, …, ẟw, and the measured values are used compute
q = x + … + z – (u + … + w)
then the uncertainty in the computed value of q is the sum,
ẟq ≈ ẟx + … + ẟz + ẟu + … + ẟw,
of all the original uncertainties.
Divide both sides by N in order to get the average value. Since N appears on both sides it cancels and contributes nothing to the uncertainty of the average!
“I’ve showed you OVER AND OVER AND OVER AGAIN, why you are wrong!
The average uncertainty *ONLY* spreads the uncertainty evenly over all the data elements.”
You keep wondering why despite repeating yourself over and over again I don’t accept it, and then go on to repeat the same mistake I keep having to correct for you. We are not talking about the average uncertainty but the uncertainty of the average.
“If y = ax + bw + cz where a, b, and c are constants
then ẟy = ẟx + ẟw + ẟz + ẟa + ẟb + ẟc.”
Read a book on uncertainty, Taylor for instance. You do not add the absolute uncertainties when multiplying values. If I’m wrong quote an actual reference that does what you are doing.
“Note carefully that “3” is not a variable so you do *NOT* use fractional uncertainties although it wouldn’t make any difference if you do since ẟ3/3 is still zero and fractional uncertainties do add as even you admit!”
You still haven’t read Taylor section 3.4 have you. If you have point to the part where he says you do not use fractional uncertainties when multiplying or dividing by an exact number.
“You keep trying to say that Taylor, Chapter 3 is wrong in everything it has.”
More lies. I’m saying he is correct. I’m saying your misunderstanding of it is wrong.
“His rule 3.4 states”
Which is the rule for adding and subtracting. It’s the header of that equation “Uncertainties in Sums and Differences (provisional rule)”.
“Divide both sides by N in order to get the average value.”
You’re not dividing both sides by N. If q is the mean you only want to divide the right side by N.
“Since N appears on both sides…”
It doesn’t. Really, this isn’t difficult. I’m sure you could understand it if you didn’t have such a vested interest in not understanding it. It’s all explained in Taylor.
q = (x1 + … + xN) / N
That’s your mean that is. (Not
q / N = (x1 + … + xN) / N
That would just be saying the mean is the same as the sum.)
How do you propagate the uncertainty. Taylor explains (section 3.8) how to do this you. You have to do it step by step, each step involving just one of the different types. You can not combine summing and division in one step. Do the summing first, as we agree about that, then plug that uncertainty into the propagation of the uncertainty using division. And as N has no uncertainty we can use the first special case for the division, or work it out from the rules for division – as I’ve explained to you previously.
“Again this seems very simple and obvious. If each measurement has a random error based around a distribution, than as the number of samples increases, the mean of these errors will trend to the mean of the distribution.”
And we are back! Since you are measuring different things using different measuring devices you simply cannot assume that you have a random, symmetrical distribution of uncertainty!
You don’t even know whether there is any systematic uncertainty in each data point let alone what its value might be! Each data element could have different systematic uncertainty values! So how would those cancel?
You keep assuming that you are measuring the same thing multiple times using the same device. Therefore you can get a set of random uncertainty values based around the mean of the uncertainty distribution!
Again, when you combine independent, random variables you ADD THEIR VARIANCES. That is *exactly* what you do with uncertainty! And since each sample is made up of independent, random values the variance of the sample is the variance of each data element summed together! The more data elements you add to the sample the greater the total variance will be.
Variance is a direct indication of uncertainty. As variance grows the uncertainty grows as well. So when you add all those sample means together you have to add their variances together as well in order to get the total variance – i.e. their uncertainty.
*YOU* want to assume that the variance of the sample is ZERO. Meaning a very peaked distribution where the mean is very accurate. That’s simply not how it works. The more elements you have the higher the variance – meaning the distribution gets flatter and flatter. The flatter it is the higher the uncertainty.
You can lead a horse to water but you can’t make him drink. You are the horse when it comes to uncertainty! You simply will not drink but just remain as stubborn as a mule in your delusions.
“And we are back! Since you are measuring different things using different measuring devices you simply cannot assume that you have a random, symmetrical distribution of uncertainty!”
It doesn’t matter if different things in your population have different distributions. The mix of all the different distributions will be a distribution. And a random sample of measurement errors drawn from this combined distribution will have a mean that tends to the mean of this distribution, and if that mean is zero that’s what it will tend to. It does not have to be symmetric, it just has to have a mean of zero.
If I’m wrong, you tell me what the mean of the measurement errors will tend to, given a variety of different distributions. Better yet, actually test your faith,write a simulation with a variety of different distributions and see what happens.
“You don’t even know whether there is any systematic uncertainty in each data point let alone what its value might be!”
Indeed you don’t, any more than if you measure the same thing with the same instrument.
“Each data element could have different systematic uncertainty values! So how would those cancel?”
How would a systematic uncertainty value cancel if you are measuring the same thing with the same instrument?
“You keep assuming that you are measuring the same thing multiple times using the same device.”
As lies about what I’m assuming go, that has to be the most bizarre.
“Again, when you combine independent, random variables you ADD THEIR VARIANCES.”
Yes if by combining them you mean by adding.
“That is *exactly* what you do with uncertainty!”
Yes, when you add values together with independent uncertainties you add using the square root rule their uncertainties. That’s how the principle is derived.
“And since each sample is made up of independent, random values the variance of the sample is the variance of each data element summed together!”
Yes. If you want to know the variance of the SUM of all values in your sample that is correct.
“The more data elements you add to the sample the greater the total variance will be.”
Yes, if all you are doing is SUMMING your sample.
“So when you add all those sample means together you have to add their variances together as well in order to get the total variance – i.e. their uncertainty.”
How many more times are you going to say this before you get on to taking an average?
“*YOU* want to assume that the variance of the sample is ZERO.”
That’s stinking pile of lies. The variance of the sum of a sample is the sum of the variances. If you ever get on to talking about the mean you will find it requires dividing by the sample size, just as for uncertainty. But that still means the variance of the mean of the sample will be greater than zero.
“Meaning a very peaked distribution where the mean is very accurate.”
I see you’ve just changed to talking about the mean with no mention of how you combine the variances in that case. But if I’m assuming the variance is zero, why would there be any peaked distribution. It’s always zero. Just a vertical line.
“Meaningless word salad.”
If you don;t understand it, why not just ask for a clarification.
“The uncertainty of the sample mean is the sum of the uncertainties of the individual data elements making up the sample.”
What’s the point of just endlessly repeating this. You know I think it’s wrong, you’ve read all the times I’ve explained why it’s wrong. Why not quote an actual source that agrees with you?
“The uncertainty of the sample mean is *NOT* zero, that sample mean is *NOT* 100% accurate. It is “stated value +/- uncertainty””
Agreed. I don’t know why you keep telling me this.
“When you combine the sample means you simply can *NOT* ignore the uncertainty of the sample means.”
No idea what you are trying to say here. Why are you combining sample means?
“Therefore the standard deviation of the sample means is *NOT* the uncertainty in the mean estimated from combining the sample means.”
Ditto.
“What’s the point of just endlessly repeating this.”
Because it’s true but you won’t believe it!
ẟy = ẟx1 + ẟx2 + ẟx3 + ……
The more elements you have the higher the uncertainty gets!
And since N is a constant with no uncertainty it simply can’t affect the uncertainty of the average. The uncertainty of the average remains the sum of the individual uncertainties!
It’s why when you build a beam out of multiple boards the uncertainty of the final length grows with each board added.
The uncertainty is *not* the average uncertainty, Nor is it the total uncertainty divided by the number of boards. Nor is it the total uncertainty divided by the square root of the number of boards. The uncertainty *is* the sum of the uncertainty of each individual board.
And, again, the more boards you have to use in the beam the larger the uncertainty of the final length will be.
I hope I *never* have to actually use anything you have designed. Not a bridge, not a lawn chair, and especially not a safety razor. Your inability to grasp the fact that uncertainties add makes you dangerous if your job is to design *anything*.
“ẟy = ẟx1 + ẟx2 + ẟx3 + ……”
See, you just repeat it again and hope if you repeat it often enough someone will believe it’s true.
“And since N is a constant with no uncertainty it simply can’t affect the uncertainty of the average.”
I’ve explained in enough detail why this is wrong. Either you don;t understand the algebra, or the concept, or you don’t want to admit you made a mistake. Or you are trolling now.
“It’s why when you build a beam out of multiple boards the uncertainty of the final length grows with each board added.”
Do you never realize that in all these examples you are talking about the sum, not the average.
“I’ve explained in enough detail why this is wrong”
You can’t even refute my simple math. Here it is again!
q = x_1 + x_2 + … + x_n
Eq 1: q_avg = (x_1 + x_2 + … + x_n) / n
Eq 2: ẟq_avg = ẟx_1 + ẟx_2 + … + ẟx_n + ẟn where ẟn = 0
Eq 3: So ẟq_avg = ẟx_1 + ẟx_2 + … + ẟx_n
Now calculate average uncertainty:
Eq 4: avg_u = (ẟx_1 + ẟx_2 + … + ẟx_n) / n
Eq 3 and Eq 4 are NOT THE SAME!
Uncertainty of the average is *NOT* the same thing as the average uncertainty.
It is the uncertainty of the average (Eq 3) that is of interest since it is what gets propagated forward from samples and not the average uncertainty!
Prove me wrong!
I’ve already said where you are wrong here:
https://wattsupwiththat.com/2022/06/01/uah-global-temperature-update-for-may-2022-0-17-deg-c/#comment-3530086
“And, once again, you fail to address how you handle variance when adding individual random variables which is what temperature or multiple boards represent.”
You keep trying to being in these distractions, in order to avoid your obvious errors. What variances are you talking about? The variance in measurements, or in the sample?
Assuming you are talking about the variance in the sample, that’s what I keep trying to get you to understand. The uncertainty (if you want to call it that) in the sample mean is given by the standard error of the mean, which is the standard deviation of the sample divided the square root of the sample size (again, assuming the sample is random and has no biases).
“ To you the variance goes down when you combine multiple random variables instead of up!”
No it doesn’t. And stop saying I say things I don’t.
It is *NOT* a distractor! Variances are handled in the same manner as uncertainty. If you don’t understand how variance is handled when combining independent, random variables then you will *never* understand how uncertainty is handled.
Measurements have uncertainty, not constants. The measurements making up a sample have uncertainty and that uncertainty *must* be propagated onto any mean calculated from the individual elements of the sample – UNLESS – you can prove that the uncertainties form a distribution that is random and symmetrical and that is very hard to do when you have individual measurements of different things using different measurement devices.
And now we are back, once again, to assuming that the means of the samples are 100% accurate with no uncertainty. You keep confusing precision and accuracy. Are you *EVER* going to understand the difference? Even if the standard deviation of the sample means is ZERO it doesn’t mean that their combination is accurate!
The sample means are “stated value +/- uncertainty”. The uncertainty value is the sum of the uncertainties of the individual elements making up the sample. *YOU* and the climate scientists all assume that the uncertainty piece of the mean is ZERO, i.e. that sample mean is 100/% accurate. Therefore you don’t have to propagate any uncertainty in the sample mean forward into the mean of the sample means. Thus the standard deviation of the sample means becomes the error of the mean.
It is a common malady among statisticians that have no real world experience with metrology and whose only training comes from statistics books that never attach any uncertainty to the data values used in their examples. All data is 100% accurate so the mean of the data is 100% accurate.
“No it doesn’t. And stop saying I say things I don’t.”
Variance and uncertainty get treated EXACTLY the same when combining random variables. If you believe that uncertainty goes down then you *MUST* believe that variance also goes down when you combine random variables. If you believe that variance adds when combining random variables then you MUST believe that uncertainty adds when combining random variables.
You are a perfect example of cognitive dissonance!
How can you assume that when combining independent, random variables you ALWAYS get a random distribution of uncertainty that is symmetrical and therefore cancels? How can you assume that there is no systematic bias in any of the independent, random measurements of different things using different measuring devices?
What possible justification do you have for these assumptions?
From:
https://intellipaat.com/blog/tutorial/statistics-and-probability
Here is another web page to read.
AP Statistics: Why Variances Add—And Why It Matters | AP Central – The College Board
“σ(w)^2 = a^2σ(x)^2 + b^2σ(y)^2”
Correct. Now what do you think a and b are in that equation, and how would you use them to compute the variance of a mean?
If you had read the site, you would understand what “a” and “b” are.
Perhaps this from the page will help you understand.
It was a rhetorical question. I’m trying to get you to understand that when you take the mean of random variables, you do not simply add all the variances. The mean is aX + bY, where a = b = 1/2. Therefore your equation means that
var(mean) = a^2var(X) + b^2var(Y)
= (1/4)var(X) + (1/4)var(Y)
= (Var(X) + Var(Y)) / 4
Today’s statistics lecture was given by Herr Doktor Profesor bellcurveman, who thinks that temperature measurements are random samplings
Another straw man. If you had the least confidence that you were correct, you would debate with what I’ve said rather than your own lies. I have never said temperature measurements in any global reconstruction are random samplings. This has absolutely nothing to do with the comment you are disagreeing with.
You know what I said was correct, or else you’d explain where it was wrong. So instead you just resort to sub-Moncktion snearing and hope people will mistake that for an argument.
I don’t “debate” with clickbait trollsters such as you and your fellow blockhead.
Keep telling yourself this, add it in with all the other nonsense you believe.
Third attempt to goad me—FAIL.
You won;t debate with me because you think I’m a troll, but you do feel the need to respond to my every comment. Has nobody ever told you not to feed the troll.
My choice, I stayed out of last month’s G & J show.
Your obsession with random number generators aptly demonstrates you have no knowledge of what a real-world UA is about.
Nobody is talking about a real world UA – I’m certainly not. But if you can’t even understand the difference between the variance of a sum and of a mean, I doubt your own real world analysis will be very useful.
Today’s lie was brought to you by Carlo, Monte who is an expert in making statements with zero evidence.
I know the answer, and as I’ve told you multiple times, I’m done attempting to educate you.
Sort it yourself.
“I know the answer, but it goes to a another school.”
OK, bellcurveman has drifted off into the gray haze.
So the web site Intellipaat is not correct? Why don’t you leave a comment on the page why it is wrong and what it should show. I bet they’ll want to update their Data Science course also. All you have to do is add a comment at the bottom of the page I show. I’ll watch for it!
Why do you think it’s incorrect? Please be specific as as far as I could see it’s correct and agrees with me.
Everything follows from
var(mean) = a^2var(X) + b^2var(Y)
which I thought you agreed with. Note they say that this becomes
σ(X+Y)^2 = σ(x)^2 + σ(y)^2
only in the case when a = b = 1. That is when you are just adding without weight.
Why would you weight station data when they all have the same number of entries? Weighting is only appropriate when each random variable has different sizes.
I thought I explained this. You are taking a mean not just adding temperatures. That means if you have 100 thermometers you add them all and divide by 100. This is the same as giving each thermometer a weight of 0.01.
I really am not sure why you and the others have so much difficulty with variance. It’s not like uncertainty which can have different vague definitions, it’s a straightforward process to work out the variance. You can easily generate multiple sets of random numbers, add them together and see what the variance is, then take the means and see what the variance is.
Nice admission that you have zero clues about uncertainty.
“That means if you have 100 thermometers you add them all and divide by 100. This is the same as giving each thermometer a weight of 0.01.”
This is true for the STATED VALUE! It is *NOT* true for their total uncertainty! Do this with the uncertainties and you wind up with the average uncertainty which you’ve already admitted is useless!
“I really am not sure why you and the others have so much difficulty with variance”
No one has any difficulty with variance other than you. You refuse to admit that variance adds when you combine random, independent variables – which is what uncertainty *is*.
“You can easily generate multiple sets of random numbers, add them together and see what the variance is, then take the means and see what the variance is.
In order to find variance you *first* have to find the mean! You can’t just add random numbers together to get the variance.
If you generate one set of data, find its variance and then generate another set of data and find its variance, when you combine them into one data set THE VARIANCES ADD. Just like they do with uncertainty!
Let me provide you two quotes from this site:
https://www.middleprofessor.com/files/applied-biostatistics_bookdown/_book/variability-and-uncertainty-standard-deviations-standard-errors-confidence-intervals.html
The “standard error of the sample means” you are so fond of quoting IS A MEASURE OF PRECISION and is *NOT* a measure of accuracy.
The measure of accuracy is the propagated uncertainty of the sample means.
Let me also provide a quote from
https://www.ncbi.nlm.nih.gov/pmc/articles/PMC3387884/
“Even if the terms error and uncertainty are used somewhat interchangeably in everyday descriptions, they actually have different meanings according to the definitions provided by VIM and GUM. They should not be used as synonyms. The ± (plus or minus) symbol that often follows the reported value of a measurand and the numerical quantity that follows this symbol, indicate the uncertainty associated with the particular measurand and not the error.”
Note carefully the use of the word “measurand” in singular form and not in plural form.
If he was to admit this is true, he could no longer divide by root(N), which is he prime directive needed to give meaning to his cherished temperature trends.
Unfortunately for him, this is like averaging dandelion seeds and stardust.
“If he was to admit this is true, he could no longer divide by root(N)”
I get it. You have a phobia about dividing anything by root(N), and only want to multiply by it. Maybe you find long division too hard. But trying to ignore the rules for variances, just to avoid having to do it seems a bit extreme.
Phobia?
HAHAHAHAHAHAHAHAHAHAAH
Just give it up, you blockheads are just digging your hole deeper and deeper.
You had him pegged long ago – a troll of major proportions. I’m sorry I tried for so long to educate him. I will no longer reply to his gibberish and idiocy since he’s just admitted he is not interested at all in the real world.
You can lead an ass to water but you can’t make him drink,.
Good. If you think I’m a troll just ignore me. I’ve wasted far too much times trying to explain simple algebra from your own preferred text book. Only for you to ignore everything I’ve said and just repeat your mistakes. If you want to believe you can use the wrong rules of propagation to get a result that defies common sense and is demonstrably wrong, go ahead. In future I might just point to me previous comment that details the correct way of doing it for the benefit of any lurker.
But, please, stop with these petty ad hominems and homilies. (And I’m talking to myself as much as you here) It really does neither of are arguments any good. Neither of us are educating the other. We are trying to explain our respective positions and maybe learning something from the other. At least you try to explain your position even if it never seems to take on board anything I’ve said. I’ve always tried to address your points, and very occasionally changed my views based on them. There’s little point having a debate if we just frame the other as a ass in need of education.
A phrase my Dad was fond of (he was from Wyoming).
Unlike bgwx, it is clear to me that bellman is not a honest person. bgwx is a True Believer in whatever it is that he believes (hard to pin down). After reading some of the exchanges between bellman and Christopher Monckton, it was obvious there is history here—bellman goes apoplectic whenever Monckton is mentioned.
“After reading some of the exchanges between bellman and Christopher Monckton, it was obvious there is history here—bellman goes apoplectic whenever Monckton is mentioned.”
There’s certainly a lot of bad blood between us.I can’t think of any occasions where I’ve actually gone apoplectic, but sometimes it can be difficult what is being said seriously here.
My dislike of him may have something to do with the fact he called me “feeble minded” the first time I posted here, to point out an inconsistency in his argument. Since then he’s continuously thrown out libelous and offensive ad hominems at me. But I dislike him for other reasons, both as a person and as an advocate. I think his arguments are weak and if I was doubtful of climate change he would be the last person I’d want arguing my cause.
Still it is fun debating with him, and for all the smearing he does sometimes engage in an argument. And there is something flattering to be insulted by an actual nob.
“This is true for the STATED VALUE! It is *NOT* true for their total uncertainty! Do this with the uncertainties and you wind up with the average uncertainty which you’ve already admitted is useless!”
What STATED VALUE? You want to combine some random variables to see what the variance of the AVERAGE is. And for probably not the last time, you do not end up with the average uncertainty, you do not end up with the average variance, you end up with the variance of the average.
“No one has any difficulty with variance other than you. You refuse to admit that variance adds when you combine random, independent variables – which is what uncertainty *is*.”
First of all variance is not what uncertainty is. Standard uncertainty is expressed in terms of the standard deviation – it’s the square root of the variance.
Secondly, you are wrong. I know that might not mean much to you but I’ve told what the correct answer is and I’ve repeatedly told you how to demonstrate to yourself that you are wrong The fact that you consistently refuse to test your understanding with real random variables, whilst instead insisting that something you once read and misunderstood in a book speaks volumes.
So, one more time – you can;t just say combine random variables without saying how you are combining them. Any more than you can say you are combining numbers without saying how you are combining them. You need to know how you are combining them in order to know what the equation will be for the variance.
Jim has already given you the equation. If Z = aX + bY, where X and Y are random variables and a and b are constant weights, then
Var(Z) = a^2 * Var(X) + b^2 * Var(Y).
If you want Z to be the sum of X and Y, then a = b = 1, and that equation becomes
Var(Z) = Var(X) + Var(Y).
But if you want Z to be the mean of X and Y, then a = b = 0.5, and the equation for variance is
Var(Z) = 0.25 * Var(X) + 0.25 * Var(Y). = (Var(X) + Var(Y)) / 4.
Do you see the difference?
HAHAHAHAHAHAHAHAH
The expert speaks again, and face-plants:
Have you EVER read ANY of the GUM?
Evidently not.
So you are saying variance is the same as uncertainty.
So the uncertainty of a measurement in cm should be give in cm^2? The uncertainty of a velocity should be given in km^2/s^2? Why do you think the gum says it’s more convenient to use standard deviations, then the square of a deviation. Hint, what do you think the words “dimension” and “more easily comprehended value” mean?
I guess you don’t care about a fundamental property, not a surprise.
And yes, it is possible to state the uncertainty of velocity in these units. Maybe you can explain why it isn’t possible, Herr Doktor?
I’ve spent much of the last few days caring about variance, that’s why I’m trying to get you to calculate it properly.
Of course you can express uncertainty in any form you want, it’s just not very useful, and misleading if you don’t realise the quoted uncertainty is the square of the normal value.
Maybe Tim should have started by saying you have 100 thermometers each with an uncertainty of ±0.25°C^2.
Variance is not uncertainty. Variance is a value that can be calculated, uncertainty is not a value, it is an interval.
They are treated similarly because they are related. The higher the variance the smaller the “peakedness” of the distribution of the stated values. The “flatter” the distribution is the wider the interval the “true value” might lie in.
So even though they aren’t the same they are treated the same. Each grows when you add random, independent variables (i.e. temperatures) into the data set.
It is possible to express it in variance, but highly non-standard. The GUM is all about formulating a standard way of expressing it (ergo the title), but it is not and end-all be-all treatise on the subject.
CM said: “The GUM is all about formulating a standard way of expressing it (ergo the title), but it is not and end-all be-all treatise on the subject.”
It was you who said “Without a formal uncertainty analysis that adheres to the language and methods in the GUM, the numbers are useless.”
It is the primary reason why started adopting the language and methods in the GUM when discussing uncertainty on the WUWT site.
When are you going to start?
Oh, and I find it quite amusing that you clowns are compelled to keep detailed records of everything I post.
And of course you missed the essence of my comment.
“It is possible to express it in variance, but highly non-standard.”
Oh, I agree. My only point was to show they are related, not that they are equivalent. Being related they should be handled in the same manner. When combining random variables (no uncertainty) the variances add. When combining random variables (with uncertainty) the uncertainties add.
Average uncertainty is useless mental masturbation – I know of no use for it in the real world.
Absolutely, I’ve never seen it used.
There is a simple thought example that should put this 1/root(N) nonsense to rest (but no doubt won’t):
Consider a series of slowly varying values:
0.1, 0.2, 0.3, 0.4, 0.5 …
The average of the first 5 is of course 0.3; however each value has a high uncertainty of ±2.5. According the resident experts, with enough values accumulated, the uncertainty of the average is reduced to ±0.8 with just ten values, ±0.25 with 100, and ±0.08 with 1000. Yet each individual value can be anywhere inside ±2.5, especially if they have a hidden bias that shifts them away from 0.3.
The GUM is really not a lot of help in solving this.
I don’t know whether to laugh or cry at this point.
“In order to find variance you *first* have to find the mean! You can’t just add random numbers together to get the variance.”
You know what the mean of each random variable because you decided what it is. If you roll 6 sided dice the mean is 3.5. If you generate numbers from a standard normal distribution is 0.
“If you generate one set of data, find its variance and then generate another set of data and find its variance, when you combine them into one data set THE VARIANCES ADD. Just like they do with uncertainty!”
So do it and see for yourself.
I did, but you don’t have to take my word for it.
I generated 10000 pairs of numbers from a standard normal distribution. Variance of each random variable is 1.
Adding each pair and calculating the variance of the 10000 sums and the answer was as close to 2 as makes no odds.
Doing the same but averaging the pairs, and the variance was approximately 0.5.
I repeated it with sets of 4 numbers. Summing gives a variance of approx 4, averaging approx 0.25.
BFD, the square root of one is still …. wait for it … one.
Well done.
Even spookier, the square of one is, guess what? Hows that for a coincidence.
Wait till he finds out what the cube root of one is.
And of course you dance around and avoid the significance of the number…
At this point I’ve gone from thinking you are troll to wondering if you are clinically insane. If you think you have a point say what it is, rather than playing 20 questions.
Another PeeWee, good job, put another gold star on your dunce cap.
“Variances are additive but standard deviations are not. This means that the variance of the sum of two independent (uncorrelated) random variables is simply the sum of the variances of each of the variables. This is important for many statistical analyses.””
I’ve highlighted the operative word there.
OK, you can pin a gold star on your dunce cap.
“It is *NOT* a distractor! Variances are handled in the same manner as uncertainty.”
That’s why it’s a distraction. If by variance you just mean the variance in the measurements, you are just going to repeat all the same mistakes you make with uncertainty.
“And now we are back, once again, to assuming that the means of the samples are 100% accurate with no uncertainty.”
And now you are back to making up stuff about what I’m saying. It doesn’t matter when looking at the variance of a sample, what causes the variance. It can because all the things you are sampling vary, it can be that they are all the same but your measurements are inaccurate, or it could be a combination of the two. I am not making any assumptions.
“Even if the standard deviation of the sample means is ZERO it doesn’t mean that their combination is accurate!”
How many more times do I have to tell you, yes I know.
“The sample means are “stated value +/- uncertainty”.”
You keep talking about the sample means, and I still don’t know what you think that means. In my scenario there is only one sample, it has one mean.
“The uncertainty value is the sum of the uncertainties of the individual elements making up the sample.”
And foul is fair and fair is foul. You are wrong and it doesn’t matter how many times you repeat it, it will still be wrong.
“*YOU* and the climate scientists all assume that the uncertainty piece of the mean is ZERO, i.e. that sample mean is 100/% accurate.”
The whole point of determining the standard error of the mean is to show that this is not correct. And sampling uncertainty may not be the only source of error. Nobody who knows anything about about collecting a sample should be unaware of that.
You keep assuming that just because you start with an idealized case where all sampling can be considered random independent and un-biased, it means that people assume that’s true for all or any real world cases.
“Therefore you don’t have to propagate any uncertainty in the sample mean forward into the mean of the sample means.”
I still don’t know what sample means you are talking about. I’m sure this makes sense to you, but you need to define your terms.
Another glaring statement that indicates you have no clues about what uncertainty is (and isn’t).
“And now you are back to making up stuff about what I’m saying. It doesn’t matter when looking at the variance of a sample, what causes the variance.”
Talk about a distractor! The issue isn’t what causes the variance, the issue is how you handle variance when combining independent, random variables!
“How many more times do I have to tell you, yes I know.”
Then why do you keep on stating that the standard deviation of the sample means is the uncertainty of the mean calculated from the sample means? Why do you drop the uncertainty of the sample means? Why do you assume those uncertainties are all zero?
“You keep talking about the sample means, and I still don’t know what you think that means. In my scenario there is only one sample, it has one mean.”
If you have 1000 data elements and you pull 10 samples of 50 data elements then you will have 10 sample means.
Each of the data elements in each sample will have “stated value +/- uncertainty” entries. Those +/- uncertainty intervals *must* be propagated onto the appropriate sample mean.
So those 10 sample mean will be “stated value +/- propagated uncertainty”.
Any mean calculated from those sample means *must* have the associated uncertainty values propagated onto it. The standard deviation of those sample means is *NOT* the uncertainty of that calculated mean. The propagated uncertainty of the sample means is the uncertainty of the calculated mean.
You *always* drop those propagated uncertainties and claim the standard deviation of the sample means is the uncertainty of the average of the sample means. In other words you *always* just assume that all the uncertainty of the individual data elements cancel out and don’t need to be considered!
“And foul is fair and fair is foul. You are wrong and it doesn’t matter how many times you repeat it, it will still be wrong.”
See what I mean? You *always* assume the uncertainties of the individual data elements cancel and don’t need to be considered!
“The whole point of determining the standard error of the mean is to show that this is not correct.”
The standard deviation of the sample means only determines how precisely you have calculated the population mean. It is *NOT* the uncertainty of the population mean!
You *STILL* don’t understand the difference between precision and accuracy. The standard deviation of the sample means can be ZERO (high precision) while still being INACCURATE as all git out! I don’t think you are *ever* going to be able to understand this and this means you will never understand how to handle uncertainty! Uncertainty defines accuracy, not precision.
“And sampling uncertainty may not be the only source of error.”
This has exactly ZERO to do with sampling error. It has to do with the uncertainties associated with the individual data elements!
“You keep assuming that just because you start with an idealized case where all sampling can be considered random independent and un-biased, it means that people assume that’s true for all or any real world cases.”
Temperatures which measure different temperatures and different places using different measurement devices *are* a combination of random, independent, UNCERTAIN elements!
This has *NOTHING* to do with sampling. It has to do with uncertainty. STATED VALUES +/- UNCERTAINTY.
Why you continue to want to ignore the uncertainty of measured values is just totally beyond me. It is an indication of someone who knows nothing of the real world and has only lived in academia their entire life. My guess is that you’ve never done so much as put together a lawn chair from Home Depot and had to contend with the uncertainty of the mounting holes of the chair arms to the seat and back! You probably have exactly zero idea of how to handle those uncertainties – for you the assumption would be that all the uncertainty cancels and no adjustments in construction techniques would be required! I can only imagine the frustration you would incur!
“I still don’t know what sample means you are talking about. I’m sure this makes sense to you, but you need to define your terms.”
When you take multiple samples from a population how do you handle them? Do you calculate the mean of each sample and then calculate the population mean by averaging the sample means? Or do you always take only one sample and just assume it will always be a good description of the population?
I don’t buy your excuse that you don’t understand. If that is truly the case then you *really* need to study the subject some more!
“When you take multiple samples from a population how do you handle them? Do you calculate the mean of each sample and then calculate the population mean by averaging the sample means? Or do you always take only one sample and just assume it will always be a good description of the population?”
I’ve still no idea why you want to keep doing this, but the mean of multiple samples will be the same as the mean of one sample combining all the individual samples.
“Variance and uncertainty get treated EXACTLY the same when combining random variables. If you believe that uncertainty goes down then you *MUST* believe that variance also goes down when you combine random variables.”
I do believe that, if by combining you mean averaging.
“Why do you think the mid-point of the range all of a sudden becomes more accurate? Answer: Because, as usual, you assume all uncertainty is random and symmetrical which causes cancellation!”
It’s your example. You said
“Each and every different temperature measuring location is an individual random variable. Thus, when you combine them, you add their variances.”
I assumed by variance here you were talking about measurement errors.
“You simply don’t know that the true value is the mid-point.”
Of course you don’t. That’s the point of uncertainty.
“The true value could be anywhere between 23.10 and 23.20. ANYWHERE! The average is just one more stated value. It’s uncertainty interval is the entire uncertainty interval.
Stated value equals 23.15 and the uncertainty interval is +/- 5.0.”
You’re saying the true value could be ANYWHERE between 23.10 and 23.20, but you think the uncertainty interval should be 18.15 to 28.20?
“Again, the uncertainty value only goes down if the errors are totally random and symmetrical.”
And again, you are wrong. Errors do not need to be symmetrical for the uncertainty to reduce to zero. I spent far to long last month trying to explain, with worked examples, why that is the case.
“Otherwise the uncertainty does *NOT* cancel and the entire interval applies.”
And you still don;t understand why this is wrong. Suppose I measure every length of wood with a ruler that adds 1cm to the result and has no other error. I.e. nothing but a systematic error. If I add up 100 pieces of wood like that the total uncertainty will be 100cm, but the uncertainty of the average will and can only be 1cm, not 100cm.
Uncertainty is NOT error!
I bet you have that tattooed somewhere interesting.
I don’t care what distinction you think that makes. Reducing the combined error reduces uncertainty.
You realize my comment was replying to Tim’s “Again, the uncertainty value only goes down if the errors are totally random and symmetrical.”. For some reason you don;t point out to him that “Uncertainty is NOT error!”.
That you continue to be confused about the two is evident from this statement:
He’s so confused that he can’t even keep track of his own assertions. First he says fractional uncertainties add and then he says they don’t if the element is a constant, then it multiplies or divides the total uncertainty. First he says variances add and then he says they don’t, they average instead. Then he says that the uncertainties in all measurements data sets cancel and then he says they don’t. First he says that uncertainty is always random and symmetrical and cancels and then he says they don’t. First he says the average uncertainty is not the uncertainty of the average and then he says it is. First he says the standard deviation of the sample means measures the accuracy of the average of the sample means and then he says it doesn’t.
He’s a true troll – saying whatever he has to say in order to get more replies. It makes him feel like an “expert” I guess.
“First he says fractional uncertainties add and then he says they don’t if the element is a constant, then it multiplies or divides the total uncertainty.”
Perhaps if you made an effort to understand what I’m saying, or just read your precious Taylor, you;d understand why this isn’t inconsistent.
You can add fractional uncertainties, you can do what ever you like with them. All I’m saying is that when you propagate uncertainties caused my multiplying or dividing you do it by adding the fractional, as opposed to the absolute, uncertainties.
This is true if the element is a constant or an exact number, it’s just that the value you are adding is zero.
The very simple algebra involved in seeing why the fractional uncertainties are multiplied or divided by the exact number is obviously beyond you, so no wonder it seems inconsistent.
“First he says variances add and then he says they don’t, they average instead.”
First I say that if you are adding random variables, the variances add, then I say that if you are averaging random variables the variances average. No inconsistency, just the ability to hold more than one concept in your head.
“Then he says that the uncertainties in all measurements data sets cancel and then he says they don’t.”
First I say uncertainties in some data sets tend to cancel, but in others they don’t. No inconsistency. Just you building straw men.
“First he says that uncertainty is always random and symmetrical and cancels and then he says they don’t.”
First I don’t say anything of the sort, but using your example where you were assuming all the uncertainty was random and symmetrical, I explained why you were wrong. Then I showed why you are also wrong if you don;t assume that all the uncertainty is random and symmetrical.
“First he says the average uncertainty is not the uncertainty of the average and then he says it is.”
First I said average uncertainty in not the uncertainty of the average, then I continued saying it.
“First he says the standard deviation of the sample means measures the accuracy of the average of the sample means and then he says it doesn’t.”
First I said you could consider the standard error of the mean as being like the uncertainty of the mean, just as the standard error of a set of measurements can be used to estimate the uncertainty of the measurements. Then I might have mentioned all the caveats about bias and systematic errors. But then I never talked about the average of the sample means, because that’s some nonsense you and Jim keep going on about. The average of multiple sample means is just a one bigger sample mean as far as I’m concerned.
“He’s a true troll – saying whatever he has to say in order to get more replies.”
You seriously think I want you to bombard every comment I make with all this egregious nonsense. If you think that, you could just, you know, stop feeling the need to write so much repetitive verbiage to every one of my comments. (and yes, that applies to me as well.)
“First I said you could consider the standard error of the mean as being like the uncertainty of the mean, just as the standard error of a set of measurements can be used to estimate the uncertainty of the measurements. “
The standard error of the mean is better known as the standard deviation of the sample means. And they are *NOT* the uncertainty of the mean, either of the sample or of the average calculated from the sample means.
The standard deviation of the sample means may be zero meaning has been determined very precisely. BUT IT CAN STILL BE INACCURATE!
Somehow you just can’t seem to get that through your skull.
It is the uncertainty of the means calculated from the samples that determine how accurate the the average calculated from them actually is!
Each sample mean has a value of X +/- u_s where u_s is the uncertainty propagated from the individual elements in each sample.
If you have five samples, X1, X2, X3,. X4, and X5 then their means are X1 +/- u1, X2 +/- u2, X3 +/- u3, X4 +/- u4, and X5 +/- u5.
*YOU* want to take the uncertainty of the average of the stated values, i.e. (X1 + X2 + X3, + X4 + X5)/5, as being the standard deviation of X1, X2, X3, X4, and X5 while totally ignoring u1, u2, u3, u4, and u5. For you, u1, u2, u3, u4, and u5 all cancel out so you can ignore them.
As I keep saying, you ALWAYS assume all uncertainty is random and symmetrical and cancels. It doesn’t matter if it the uncertainty of the entire population, the uncertainty of samples of the population, or the uncertainty of the average calculated from the sample means.
For you, uncertainty may as well not even be considered. Stating the data values as X1 +/- u1, X2 +/- u2, X3 +/- u3, X4 +/- u4, and X5 +/- u5 is just a total waste of time.
Just make it X1, …, X5 and calculate their standard deviation. It’s a whole lot simpler! And its what all the climate scientists do as well so you have lots of company!
“The standard deviation of the sample means may be zero meaning has been determined very precisely. BUT IT CAN STILL BE INACCURATE!”
That’s what I said.
“Somehow you just can’t seem to get that through your skull.”
Apart from all the times I mention it, and you ignore the fact I’ve said it.
“Each sample mean has a value of X +/- u_s where u_s is the uncertainty propagated from the individual elements in each sample.”
That’s just the measurement uncertainty. For some reason you keep wanting to make the uncertainty of the mean smaller than it actually is. And, I’m sure I’ve told you this before, there is normally only one sample.
“If you have five samples, X1, X2, X3,. X4, and X5 then their means are X1 +/- u1, X2 +/- u2, X3 +/- u3, X4 +/- u4, and X5 +/- u5.”
Meaningless, as you don’t explain what these uncertainty intervals are. They could be the Standard Error of the mean, but you insist this isn’t the uncertainty, or they could just be the measurement uncertainty, but you don;t understand how to calculate it.
“*YOU* want to take the uncertainty of the average of the stated values, i.e. (X1 + X2 + X3, + X4 + X5)/5, as being the standard deviation of X1, X2, X3, X4, and X5”
No I don’t. What I want to do is forget all about combining multiple mini – samples and just take all the elements as one sample. Then calculate the standard error of the mean from that.
“For you, u1, u2, u3, u4, and u5 all cancel out so you can ignore them.”
No they don’t – it’s just not how you would calculate the standard error. If you want to estimate the standard error by taking multiple sample means and calculating the standard deviation of them then go ahead. But it’s silly as you will have a larger uncertainty owing to the smaller sample sizes, and you will need more than 5 sub samples to get a realistic deviation.
I may be thinking of bootstrapping, but this isn’t how you do it.
“As I keep saying, you ALWAYS assume all uncertainty is random and symmetrical and cancels.”
And it still remains a lie. But it’s also irrelevant to the discussion you were having. You are the one claiming you know the uncertainty of each sample, but how do you know that if there are systematic errors.
“For you, uncertainty may as well not even be considered.”
I’ve been doing nothing but considering uncertainty these last 2 years.
“Just make it X1, …, X5 and calculate their standard deviation.”
Or here’s a thought, why not combine all these samples in to one big sample, calculate the standard deviation of all the elements and then calculate the standard error from that. Then I’m not ignoring the uncertainty in each sample, I’ve just amalgamated them into one bigger pot.
“I don’t care what distinction you think that makes. Reducing the combined error reduces uncertainty.”
MC is correct. Uncertainty includes both random uncertainty as well as systematic uncertainty. Neither of these are always errors although sometimes they are. Reading a digital display is not a reading error. It is uncertainty in what the measuring device’s calibration and resolution is. One is systematic uncertainty and the other is a physical limitation.
In a perfect world the measuring device could be perfectly calibrated, within resolution limits, before each measurement. In a non-perfect world such as a field installation that is measuring temperature that just isn’t possible. It isn’t even possible to *measure* the calibration let alone adjust for it. So it becomes an unreconcilable uncertainty. No way to reduce it or even define it.
An error is something you can quantify. Uncertainty is something you can’t quantify. It is an unknown.
Add in temperature and time, and it grows.
That’s a point that even I sometimes forget. Thanks for the reminder!
And how can you assume the total variance of each individual, random variable being combined goes to zero?
You said: ““But if you then divided this sum by 100 to get the average you also have to divide the uncertainty by the same. So that if the sum was 2315 ± 5.0°C, the mean will be 23.15 ± 0.05°C.””
You do *NOT* divide the uncertainty by 100. The uncertainty interval remains +/- 5.0C. You are calculating the AVERAGE UNCERTAINTY and you’ve already admitted that the average uncertainty is *NOT* the total uncertainty!
You can’t even remain consistent within just a few posts!
The mean will be 23.15 +/- 5.0C or 23.10 to 23.20.
You have to be able to *PROVE* that the errors cancel! You can only prove this either by adding them all up *OR* by assuming that they are random and symmetrical.
You *always* just assume that they cancel so you don’t have to worry about them! Assuming that the uncertainties of independent, random variables *always* cancel just violates the need to be able to prove that is the case! It’s the same thing as assuming the total variance of combining independent, random variables *always* winds up being zero. It’s just not possible in most cases. In fact, the only case would be if the variance of all the random, independent variables is zero!
You’ve already admitted that the average uncertainty is *NOT* the total uncertainty. To get the total uncertainty from your average of 1cm you would have to multiply by 100 and wind up right back where you started – 100cm of uncertainty!
The average uncertainty is only useful for spreading the total uncertainty evenly across all data members, thus masking the actual uncertainty of each individual data member. Thus you actually LOSE information when you calculate an average uncertainty. Averages are a statistical description, they are *NOT* actual measurements. If you go pick a board at random from from a pile whose average uncertainty is 1cm, what do you actually know about the *real* uncertainty in the measurement of that board? Each of those boards are an independent, random variable with its own uncertainty interval (i.e. variance). *YOU* want to keep trying to drive its uncertainty interval to the average value – which simply doesn’t make any sense in the real world. That’s why carpenters *always* measure each individual board as it is used, they don’t just assume an AVERAGE uncertainty will always apply to each board!
In addition, assuming that the average uncertainty will always drive to zero because of cancellation thus leaving the average as the “true value” for all of the boards is even worse!
“And how can you assume the total variance of each individual, random variable being combined goes to zero?”
It’s difficult to assume anything when I don’t know what you are talking about. You still refuse to say how you are combining the random variables. The variance of an individual random variable will not change however you combine it. The variance of a combination of random variables will do different things depending on who you combine them. If you are combining them by taking their average, the variance will tend to zero as the numbers increase (provided they are independent, i.e the covariance is zero).
“You do *NOT* divide the uncertainty by 100.”
Oh, yes you do!
(repeat ad infinitum)
“You are calculating the AVERAGE UNCERTAINTY and you’ve already admitted that the average uncertainty is *NOT* the total uncertainty!”
I’m calculating the uncertainty of the average, and the whole point is that that is different to the uncertainty of the sum.
“You can’t even remain consistent within just a few posts!”
Quite possibly, it’s been a long weekend and trying to argue with all your comments is like fighting a hydra. I’m sure I’ve made mistakes. But try considering that my apparent inconsistency is caused by your inability to focus on what I’m saying.
“The mean will be 23.15 +/- 5.0C or 23.10 to 23.20.”
Is that a typo, or are you admitting the uncertainty range is not actually ±5?
“You have to be able to *PROVE* that the errors cancel! You can only prove this either by adding them all up *OR* by assuming that they are random and symmetrical.”
I’m not wasting my time trying a formal mathematical prove involving random variables. If you can’t see that the average will tend to the average of the distribution, I doubt any formal proof will be accepted. I’ve demonstrated this with simulations, but I know how you react to them.
“You’ve already admitted that the average uncertainty is *NOT* the total uncertainty.”
You trying to argue with cheap point scoring, which would be bad enough if your points made any logical sense. I really don’t know why you think I’ve ever denied that the average uncertainty is not the total uncertainty. You are the one who keeps claiming the uncertainty of the mean is the same as the uncertainty of the sum.
The point you are trying to evade here, is that even if all uncertainties were caused by a systematic error the uncertainty of the mean would only be that systematic error, not that error multiplied by the sample size.
“100cm of uncertainty”
In the sum, not the average.
“The average uncertainty is only useful for spreading the total uncertainty evenly across all data members…”
How many more times? We are not talking about the average uncertainty, but the uncertainty of the average. If you assume all the errors might be systematic they will be the same, but if they are random, as in your original example they will be different. E.g. you start with each thermometer having an uncertainty of ±0.5°C. That is the average uncertainty. The uncertainty of the average (again with the assumption of randomness) will be ±0.05°C. Not the same.
“Thus you actually LOSE information when you calculate an average uncertainty.”
You don’t lose ANY information unless you throw it away. And if you do, it doesn’t matter if you calculate the uncertainty of the average, the average uncertainty, or the uncertainty of the sum, you still lose just as much information.
“If you go pick a board at random from from a pile whose average uncertainty is 1cm, what do you actually know about the *real* uncertainty in the measurement of that board?”
Why would I do that, why would I care. Remember your original example assumes all the uncertainties are the same.
“*YOU* want to keep trying to drive its uncertainty interval to the average value – which simply doesn’t make any sense in the real world.”
I’m not worried about any one board. The point of this was to determine the uncertainty of an average of many boards. The uncertainty interval of a single board is what it is. Averaging it’s length with many boards will not change that individual board’s uncertainty interval.
“That’s why carpenters *always* measure each individual board as it is used, they don’t just assume an AVERAGE uncertainty will always apply to each board!”
Really? You are saying a carpenter will measure the same board multiple times in order to determine the uncertainty interval for that board. Why would you assume that each board has a different uncertainty interval? Surely the uncertainty is defined by the tape measure, not the individual board.
Its ok, you have lots of company in this delusion, you aren’t alone in this error.
“I’m calculating the uncertainty of the average, and the whole point is that that is different to the uncertainty of the sum.”
When you divide the sum of the uncertainties by the number of data elements you *are* calculating the average uncertainty. There is simply no way around that.
And the average uncertainty is *NOT* the uncertainty of the average. How many times do we have to go over this?
The average uncertainty is (ẟx_1 + ẟx_2 + … + ẟx_n) / n.
The average is (x_1 + x_2 + …. + x_n) / n
The uncertainty of the average then becomes
ẟavg = ẟx_1 + ẟx_2 + … + ẟx_n + ẟn =
ẟx_1 + ẟx_2 + … + ẟx_n
If you want to do fractional uncertainty then:
ẟavg/avg = ẟx_1/x_1 + .. + ẟx_n/n + ẟn/n =
ẟavg/avg = ẟx_1/x_1 + … + ẟx_n/x_n
The uncertainty in both methods sees the uncertainty of n fall out since it equals aero. In neither case is the average uncertainty involved nor does the average uncertainty appear in the final equations, only the average value of the data elements themselves appears when doing fractional uncertainties.
BTW, you can’t substitute for “avg” like you always try to do. Fractional uncertainty is unitless, it is a percentage.
You can’t find the actual value of ẟavg by making it have a unit.
As a percentage ẟavg is found by multiplying (ẟavg/avg) by avg and the avg value cancels leaving only ẟavg.
.
.
“When you divide the sum of the uncertainties by the number of data elements you *are* calculating the average uncertainty. There is simply no way around that. ”
But you are not dividing the sum of the uncertainties. You’re dividing the uncertainty of the sum. This is not the same thing when you are assuming independent random uncertainties, when you are taking the square root of sum of squares.
You only need to look at your own thermometer example. All have an uncertainty of ±0.5°C, so the average uncertainty is ±0.5°C. But, the total uncertainty is ±5°C, which is not the sum of the uncertainties, and the uncertainty of the average is ±0.05°C, which is not the average uncertainty.
“And the average uncertainty is *NOT* the uncertainty of the average. How many times do we have to go over this?”
I’ve no idea, because I’m not saying they are the same.
“ẟavg = ẟx_1 + ẟx_2 + … + ẟx_n + ẟn =
ẟx_1 + ẟx_2 + … + ẟx_n”
Still wrong. And it doesn’t matter how many times you repeat it, it will still be wrong.
“If you want to do fractional uncertainty then”
Read Taylor. There is both addition and division, you can’t resolve both in the same operations. You have to do it in steps.
“The uncertainty in both methods sees the uncertainty of n fall out since it equals aero.”
Only because you are doing it wrong.
“BTW, you can’t substitute for “avg” like you always try to do. Fractional uncertainty is unitless, it is a percentage.”
Why do you keep insisting Taylor is wrong.
“You can’t find the actual value of ẟavg by making it have a unit. ”
ẟavg has a unit. It’s °C.
“As a percentage ẟavg …”
It’s not a percentage, it’s the absolute uncertainty in the average. The relative / fractional / percentage is obtained from ẟavg / avg. .
” is found by multiplying (ẟavg/avg) by avg and the avg value cancels leaving only ẟavg. ”
See, you are almost there. Multiply the fractional uncertainty by the average and you get the absolute uncertainty, just as I’ve been trying to tell you.
Yeah, it’s a typo. 23.15 – 5 = 18.15. 23.15 + 5 = 28.15.
It’s a perfect example of the growth of uncertainty!
“I’m not wasting my time trying a formal mathematical prove involving random variables. “
There is no formal mathematical proof for what you are trying to assert. Variances add. It’s that simple. If you don’t believe that then you can’t just dismiss the assertion that they do. You must *PROVE* that variances of random, independent variables do *not* add.
I’m not surprised you aren’t going to do that work – because it would be fruitless!
Now you are equivocating. The issue is that the average of the distribution HAS UNCERTAINTY! And it is not just the average uncertainty, it is the uncertainty of each individual element propagated onto the average!
Because you continue to assert that it is the average uncertainty of the data elements that gets carried forward in subsequent calculations and not the total uncertainty.
stop whining.
It is the *sum* of the uncertainty that is important, not the average uncertainty.
Why do you think Taylor, Bevington, the GUM, and every internet site you can find discussing uncertainty calculates total uncertainty and never average uncertainty? You seem to be the only person in the world that is somehow stuck on average uncertainty being somehow important.
“Variances add. It’s that simple.”
A meaningless sound bite without the context. You might just as well say numbers add it’s that simple.
You want to combine two or more random values and see what the variance is of that combination. But you can’t do that if you don’t specify how you are combing them.
And in this case there is a difference between combing variable to get the sum, or to get the mean. In the first case the variances add, in the second you have to divide by the square of the number of variables.
“You must *PROVE* that variances of random, independent variables do *not* add.”
You could try proving this yourself. I’ve suggested experiments you could do throwing dice or generating random numbers on a computer. I’ve done it myself, but you will never take my word for it, and you won’t try it yourself.
Here’s a link Jim posted
https://intellipaat.com/blog/tutorial/statistics-and-probability-tutorial/sampling-and-combination-of-variables/
It talks about a weighted sum
a and b are constant weights, and if you want to find the mean of X and Y they would both be 0.5.
To determine the variance of the weighted sum we have
Note, we are not just adding the variances as you insist, each variance is multiplied by the square of its weight.
If this is the mean with a = b = 1/2, then we multiply each of the variances by the square, 1/4 before adding. This is equivalent to adding the variances and then dividing by the square of the number.
And guess what. This means the variance of the mean is less than the individual variances.
“Stop whining”—CMoB
Uncertainty is not error, averaging does not reduce uncertainty.
Who are “we”?
In that context just a general person. I could have said you or one – it’s all the same.
As I keep showing you, the uncertainty of the average *IS* the total uncertainty and not the average uncertainty. The average uncertainty is only useful is spreading an equal value of uncertainty across all data elements – a useless and wasteful exercise. The uncertainty of each data elements is not guaranteed to be the average uncertainty and that applies to the average of the measurements as well, which is actually nothing more than a single element itself!
Show me where in Taylor, Bevington, the GUM, or any other literature where the average uncertainty is used as the uncertainty of the average!
If you have systematic uncertainty in each and every element then the total uncertainty is the sum of that systematic uncertainty. And that applies to the average value as well as to the sum of the individual elements.
Average uncertainty is purely a statistical descriptor. It is useless for working in the real world where you are measuring different things using different devices. It’s why you never see average uncertainty mentioned anywhere!
Of course you do! You no longer know the variance of the data when you just have an average. That’s why the mean always has to be accompanied by the standard deviation for a normal distribution in order to know what is going on! Standard deviation is nothing more than the square root of the variance. When you calculate an average uncertainty and apply it to each of the data elements then what is the variance of the uncertainty? It’s zero because the uncertainty is the same for all elements! The standard deviation of the uncertainties is 0 so the variance is 0**2 = 0! And that is where your assumption of the mean being 100% accurate comes into play. YOU HAVE LOST DATA! And you can never get it back!
And in the case of the anomaly jockeys, they average averages two or three times extra.
“Of course you do! You no longer know the variance of the data when you just have an average.”
I keep forgetting your laptop destroys all the existing data every time you take an average.
“When you calculate an average uncertainty and apply it to each of the data elements then what is the variance of the uncertainty? It’s zero because the uncertainty is the same for all elements! The standard deviation of the uncertainties is 0 so the variance is 0**2 = 0! And that is where your assumption of the mean being 100% accurate comes into play. YOU HAVE LOST DATA! And you can never get it back!”
Why do you think it’s impressive to continually make up processes that nobody does and claim it proves something.
Does UAH report the variances or distribution of any of their data?
No.
They should. It’s one reason I don’t believe in the GAT given by *any* of them. UAH is probably more accurate than any of the surface data sets but there isn’t any real way to judge that. It’s certain the GAT predicted from the surface data sets is just totally swamped by the uncertainty that gets propagated onto it. Even if the CAGW crowd refuses to do the propagation!
I think next month it will be time to repost some of the distribution and variance data that is available from inside the UAH FTP site.
That’s not possible/ You lose all that data when you take an average.
If that is so, then your average is worse than meaningless. How many references do you need that describe the usefulness of an average without knowing the distribution from which it is derived.
If you are losing the data that is used to calculate the variance and standard deviation of your distribution, then your process is screwed beyond belief.
An example, what is the distribution of a series of data hat has an average of 50? If you have no idea because your calculation of the average destroys the data, you have a real problem.
It was a joke about how some here insist that calculating an average loses data.
“I keep forgetting your laptop destroys all the existing data every time you take an average.”
Show me a single post on WUWT by a CAGW advocate that gives even the variance of the data they post!
*YOU DON”T*!
You post graphs of average CO2 values or ENSO data and *NEVER*, not even once, post what the variance of the raw data is. You use GAT values all the time without EVER listing out what the variance of the raw data is.
“Why do you think it’s impressive to continually make up processes that nobody does and claim it proves something.”
When you refuse to propagate individual element uncertainties onto sample means you *are* doing exactly what I described. Why else would you refuse to propagate the individual uncertainties forward?
Instead he launches into computer simulations of Stats 101 sampling problems as if they prove something. Typical of climate non-scientists, when in doubt reach for a computer model to tell you what you want to know.
Bravo! Not a single statistics textbook I have, not even an introductory one written for engineers, gives examples of data sets where the data is stated as “stated values +/- uncertainty” and the uncertainty propagation is worked out.
“Show me a single post on WUWT by a CAGW advocate that gives even the variance of the data they post! ”
Just because WUWT doesn’t publish detailed accounts doesn’t mean the information isn’t available. Most of the time all you need is the average. I’m still not sure exactly what details you are looking for. Most data sets give you break downs of different areas of the earth and global grids of data. You can see the anomaly maps for UAH, GISS has a tool that can generate maps for any period or month. And you can download all the daily temperature’s for every station used in most of the sets.
My original example was to show the folly of your assertion that the average uncertainty is useful!
Why would you care what the uncertainty of each board is? Each board is a random, independent variable. Do you care what the variance is of a data set? Or is that just useless information for you? Do you *always* just assume the variance is zero?
You *should* care and you should care a LOT! You need to know if whatever you are building with that board will come up short of what you need! If it’s too long you can always cut it off but if it’s too short what do you do?
That’s why I would *NEVER* want to use anything you design and build. It’s why you would have had your pants sued off if you had actually designed anything and not cared about the individual uncertainties of the products used in the object you designed.
But if you use the average uncertainty as the uncertainty of that board then you have no justification for assuming the average uncertainty and the individual uncertainty is the same. And it is the individual uncertainty that determines if what you are building will work. So exactly what use is the average uncertainty?
Apparently you are unaware of the old adage taught to any craftsman – measure twice, cut once!
And once again you show your absolute ignorance of the real world. Have you *ever* been to a lumber yard? Have you *ever* worked in a lumber yard? Not all of the 2″x4″x8′ boards in their pile of that lumber comes from the same mill let alone the same saw batch! Tolerances can vary widely between batches depending on how the saw was set up for each batch let alone between batches from different mills! When you pick a board out of that pile you have no idea what you are getting for tolerance let alone having it the same as the average uncertainty for the pile!
“Surely the uncertainty is defined by the tape measure, not the individual board.”
Again, you simply don’t live in the real world with the rest of us. Why do you think you can just ignore the uncertainty in the length of the board in your analysis of overall uncertainty? Suppose you are designing a steel truss using multiple steel beams joined by fish plates. How will you order the fish plates if you don’t know the uncertainty of the steel beams? Are you going to have the construction crew cut and drill each individual fish plate on site?
Why don’t you join the rest of us in the real world someday?
Boards are fine for an example. But let’s discuss main and rod bearings in an F1 engine designed to turn 12,000 rpm for the duration of a race.
Do you measure all the rod journals, find the average and order similar sized bearings for all the journals? How about the main journals, do you order the average size for all the journals. No, the average is meaningless. The tolerances required are simply too small to do this.
Here is a paragraph from here:
Bearing Clearances – Engines (enginebuildermag.com)
Now how about a 4 main bearing engine where the outside mains experience more wear than the inside two because the inside ones are supported on both sides. Do I take the average and order all the same? Remember 7 ten-thousandths of an inch is pretty small but the needs are precise. Do I assume the average uncertainty is applicable for each journal where out of round may vary considerably?
Can I assume that 10% tolerance resistors and capacitors will meet the THD (total harmonic distortion) requirements in an amplifier over the specified range? I can do my calculations based on the “average” values, but will the outer ranges of components meet the requirements. This is where uncertainty hits the road. Averages don’t mean anything because it probably doesn’t even exist.
These are the details of measurements that machinists, engineers, quality control folks have to deal with. Averages simply don’t apply. In many, if not most, cases the “average” doesn’t even exist as real physical measurement.
I remember when I pointed out that the UAH baseline has a really strange multi-modal distribution and a standard deviation of many degrees (way bigger than 0.2C).
They didn’t care, big surprise.
I believe that was when you got a variance of 169 K^2 on the monthly grid and then took the 4th root of that and declared the uncertainty to be 3.6. Not only does the 3.6 figure not represent the uncertainty of the average of the grid, but the 4th root of a variance is not even a standard deviation and actually has units of K^0.5 and not K. In other words your 3.6 figure isn’t even a temperature.
BTW…taking the 169 K^2 variance of the grid actually yields a standard deviation of the grid of 13 K. And and had you done the math correctly per the procedure of for a type A method of evaluation for an average yields 13 K / sqrt(9504) = 0.13 K which is 2σ = 0.26 K and close to the type B evaluation of 0.20 K in Christy et al. 2003.
Umm, Herr Doktor Profesor, 13K >> 0.2K.
Try again, without your 1/root(N) bullshit.
CM said: “Umm, Herr Doktor Profesor, 13K >> 0.2K.”
Do you really think the standard deviation of a sample, in this case 13 K, is the uncertainty of the average of that sample?
Do you really have no brain?
“Why would you care what the uncertainty of each board is? Each board is a random, independent variable. Do you care what the variance is of a data set? Or is that just useless information for you? Do you *always* just assume the variance is zero?”
Of course the variance of the boards can be important, and of course they are not zero. Why do you keep bringing up these straw men.
“You *should* care and you should care a LOT! You need to know if whatever you are building with that board will come up short of what you need!”
But as usual you keep bringing up these pointless analogies that have nothing to do with what we are discussing. It’s been this obsession with board lengths throughout. You bring up examples where the average is not useful and then imply that this means the average is never useful. You need to use the right tools for the right job. You can’t bang in every screw with a hammer.
“It’s why you would have had your pants sued off if you had actually designed anything and not cared about the individual uncertainties of the products used in the object you designed.”
Which is why I wouldn’t do that if I were designing something. I wouldn’t set fire to it either, but that doesn’t mean fire isn’t useful.
“But if you use the average uncertainty as the uncertainty of that board then you have no justification for assuming the average uncertainty and the individual uncertainty is the same.”
Again, you telling me why things I’m not doing are things I shouldn’t do.
“Apparently you are unaware of the old adage taught to any craftsman – measure twice, cut once!”
Measuring something twice isn’t going to tell you the uncertainty interval.
“Not all of the 2″x4″x8′ boards in their pile of that lumber comes from the same mill let alone the same saw batch! Tolerances can vary widely between batches depending on how the saw was set up for each batch let alone between batches from different mills! When you pick a board out of that pile you have no idea what you are getting for tolerance let alone having it the same as the average uncertainty for the pile!”
Yes the boards vary. But you are talking about measuring each board to determine it’s uncertainty interval. It’s that I don’t get. But you’re right. I have net to no interest in buying planks of wood so maybe there is some magic you need to do with each board.I just want to know how and why you determine the uncertainty interval for each board, rather than assume it will be the same for your instrument of choice.
“Why don’t you join the rest of us in the real world someday?”
Too much like hard work if it involves constantly having to build and measure everything from scratch.
bellman: ““I’m not worried about any one board””
bellman: Of course the variance of the boards can be important, and of course they are not zero. Why do you keep bringing up these straw men.
Nothing like saying whatever you need to say at the time!
” You bring up examples where the average is not useful and then imply that this means the average is never useful. You need to use the right tools for the right job. You can’t bang in every screw with a hammer.”
You have yet to give an example where the average is useful other than to say it’s nice to know. But you can never say why it is nice to know! It’s just one more example of how far removed you are from the real world!
“Which is why I wouldn’t do that if I were designing something.”
Then why do you keep on saying it isn’t important!
“Again, you telling me why things I’m not doing are things I shouldn’t do.”
Let me repeat what you said: “bellman: ““I’m not worried about any one board”””
“Measuring something twice isn’t going to tell you the uncertainty interval.”
If you are building a stud wall and use the same measuring tape to set the height of the frame then your studs will all match the frame height, at least within nailing tolerances.
That’s why it’s important to use the same measuring device when measuring multiple things!
“Yes the boards vary. But you are talking about measuring each board to determine it’s uncertainty interval.”
No, I am talking about measuring each board to make sure it fits what you are building. You can’t even get the adage “measure twice, cut once” right!
“It’s that I don’t get.”
Because apparently you don’t live in the real world with the rest of us!
“I just want to know how and why you determine the uncertainty interval for each board, rather than assume it will be the same for your instrument of choice.”
Again, I don’t determine the uncertainty. I check each board to make sure it fits! That’s because of the uncertainty associated with each board!
It is no freaking wonder why you don’t understand any of this!
“Too much like hard work if it involves constantly having to build and measure everything from scratch.”
Unfreaking believable.
I’m done trying to educate you. You’ll *never* understand.
“You have yet to give an example where the average is useful other than to say it’s nice to know. But you can never say why it is nice to know! It’s just one more example of how far removed you are from the real world!”
Are you sure I haven’t given you lots of examples, and you’ve just forgotten them like you forget everything I say in just about every comment?
I’m mean this post was originally about the UAH global average temperature. Do you not think that’s useful? It allows us to test if the globe is warming or not. Or is Spencer just doing all this work for no useful purpose?
“Let me repeat what you said: “bellman: ““I’m not worried about any one board””””
Have you heard of thing called context? That uote was in the context of you insisting I wanted to know the average uncertainty of a board (by which I assume you mean the average measurement uncertainty). The point was trying to find the uncertainty of the average of all boards, not the average uncertainty of the boards.
“That’s why it’s important to use the same measuring device when measuring multiple things!”
In other words you don’t care about the systematic uncertainty as long as it’s consistent. That’s what I suggested you meant some time ago. But what if you actually need to know the measurement for exact reasons. Say someone has told you the height of a wall, but you don’t have their tape measure to hand?
I said: “But you are talking about measuring each board to determine it’s uncertainty interval.”
You reply: “No, I am talking about measuring each board to make sure it fits what you are building.”
You specifically said “That’s why carpenters *always* measure each individual board as it is used, they don’t just assume an AVERAGE uncertainty will always apply to each board”
“Again, I don’t determine the uncertainty. I check each board to make sure it fits! That’s because of the uncertainty associated with each board!”
But your measurement will have uncertainty in it. I’m not trying to trick you, I’m just genuinely not sure what your point is about the uncertainty of each individual board.
“It is no freaking wonder why you don’t understand any of this!”
Yes, because you keep using examples of things I have no experience of, and has no relevance to the question of the uncertainty of an average.
Disjointed attribution to a minority minority forcing, catastrophic anthropogenic climate change (e.g. social contagion, unreliables, progressive prices), and net green effect in the wild.
Bah Humbug.
The temperature for the mid-troposphere (TMT) never updated to April last month. We are still stuck in March.
All the others updated in a timely fashion.
We hope that TMT gets caught up this cycle around.
Widespread snow last night in the Colorado Rockies.
I thought global warming made June snow was a thing of the past.
No. It’s just that children won’t know what it is.
In the Pacific Northwest, West of the Cascades, it was several degrees below average.
Global averages are so meaningless.
Gavin Schmidt, in depreciating UAH, said the only temperatures that matter are those where we live.
What is the temperature in the Pacific? Despite the heat accumulated beneath the surface of the western Pacific.

No end in sight to already 2-year-old La Niña; third birthday soon…
https://tallbloke.wordpress.com/2022/05/29/weathers-unwanted-guest-nasty-la-nina-keeps-popping-up-confounding-climate-modellers/
Strengthening in November as cold water from melting sea ice to the south feeds the Humboldt Current.
Interesting.
The Humboldt current is the coldest it has been over the entire Holocene:
https://agupubs.onlinelibrary.wiley.com/doi/full/10.1029/2018GL080634
Not too warm in the Arctic.
Al Gore has been remarkably silent lately about his prediction of an ice-free Arctic by 2014…
It would be good to see the last 7 years of data graphed against version 5 of UAH software. V6 was brought online in 2015. Now go look at the graph at the top of post and see where the data suddenly changed.
Anyone who believes the last couple of years could be described as warm, NH or SH, is delusional I think. Particularly when compared to the late 90’s & the noughties!
Only in the models, even UAH, and not IRL. Let’s see what the data says on the same software that was in use BEFORE 2015.
What happens to the solar dynamo?
http://wso.stanford.edu/gifs/Dipall.gif
http://wso.stanford.edu/gifs/south.gif
http://wso.stanford.edu/gifs/north.gif
CAGW is so busted…
CMIP6 climate model projections predicted the global temp anomaly would be at +1.35C by now but we’re only at +0.17C—about 4 standard deviations devoid from reality.
What a joke.
The PDO INDEX shows the Pacific is already in its 30-year cool cycle and the AMO Index is now at 0.0C, and will also soon enter its 30-year cool cycle following the next moderate/weak El Niño cycle..
So while the silly CAGW CMIP6 model projections show ever increasing trends in glooooobal waaaaarming, reality will show flat to falling trends for the next 30+ years…
This year’s Arctic Ice extent is currently ranked the 16th lowest in 42 years, which indicates the North Atlantic Oscillation is cooling as is the entire Atlantic and Pacific.
in the not too distant future, UAH temp anomalies will be well over 2 standard deviations below the hilarious CMIP6 projections for 30+ years, at which time, the biggest and most expensive Leftist hoax in human history will be laughed into oblivion…
I hope people will finally learn that Leftism is a dangerous and evil political philosophy that can never be trusted…
SAMURAI said: “CMIP6 climate model projections predicted the global temp anomaly would be at +1.35C by now but we’re only at +0.17C—about 4 standard deviations devoid from reality.”
Not even remotely close.
[Hausfather, Carbon Brief 2019]
SAMURAI said: “in the not too distant future, UAH temp anomalies will be well over 2 standard deviations below the hilarious CMIP6 projections for 30+ years, at which time, the biggest and most expensive Leftist hoax in human history will be laughed into oblivion…”
You’ve been saying for 2 years now that the last two La Nina cycles would bring the UAH TLT anomaly down to at least -0.2 C on the 1981-2010 baseline (-0.32 C on the 1991-2020 baseline). We got nowhere close to that. How is this latest prediction here going to be any different?
bgdwx-san:
If you look closely at the CMIP6 graph you posted, the median projected anomaly is at +1.35C as of May 2022 while UAH6 is at +0.17 which is at least 4 SD devoid from reality.. oops…
You’re correct that I predicted during the current double La Niña cycle would likely hit -0.2C while it hit 0.0C…. CMIP6 predicted we’d be at 1.35C by now.. Which prediction was closer to reality?
During the next moderate/weak El Niño (El Nino’s tend to become weaker and shorter during PDO cool cycles) UAH6 will hit around +0.5C, and the following La Niña cycle will likely be a strong one (haven’t had a strong La Niña in 12 years/average is one every 10 years) which will bring it global temp anomaly down to -0.3C by 2024.
There should be noticeable cooling and brutal winters as the 30-year PDO cool cycles continues and the AMO enters its 30-year cool cycle from around 2025 coinciding with a likely strong La Niña cycle..
We’ll see soon enough..
Again, your CAGW religious cult is dying,,,, None of your cult leaders’ predictions are coming close to reflecting reality: no massive famines, no millions of CAGW refugees, no rapid rise of SLR, no Ice-free Arctic summer Ice Extents, no long-term increasing trends of: floods, droughts, hurricanes, cyclones, tornadoes, thunderstorms, tropical storms, hail, etc..
Just call it day… Leftists got it all wrong…again…at the cost of $trillions and made billions of people suffer for no reason whatsoever..
SAMURAI said: “If you look closely at the CMIP6 graph you posted, the median projected anomaly is at +1.35C as of May 2022 while UAH6 is at +0.17 which is at least 4 SD devoid from reality.. oops…”
UAH is currently on the 1991-2020 baseline while CMIP6 is on the 1881-1910 baseline. UAH normalized to the 1881-1910 baseline adds about 0.87 C to all of the values. So that 0.17 C becomes 1.04 C on the 1881-1910 baseline. Over the last 10 years UAH is at 1.03 C as compared to CMIP6 of 1.24 C. It is important to note that UAH has a ±0.05 C uncertainty on its trend. That means the 1.03 C figure itself has ±0.18 C of uncertainty which means the real value could be up to 1.21 C in the 95% confidence interval. Based on this we can only say that CMIP6’s prediction is only statistically significant at +0.03 C.
Exactly how do you transfer +/- 0.05 into +/- 0.18?
I did ((0.05 / 10 * 32) + (0.05 / 10 * 42)) / 2 = 0.185. Note that 32 and 42 are the number years after 1979 defining the last 10 years. I took the liberty of rounding down to 0.18 so as not to be accused of underestimating the difference between UAH and CMIP6.
What happened to the +/-? It appears you are assuming all of the residuals are positive and thus grow as you move through the years. That’s not how residuals between a trend line and the data actually works.
I am assuming that the residuals between the trend line and the data is what you are calling “uncertainty”. Residuals are not uncertainty and don’t sum over intervals.
That is ±. Anomalies at 32 years are ±0.16. Anomalies at 42 years are ±0.21. The 10 year average anomaly between 32 and 42 years is +0.19. Technically we would round these all to ±0.2. In such case the 95% CI envelope would extend down to 0.83 C or up to 1.23 C in which case it would only be 0.01 C away from the CMIP6 prediction. In other words the 1709 month prediction from CMIP6 is only overestimated by a nominal amount of 0.21 C or a statistically significant amount of 0.01 C. And as I said above I took the liberty of rounding down that 0.185 C figure to 0.18 C instead of applying significant figure rules specifically so that I would not be accused of underestimating the difference between CMIP6 and UAH TLT.
BTW…the CMIP6 prediction used is not of UAH TLT itself so it is technically an apples-to-oranges comparison. Don’t think that fact is lost on me. Nor is the fact that UAH TLT is a low outlier among other datasets. Again…I don’t want to be accused of underestimating the difference here.
Why do you care so much about these meaningless numbers?
CM said: “Why do you care so much about these meaningless numbers?”
I think it is important that SAMURAI and the WUWT understand what is wrong with this statement “CMIP6 climate model projections predicted the global temp anomaly would be at +1.35C by now but we’re only at +0.17C—about 4 standard deviations devoid from reality.”
SAMURAI does not think these numbers are meaningless. Nor many of the other WUWT authors and commenters who are discussing observations and predictions.
ROFL! You flipped most of us who think the numbers are meaningless into us thinking they are meaningful because we are trying to point out the holes in how GAT is calculated!
Wow! Just WOW!
SAMURAI was not challenging the meaning or usefulness of the GAT. He was challenging the skill of the CMIP6 prediction.
When have Leftists got anything right?
ANOTHER hockey stick? Is there no end to this gar-bage?
4SD? – ouch!
It’s getting absurd.
Under the scientific method, when hypothetical projections exceed empirical observations for a statistically significant duration, a hypothesis is officially disconfirmed..
An excellent case can be made the CAGW hoax has already exceeded these parameters for disconfirmstion….
CAGW hoaxers get around this by concocting absurdly manipulated global temp anomaly datasets to avoid disconfirmation..
Once BOTH the 30-year AMO and PDO cool cycles restart, CAGW is dead…
You do realize CMIP6’s 1709 month prediction (which is nowhere close to being off by 4 SD) was more accurate than your 5 month prediction right?
Global sea surface temperatures will decrease as La Niña persists.
It is too hot man.
Still going up though, until it drops well below zero and stays there for many years I wont be convinced co2 has no effect.
I think that is what it is going to take to break this CO2 demonization effort.
I know we have seen a drop in albedo, and increase in DSR over the decades, is that still ongoing, or did it peak? From the data I have seen DSR peaked in 2003.
How long does it take to get SW out of the system? HOw long it takes for water to get from the equator to the poles I would say.
I would have thought 20 tears enough, so if CO2 has little effect, temps should be dropping.
And exactly what does “I would have thought” mean? Co2 continues to rise at a record rate, PDO and AMO both in their warming state and Cloud cover has fallen dramatically and still temperatures are not rising at any where near an “unprecedented” rate, still well below all the warm periods in the Holocene, the long term trend is towards re=glaciation. Clear indication that CO2 has little affect. Maybe your “Thought”‘s need to spend a little more time thinking.
I just told you what “I would have thought means”, the time taken for DSR to enter the oceans at the tropics and be released at the poles.
CO2 does cause warming, we know that. The question is how much in the system as a whole, and what is its strength compared to other forces.
None of what I have said discounts the warm Holocene, so keep your short on. 🙂
Question: what is the reason for the ‘sawtooth’ nature of the temperature record?
There are a lot of factors modulating the UAH TLT temperature on monthly timescales that cause a lot of variation. The month-to-month changes have a standard deviation of about 0.12 C which means that 32% of the time change is greater than that and about 5% of the time it is greater than 0.24 C. This is the result of quickly changing heat transfer mechanism between the various heat reservoirs in the climate system.
Another hand-waved word salad, blob should be proud.
I notice that thermageddonists such as bdgwxlgbt+ are jumping into the comments to say, “but, but, but, I know the warming is way below what our climate models predicted, but please believe me when I say we’re all going to dieeeeeee!”
The warmist lies are pure twaddle.
I assume “bdgwxlgbt+” is referring to me? Regardless, I never said or thought that we’re all going to die and I don’t want other people thinking it either.
Even I know you are wrong about that.
Perhaps you can post a link to a comment in which I said we’re all going to die.
Yeah, that was you.
And yes, you’re fully signed up to the “CO2 will kill us all!!!” schtick.
I think you have me confused with someone else. I don’t think CO2 is going to kill every human on the planet or even a significant percentage of them. In fact, I’ve been trying to convince the WUWT audience that people will be around for a very long time even under the most extreme and unlikely warming scenarios.
“people will be around for a very long time even under the most extreme and unlikely warming ”
So, what are you getting worried about? Grab a beer and sit back and relax with us sceptics.
I’m not worried.
This is why so many are going on their last cruise, their last vacation in the Bermuda, their last vacation in Yellowstone, and their last golf outing. It’s obvious the climate is so bad they are willing to risk their lives for one more fling. Just one more puff of extra CO2 into the air — and puff — Tom Cruise comes back with a hit movie — we’re saved. But why are folks still wearing gloves during their morning walks in Florida?
The conspicuous outlier is USA at +0.59. What part of the lower 48 was so warm? Seattle has been at least 3 degrees F below average for the last three months.