Guest Essay by Alan Welch – facilitated by Kip Hansen –14 May 2022

Nerem et al Paper, 2018, 4 Years on
by Dr Alan Welch FBIS FRAS, Ledbury, UK — May 2022
(Note: One new image has been added at the end of the essay.)
Abstract Having analysed the NASA Sea Level readings over the last 4 years it has been concluded that the accelerations derived by Nerem et al. are a consequence of the methodology used and are not inherent in the data. The analyses further predict that the perceived accelerations will drop to near zero levels in 10 to 20 years.
———————————————————————-
It is now 4 years since the paper by Nerem et al. (2018) 1 was released. It spawned many disaster pictures, such as the Statue of Liberty with the sea lapping around her waist, and a proliferation in the use of Climate Crisis or Climate Catastrophe in place of Climate Change by the likes of the BBC and the Guardian.
It also kick-started my interest in Climate Change, not by what it presented, but by the unacceptable methodology used in determining an “acceleration”. I have inserted acceleration in quotes as care must be used in interpreting the physical meaning behind the coefficients derived in fitting a quadratic equation. In the paper by Nerem et al. there were 3 stages.
Mathematical – Coefficients are calculated for a quadratic equation that fits the data set.
Physical – Attaching a label – ”acceleration” – to 2 times the quadratic coefficient.
Unbelievable – Extrapolating to the year 2100.
The first is straightforward and acceptable. The second is very dependent on the quality of the data and the length of period involved. The third is fraught with danger as the quadratic term dominates the process when used outside the range of data. The last point is illustrated in Figure 1. This appeared in https://edition.cnn.com/2018/02/12/world/sea-level-rise-accelerating/index.html with the caption “Nerem provided this chart showing sea level projections to 2100 using the newly calculated acceleration rate”.

Figure 1
As a retired Civil Engineer with 40 years’ experience in engineering analysis I appreciate that curve fitting can, with care, be used to help understand a set of data. But to extrapolate 25 years’ worth of data for more than 80 years into the future is in my mind totally unacceptable. But it is this “acceleration” that generated the alarmist press following publication.
I will now discuss several aspects concerning the sea level data, including what could have been done differently in 2018, what the current situation is and what can be learnt from studying the last 10 years’ worth of data. Prior to 2012 the data, and any related analysis, were more erratic, but with time a steadier picture is emerging.
The Feb 2018 data were the first data analysed. The data used were derived from the NASA site https://climate.nasa.gov/vital-signs/sea-level/. These data do not include any of the adjustments introduced by Nerem et al. but calculated values for slope and “acceleration” are not too dissimilar. In discussing “acceleration” the process can be made simpler by taking the values of the straight-line fit, i.e., the slope, away from the actual readings and working with what are called the “residuals”. Using residuals or the full data results in the same “acceleration” but it is easier to see the trends using the residuals.
Figure 2 below shows quadratic and sinusoidal fits starting in Jan 1993 up to the Feb 2018 using the latest values of sea levels. (See Note 1 below)

Figure 2
Situation in 2021.
A later set of results refer the period from Jan 1993 up to Aug 2021. The above graph has been updated in Figure 3 to show that the x2 coefficient is now 0.0441.

Figure 3
This update shows that the sinusoidal form curve is still a reasonable alternative to the quadratic curve although the period could be extended to 24 or 25 years and the amplitude increased slightly. The 22-year period and the amplitude have been retained for the sake of continuity although the quadratic curve is reassessed at each update, which has the effect of slightly modifying the slope and residuals.
Study of the last 10 years set of data.
The NASA data were analysed over the last 10 years on a quarterly basis using the full Aug 2021 set of data. The “acceleration” was calculated for each time step using the data from 1993 up to each date. In tandem with this a second set of “accelerations” were derived by assuming the data followed the pure sinusoidal curve listed on the figures above. In the long-term these “accelerations” will approach near zero but when the wavelength and period being analysed are similar unrepresentative “accelerations” will be derived. Note 2 gives more detail for the sinusoidal curve to explain the process and results and illustrate the curve fitting process.
The results of these 2 sets of analyses are plotted in Figure 4 as “accelerations” against date NASA data set was released and analysed. For example, the two “accelerations” for 2018 would be those derived using a quadratic fit for both the NASA data and the pure sinusoidal curves over the period Jan 1993 to Jan 2018 respectively. The graph on the left shows the “acceleration” for the NASA data and the sinusoidal curve. Their shapes are very similar but offset by about 3 years. Shifting the sinusoidal curve over 3 years shows how closely the 2 curves follow each other. This close fit is of interest. The NASA “acceleration” peaked in about Jan 2020 and is reducing from then onwards dropping by about 8% over 2 years. Working backwards from the peak the “accelerations” keep reducing until at about Oct 2012 they were negative, i.e., deacceleration. The close fit with the shifted sinusoidal curve may be coincidental but there seems to be a clear message there, that is the high “acceleration” quoted by Nerem et al. is more an outcome of the method used and not inherent in the basic data.

Figure 4
The next few years will be telling as to whether the sinusoidal approach is more representative to the actual behaviour and if the NASA data continues to produce a reducing “acceleration”. If the actual “acceleration” curve follows the trend of the sinusoidal curve the perceived “acceleration” will have halved in about 6 years and reached near zero values in about 15 years.
1. Nerem, R. S., Beckley, B. D., Fasullo, J. T., Hamlington, B. D., Masters, D., & Mitchum, G. T. (2018). Climate-change-driven accelerated sea-level rise detected in the altimeter era. (full text .pdf) Proceedings of the National Academy of Sciences of the United States of America, 115(9). First published February 12, 2018
Note 1. The NASA data changes from month to month. Usually this is confined to the last month or two of data due to the method used in smoothing the readings. In July 2020 there was a major change to all the data by up to 2.5 mm which had little effect on the slope, but the “acceleration” was reduced by about 0.005 mm/yr2. I have been unable to ascertain the reason behind these adjustments, but they have little effect on the overall findings.
Note 2. The Sinusoidal Curve shown in figure 5 will be analysed.

Figure 5
The “accelerations” derived from analysing this sinusoidal curve over a range of periods from 2.5 years to 70 years are shown in figure 6.

Figure 6
The next 5 figures illustrate the curve fitting process for various time periods.
Figure 7 uses a short 5-year period and the fitted quadratic curve is very close to the actual sinusoidal curve and in this instant gives an “acceleration” of -0.2716 mm/yr2 very close to the curve’s maximum acceleration of 0.285 mm/yr2 obtained by differentiating the equation twice.

Figure 7
Figure 8 uses a 15-year period and the “acceleration” drops to -0.0566 mm/yr2.

Figure 8
Figure 9 is very close to the period used by Nerem et al. in that it uses 25 years. The resulting “acceleration” is 0.0904 mm/yr2 similar to that paraded by Nerem.

Figure 9
Figure 10 covers 35 years and results in a rapid reduction in “acceleration” to 0.0118 mm/yr2. (typo corrected with thanks to Steve Case)

Figure 10
Finally extending the period to 65 years, which is nearly 3 periods of 22 years, results in a near zero “acceleration” as shown in Figure 11.

Figure 11
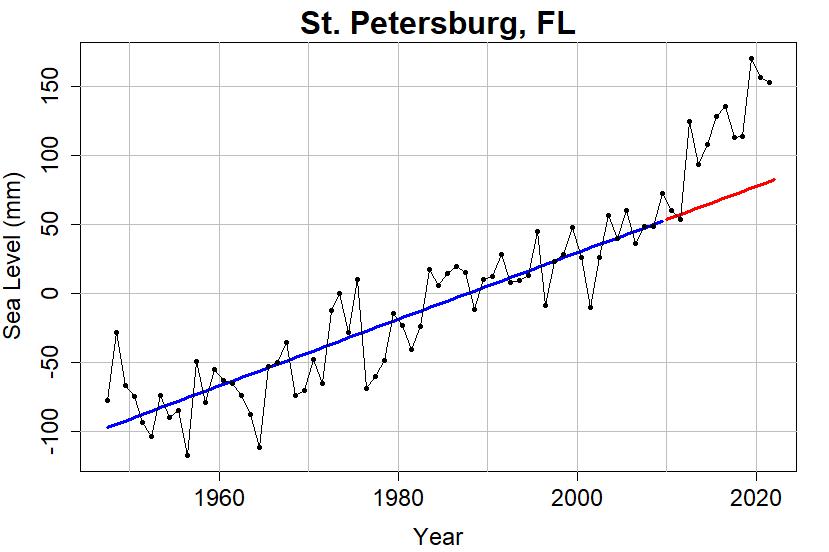
The following image has been added at the request of Dr. Welch (15 May 2022, 9:00 am EST):

Fig 2 from Nerem 2022 with prediction by Welch
# # # # #
About Dr. Alan Welch:
Dr. Welch received a B.Sc.(Hons 2A) Civil Eng. From the University of Birmingham and his PhD from the University of Southampton. He is a Chartered Civil Engineer (U.K.), a member of the Institution of Civil Engineers (U.K.) (retired), a fellow of the British Interplanetary Society, and a fellow of the Royal Astronomical Society.
Currently retired, he has over thirty years’ professional experience across many fields of engineering analysis. Complete CV here![]() .
.
# # # # #
Comment from Kip Hansen:
Dr. Welch has been working on this analysis for years and has put his findings together at my suggestion as an essay here. The above is the result of many edited versions and is offered here as an alternative hypothesis to Nerem (2018) ( .pdf )and Nerem (2022). In a practical sense, Nerem (2022) did not change anything substantial from the 2018 paper discussed by Welch
On a personal note: This is not my hypothesis. I do not support curve fitting in general and an alternate curve fitting would not be my approach to sea level rise. I stand by my most recent opinions expressed in “Sea Level: Rise and Fall – Slowing Down to Speed Up”. Overall, my views have been more than adequately aired in my previous essay on sea levels here at WUWT.
I do feel that Dr. Welch’s analysis deserves to be seen and discussed.
Dr. Welch lives in the U.K. and his responses to comments on this essay will be occurring on British Summer Time : UTC +1.
Praise for his work in comments should be generous and criticism gentle.
# # # # #
Agreed, what curve the data fits cannot be determined by much less than one possible cycle.
Thanks Tom for your comment. In reality 2 or even 3 cycles would be required in order to be confident with the analysis The data are no where near that.
I seem to remember being told that for extrapolation of a time series that you needed ten historic points for every one point extrapolated. is my memory at fault or was if fed duff gen? Duff gen RAF WW2 slang for rubbish.
A lot depends on the quality and consistency of the data, the understanding of all the physics involved and how much chaotic behaviour is present.
Sea level measurements do not score highly in these areas.
To continue the RAF terminology perhaps Nerem is a half pint hero who might soon have to become an umbrella man with his ideas gone for six.
Gerald ==> I agree with Alan — here is really valid rule for predicting the future from a time series. It all depends on what exactly you are measuring, what the system being measured is, what it;s variability is, what causes it to change or stay the same……
Kip and Alan, many thanks for your helpful replies.
Best wishes, Gerald
they cherry picked 2010
Nerem will be riding into the sunset before his methodology is definitively shown to be the shit that it is.
Hello Scissor. Agreed. Interesting in Nerem’s 2018 paper he extrapolates 80 plus years. In his 2020 paper he extrapolates 30 years. At that rate it will not be too long before he gives up extrapolation – or am I being too optimistic!
Should have said his 2022 paper, not 2020. Still got my fingers crossed that he will see the light.
He likes noisy time series data sets, coupled with some kind of fear factor, climate change and perhaps some other hook to blame humanity.
https://insidecires.colorado.edu/rendezvous/uploads/Rendezvous_2022_8463_1651104526.pdf
Acceleration from post 1980 sea level data – about the most relevant statistical/physical period – is indeed ominous. And in spite of alt.analyses based on irrelevant data, cumulative and accumulating GHG emissions could easily result in forcings large enough to give us the “impossible” year 2100 “instant slopes” that are part of those extrapolations.
But what responsible “warmists” advocate for action based on only quadratic extrapolation? Not rhetorical.
Countermeasures should be based on properly ranged (Heaven Forbid!) modeling, coupled with stochastic, incremental economic analyses, to catalyze actions to reduce “all in” losses. IMO, sea level rise is not the worst aspect of man made warming. We can adapt to it much easier than to the drought, fungilence, pestilence, floods, temperature extremes that nearly every unbiased scientific and Ag organization world wide tells us will come without those responsible countermeasures…..
And you are a fool, doing what you advocate would play endless ruin on the economies of the world. Models have shown zero predictively to date.
“man made warming”
And your evidence of that is?
The thing about big oily boob is that you can be 100% certain that if in 11 years or so, the sinusoidal curve proves to have been correct, he will be off chasing some other specious claims with these specious claims securely memory-holed.
The one thing that never ceases to amaze me is the zeal with which followers of the Climate Mafia use opinions, especially those from ignorant journalists, to dismiss factual data and observations presented by real “frontline” scientists. Here we see a prime example of this from “bigoilbob”.
That observation, which I fully realize myself, is what give’s me a pit in my stomach about the numerous possibilities of what’s next?
I am surrounded by climate zealots and I’ve come to realize that most are just harmless parrots, except a few can inflict irreparable economic damage to oneself. Even to this day, many are still paralyzed by fear of the “COVID” and wear useful cloth masks with gaping holes about the eyes, nose and mouth.
My hope is that the internet, and places like this website, provide a counterbalance to propaganda.
Your imagination is to be saluted, BigOilBob! Particularly the “responsible warmists” and “unbiased scientific” parts. Well done!
Or we could grab some popcorn and enjoy the show.
From the essay.
Did you not understand this? Anyone familiar with business of any kind will know that you can use powers (exponents) to create a curve matching your data. However, to rely on it for forecasting even 5 years in the future is not financially sound. Talk about chaotic systems being very dependent on starting points, this is no different. The exponent will continue to amplify any and all errors until the cows come home to roost.
“ However, to rely on it for forecasting even 5 years in the future is not financially sound.”
From my post:
“But what responsible “warmists” advocate for action based on only quadratic extrapolation? Not rhetorical.”.
Get sober, blob !
‘responsible warmists”
you have termed the question in a manner that cannot yield a positive value response.
(those berkely guys advocate based on only quadratic extrapolation all the time; although he is not ‘responsible’; ¿ <‘((())}} )
Responsible warmunists don’t exist.
Responsible people who believe temperatures will continue to rise steadily would either push for ocean fertilization if they really thought CO2 had something to do with it.
If they were really, really responsible they would do due diligence on all the data and claims and see:
1 – people and the biosphere do better in warmer weather, even warmer than now.
2 – temperatures have been warming since 1700 not just 1850, or other arbitrarily chosen date picked to frame human industrial development.
3 – said development has been responsible for pulling most of humanity out of abject poverty, and most sane people would be cautious about calls for immediately stopping that.
4 – seems the most effective scary climate stories have to due with rising sea levels and forest fires, both of which are better handled directly by the localities involved than by billing the whole world for the particular choices of the few who choose to live near the coasts on land that is probably sinking for other reasons.
You know what, I an getting bored of ennumerating the obvious, but how about this: responsible people don’t hand over blank cheques to every con artist who comes to the door with a scary story.
blob’s post is one of the most bizarre posts I think I have ever read.
Its as though he has taken several different hallucinogenics at the same time.
Mosquito farts in a hurricane! If natural climate cycles produce 50 meters higher and 140 meters lower sea levels (compared to current sea level), trying to finesse a millimeter acceleration from 25 years of sea level data is tilting at windmills. This is not a negative comment about Alan Welch (PhD), who is only trying to show the Nerem, et al, attempt is flawed.
Thanks Ron. Can not comment on Mosquitos as we don’t have them in UK! The sad thing about Nerem and his work is that it is all so unbelievable but his findings (predictions) are taken as gospel by the powers to be.
“Can not comment on Mosquitos as we don’t have them in UK!”
Oh yes we do !!
Britain is home 34 types of native mosquito species
https://www.libraryofbook.com/books/a-handbook-of-british-mosquitoes
https://influentialpoints.com/Gallery/Mosquitoes_and_Biting_Midges.htm
http://uksafari.com/mosquitoes.htm
https://www.gov.uk/government/collections/mosquitoes
sorry – didn’t do biology at school – I’ll stick to Engineering!!
Probably just don’t have them where you live. I’m in the same boat, thankfully. In my little corner of the Pacific Northwest, I haven’t seen a mosquito around my house the entire 20 years I’ve lived here. But just 10 miles away, they will eat you alive.
Alan,
Nice analysis, thank you.
Even though you did not study biology, can you tell the difference between male and female?
Or should you plan to study law, to better understand the USA Supreme Court?
Geoff S
Can you? Here’s a picture of a Polish sprinter who had her Olympic medals taken away because the test procedure classified her as a man.
polands-ewa-klobukowska-wins-the-womens-100-metres-in-1967-ewa-the-picture-id637472438
A year later she gave birth to a son!
Apparently not that easy.
“But it is this “acceleration” that generated the alarmist press following publication.”
All they need is suitably alarming headline. No corrections ever follow.
“The third is fraught with danger as the quadratic term dominates the process when used outside the range of data. “
Suggesting a curve fit using a quadratic exposes a phenomenally bad understanding of sea level rise.
Sea level rise is proportional to the energy absorbed by the ocean causing expansion and proportional to the energy absorbed by ice to melt it. Basically to double sea level rise we can expect to double the amount of energy absorbed by the earth.
So that means to expect a quadratic increase in the amount of sea level rise, the top of the atmosphere energy imbalance must also experience that quadradic increase of imbalance. And that could mean a number of things for cause but the most obvious reason is that the anthropogenic greenhouse effect has increased by the same quadratic function.
Is that predicted? No.
It would be nice to think Nerem read this site and the comments but he is too busy burying his head in the sand. A few years ago I sent an earlier and shorter version of this essay to PNAS and all was going well until it reached the referee stage and I believe Nerem may have been involved in this so out the window I went.
Claiming that it “was going well until it reached the referee stage” suggests that you don’t understand the whole publication process. What other stages are there worth worrying about?
It sounds like you know how the process works. Does every response to a paper get set to the reviewers? Or does the journal editor arbitrarily throw out responses that dont appear to have any merit?
Tim ==> Unfortunately, peer review today prevents most non-consensus papers from seeing the light to day (publication).
That may well be true. But Isaak asked the question “What other stages are there worth worrying about?” and I think getting the comments into review isn’t the first step.
Hi Tim,
From the PNAS’s website:
“PNAS will consider manuscripts for review as long as all components listed above are included in the submission. “
So all manuscripts that are properly formatted get sent out for review.
“PNAS will consider manuscripts for review”
Isn’t the same as “PNAS will review manuscripts as long as…” Consider for review means there is a step of consideration before the step of review.
Very insightful comment. In general, curve fitting only works if you know the physical process driving the change to let you know what function to use. We don’t understand many of the processes.
However, we do know that a quadratic is completely out of the question. GHG radiation imbalance is logarithmic with CO2 concentration and disequilibrium models of atmospheric CO2 concentration are sublinear as the greater the disequilibrium between ocean and atmospheric CO2 concentration the greater the proportion of CO2 emitted into the atmosphere is that will be removed by the ocean (about half of all CO2 emitted gets removed by the ocean now and that proportion will likely grow). Therefore, the added heat from radiation imbalance will grow slower than logarithmic. That’s an entirely different function than quadratic.
You can tell that Nerem is either an amateur or a shyster by the fact that he didn’t even try to justify using a quadratic and then, having chosen a completely wrong function, proceeded to misuse the fit.
meab ==> Of one thing you can be sure — Steven Nerem is no amateur; he is, rather, one of the leading NASA scientists working on sea level and sea level rise.
I think he is misguided and and has fooled himself (see Feynman) that Sea Level “MUST be accelerating because Climate Change” — therefore when he looks for it he finds it.
I know who Nerem is. He might be a competent astrodynamicist, but he’s an extremely poor excuse for a mathematician/statistician. You do not fit data with any old function and then extrapolate the future with that function.
If the sea level rise is accelerating, one thing we know for absolute sure is that it is not accelerating quadratically.
meab ==> If you’ve been reading my SLR series here, you know that I agree.
Just because he is wrong doesn’t make him either an amateur or a crook.
It does indicate that he is unfit for physical science analysis. Just read the comments here, including yours, to understand that there are people who understand what should be done.
He is probably unfit due to the teaching today. Imagine going to school now and being told there is no way to experiment on climate because we don’t have a second earth. Consequently, you must BELIEVE in the hypothesis that GHG’s and especially CO2 is the reason for climate change. Everything you do is directed toward proving that erroneous hypothesis rather than trying to falsify it. In addition, your advisors tell you to not bother with advanced training in statistics since there are math majors who can do that work. (My nephew got that advice but thankfully ignored it on his way to a doctorate in microbiology.) Most of those math majors have NO training in physical science and wouldn’t know a periodic function if it bit them on the arse.
I expect the reviewers of this paper have had the same training and wouldn’t recognize a basic failure of assuming how physical phenomena actually works.
Actually if sea level rise is accelerating we know ‘for absolutely sure’ that sea level is not following a linear function.
I am quite sure that you are right .
We had a big announcement 2 weeks ago here in New Zealand from a couple of boffins from Victoria University in Wellington .
Naish fronted it but James Renwick was in the back ground pushing the scary ( news ) that our sea level rise was or is about to accelerate.
New Zealand coastal sea levels have been very constant at 1.5 mm per year .
That is what tide gauges are showing .
These two muppets announced that their work with models show that in the next 40 years sea level will rise by 40 centimeters from the measured rise of 6 centimeters over the last 40 years .
They also predicted that a lot of our coast is gradually sinking and that will accelerate into the future.
I have it on good authority that the Auckland harbour is actually rising and that it is becoming slightly shallower ,1 or 2 millimeters per year .
The general public who are buying very expensive houses in our beach resorts do not seem worried as values have doubled in the last 5 years for waterfront properties .
“ have it on good authority that the Auckland harbour is actually rising”
The published GPS data shows that it is sinking by about 0.5mm/yr.
https://agupubs.onlinelibrary.wiley.com/doi/full/10.1029/2019JB018055
Phil ==> You may be talking across one another. It is quite possible in the physical world for the harbour to be becoming shallower and the land mass to be sinking (negative VLM) at the same time — They are based on different processes.
Well I was answering “the Auckland harbour is actually rising”.
Phil ==> Yes,language is difficult. Can a harbor be rising? Don’t know because the language is not clear. Does it mean the water level in the harbor is rising? The sea floor in the harbor is rising? Does it mean the land mass surrounding the harbor is rising?
All three could, in the real world, be rising or ‘sinking’ independently — simultaneously.
He was quite clear, he said: “They also predicted that a lot of our coast is gradually sinking and that will accelerate into the future.
I have it on good authority that the Auckland harbour is actually rising “
He was referring to the ‘coast’, in other words ‘the land mass’, which is the point I addressed. I had no difficulty with his language.
Phil ==> I’m not arguing with you. Graham’s statements were a mix-and-match….
???????????????
Standard practice would be to calculate the 95% confidence interval lines + and -. Plot up the confidence interval lines together with the fitted line and the data.
See how the confidence interval, low value to high value, grows rapidly as you extrapolate past the end of the data.
Marvel at how the confidence interval goes “Floor to Ceiling” at 80 years.
This puts a stop to:
1) overfitted data
2) unjustified extrapolations that go too far
Yet nobody is doing it. WUWT???
TonyL ==> See mine at
https://wattsupwiththat.com/2022/05/03/sea-level-rise-and-fall-slowing-down-to-speed-up/
Nerem shows this to be true in his back-projection but fails to do so in his forward projection.rpojection
Yes!
Exactly Correct.
A quadratic with confidence intervals, Perfect.
Bonus points: They open up “wider than a barn door” in right short order.
TonyL ==> Of course, it is not just the quadratic effect — since projections involve non-linear equations, they will get the shift to chaos where results spread all over the map.
“Yet nobody is doing it. WUWT???”
You could try looking at what Nerem et al actually did. Here is a copy of the abstract. The confidence intervals are calculated, 65±12 cm by 2100. Not wall to wall.
The abstract doesn’t give the CIs for rate of increase, but a later highlighted section does (3±0.4mm/yr). He put those together in a standard quadratic calculation.
Any acceleration in the satellite sea level data is purely from adjustments at changes in satellites.
These adjustments are far larger than any acceleration component.
There is no acceleration at tide gauges.
The whole issue is moot and pointless.
Nick Stokes ==> If we are speaking of Nerem (2022) his abstract reads:
“We find GMSL rise in 2050 relative to 2020 will be 16.4 cm higher, with an uncertainty range of 11.3–21.4 cm. This prediction agrees within uncertainties with IPCC SROCC and AR6 sea level projections. In addition, a hindcast extrapolation prior to 1993 agrees well with the tide gauge record of GMSL change over the 2nd half of the 20th century. We believe this shows the value of short-term observationally driven extrapolations as an additional tool for predicting future sea level change.”
When Nerem says his “hind-cast agrees” he means this:
Nick ==> As we see, while be gives spread for future SLR, he means “depending on IPCC RCPs)”….his hindcast is truly wall-to-wall, though he fails to admit it, even when I emailed and asked him to label the triangular gray area…..
Kip,
One can argue about whether the bounds are too spread to be useful. One can argue about whether they are correctly calculated. I was responding to a claim that they hadn’t been calculated at all. The whole paper is about error analysis.
I don’t think his calculation depends on RCPs. It is just time series based. He compares with RCP based modelling.
Nick ==> Hard to tell as he won’t answer simple questions and the text is limited.
However, if he is using the same methods to back-project to 1960, then his CIs for the future projection would have to be at least as large as the same time period backwards — should be larger, as the back-projection involved known data.
At least he admits to a > 10 centimeter uncertainty range (which he fails to show on his graph) — which is 100 mm of uncertainty.
His projection to 2020-2050 — the next 30 years of 65 centimeters (read 650 mm) is more than the measured sea level rise than from 1960 to 2020 — 60 years.
As usual, the media just uses his 65 cm — over 2 feet in the next 80 years (2100). More than all the SLR since 1890.
*
When used in the context of anything to do with global climate science, the use of the “NASA” brand should be immediately recognised as pertaining to the propaganda produced at Columbia University under the direction of the current leader of the Climate Mafia, Gavin Schmidt, the successor to the originator of the climate scam, James Hansen. President Carter, in 1981, appointed James Hansen as the director of GISS, which up until that time was primarily concerned, as a division of NASA with space studies (the “SS” in GISS).
Hansen immediately repurposed GISS into its current role as the principal source and expounder of the fraudulent climate propaganda being published by GISS in NASA’s name. A significant example of this is the false sea level data being posted by “NASA”. This is the product of the Jason series of experiments, which attempt to measure sea levels using satellite based radar altimetry, a system which is unfit for purpose, as acknowledged by the leading participant, NOAA, until recently. I recall that Kip Hansen made similar disparaging remarks about this last May in WUWT.
NOAA’s website “Tides and Currents” provides excellent data, based on the historical global records from tide gauges, maintained by CO-OPS (formerly PSMSL), which finds that, since records have been kept globally, sea levels have been rising at the steady rate of 1.7/1.8 mm per year with zero acceleration. The “NASA” data is pure bullshit.
https://tidesandcurrents.noaa.gov/sltrends/globalregionalcomparison.html?fbclid=IwAR3-pDl-npQ2o8gRnUIA43sJRJw_0bvxsLZkUTAm2kkYiSsNR-t_thkiTdk
Great link, I’ve got it bookmarked(-:
?????????
A second issue, this one for the statistics people.
A while back, I fit quadratics to tide gauge station annual data (not monthly), and calculated the p-values for the lines. As you know p-value < 0.05 is significant, larger than that, not significant.
What happened?
for Y = aX^2 + bX + c
The X^2 term *is* signoificant, (the “a” term).
The X term is not, and by a large margin. (the “b” term)
So how on Earth does the X^2 term get to be significant, while the more fundamental linear X term is *Not*?????
What is going on here?
Does the more fundamental term losing it’s significance mean that all higher orders are insignificant, regardless of p-value calculation?
This seems to be the only rational way to interpret the statistics.
“What happened?
for Y = aX^2 + bX + c”
X/yz – P[dq]
WUWT has a huge readership which has an uncommon level of knowledge and skill in a variety of scientific and mathematical fields.
I came across this very interesting occurrence when poking around some data. I was hoping some statistics person could explain the significance of what I was looking at.
So far, not a single response.
Oh well……
TonyL ==> Not everyone has the same interest in the obscure details of statistics. You might ask Wm Briggs at his site.
In my opinion, P-values are not a good judge of reliability of findings…and don’t mean what most people think they mean. P-values certainly do not mean real world significance.
Without seeing the data I would suggest it’s related to the nature of the curve. If it’s nearly a pure quadratic with a very small linear term it wouldn’t surprise me, alternatively you could have a nearly pure linear and small quadratic and again the fit of each term wouldn’t be equally significant.
I have a more basic problem with Nerem. He used the NASA data. Follow the link to find it is the satellite era sea level data. In guest post ‘Jason 3–fit for purpose?’ I showed it was not and never could be. In the second guest post on the new Sentinel 6 I showed that it wasn’t either.
In addition to the inherent accuracy problem, the NASA satellite data does NOT close with ARGO estimated thermosteric rise plus ice sheet loss. The dGPS corrected long record tide gauge estimate of ~2.2 mm/year does close. See guest post ‘Sea Level Rise, Acceleration, and Closure’ for details.
Nerem is a goofy extrapolated analysis of a bad data set.
Rud ==> as stated, this is not my hypothesis, but an interesting one.
My view is in my way-too-many essays here on Sea Level and sea Level rise — and I absolutely agree that the Satellite Sea Level is 1) Not sea level at all but a different thing called Eustatic Sea Level (a conceptual, non-physical construct) and 2) Totally a misrepresentation when shown with no error/confidence bars with a magnitude at least in centimeters.
Kip, was not meaning criticize you or Welch. Was simply trying to point out that this specific ground has been well trodden here.
Rud ==> No worries — didn’t think you were being critical.
We do get a lot of new readers here each week who are not familiar with the subjects and the authors.
Over the last decade, “this specific ground has been well trodden” into a muddled mess….so occasionally, it pays to re-state one’s position.
Always appreciate your contributions to comments (and essays, of course.)
We do get a lot of new readers here each week who are not familiar with the subjects and the authors.
________________________________________________
BINGO! Posting something once isn’t productive.
Thanks to Kip Hansen and to Dr. Welch for a very thorough analysis and for generating the essay. I don’t disagree, but I look at it from a more theoretical POV. We were told in school that differentiation, i.e., taking the first derivative, was an inherently inaccurate process (especially compared to, say, taking an integral.)
Imagine that you are estimating the slope of a “curve” like the raw data, above. You can see that the slope changes very rapidly at every inflection point, going all the way from positive to negative, or vice versa. The slope is, essentially, indeterminate at each such point. Taking the second derivative (“acceleration”) through many such points, no matter how many, involves considerable imagination.
And, indeed, Dr. Welch shows us above how the mere assumption of one type of curve over another changes the result radically, giving entirely different values for acceleration; even the sign is different. We have little reason to favor one type curve over another, especially over such a small interval, which would seem to be Dr. Welch’s point.
Are you saying that taking the derivative of a function, and then integrating it, that you won’t get the same function? Yes, you lose the value of the constant in the original function, but the basic shape of the function remains the same. It seems that you have your claim backwards.
I’m not saying anything close to that. What I’m saying is that if the first derivative is inherently inaccurate, the second is total hoskaplop.
“The slope is, essentially, indeterminate at each such point.”
A point at which the slope changes is not necessarily indeterminate. Meaning the first derivative is not inherently inaccurate.
The slope of y = sin(x) changes from positive to negative at pi/2 radians. Yet this is not an inflection point. The derivative at sin(pi/2) does exist. Same for y = x^^2.
I think your definition of an “inflection point” needs to be stated more precisely.
Having a pole at a certain point in a function does not rule out piecewise analysis either. But it does cause problems with statistical analysis of such a function.
Jorge,
you appear to be confusing numerical differentiation with analytically differentiating a curve. Numerically differentiation magnifies any noise while numerical integration smoothes it out but analytically at least it is 100% accurate.
The very first lesson I learned from my first lab course was that you cannot just fit any curve you want to the data. I did an experiment that produced 7 data points. I had special access to a mainframe computer in 1969 which had several curve fitting functions. With 7 data points I chose a 7th order polynomial to fit the data, and got a curve that went exactly thru all 7 points.
The prof had a good talk with me about using a 7th order polynomial fit for a function that should have been pretty linear, and I learned that you have to have a theoretical basis for the curve you want to fit before you do the fit. Without a basis, you just present the data and the uncertainty bars. Without a basis, a fitted curve is misleading.
Your point shows the danger of fitting a polynomial. The highest power term dominates once outside the range of data. One small point with 7 data points you only need to go up to the 6th order but not critical.
Yes, what you did is called “over-fitting.” It is a common error for those with access to computing power beyond their understanding of the processes they are modeling.
Cherrypicking. Look at the 4-year acceleration from 1999 to 2002. After the fall in sea levels in 1998 due to a super El Niño. And the 5-year acceleration from 2011 to 2015. After the fall in sea levels in 2010. Notice a pattern here? #junkscience
The CU satellite-measured sea level graph appears to show acceleration over its brief 29-year period. Notice the lack of acceleration over the entire 160-year period of the Battery Park tide gauge record. It’s all about perspective and where you start and end your measurements.
And for more perspective on sea levels, let’s took at a million year timeline.
https://www.researchgate.net/profile/Leonid-Sorokin/publication/299446187/figure/fig1/AS:669401518968870@1536609167977/Changes-in-Global-Mean-Sea-Level-during-the-last-18-million-years-based-on-the-content.ppm
Humans’ affect on sea levels, if even measurable, is insignificant.
The only reason you would apply a second-order (or linear, or 3rd order, or sinusoidal, etc.) curve fit would be if you believed that there was a physical real-world reason to apply it. You might test several hypotheses with different curve fits to see if you can eliminate some hypotheses.
Also, you would need to have data from a long enough time period to be able to determine what order an equation would have to be to get a decent curve fit at the boundaries of the data and not have spurious ends that drive things to ridiculous ends.
Second-order, third-order, fourth-order or even sinusoidal curves can all match each other very closely over a limited slice. They end up at very different points, though.
Point accepted. One question to ask is why a 22 year (25 Year?) curve. Are there any physical reasons for this. One could be that the satellite data only cover 95% of the sea. The missing portions are mainly the Arctic and Antarctic oceans. Should there de a decadal oscillation across the + or – 66 degree latitudes this could induce a sinusoidal change. We are only looking for +/- 3.5 mm.
While it is very good to examine the satellite SL methodology, I think any such project should include error bars, and even more importantly, note that tide gauges, which are far more accurate and located where folk actually live, show that SL rise is not only much lower annually, it is NOT accelerating at all. (Which should also increase satellite error bars.)
Thanks David. There may be a perceived low acceleration of tidal gauge readings of the order of 0.01 mm/yr2, but even this could be caused by very long (millennium) variation for which 200 years (max) of readings are not adequate to analysis.
There may be a perceived low acceleration of tidal gauge readings of the order of 0.01 mm/yr2,
_________________________________________________________
Thanks for posting that, tide gauges with ~100 years of data do show a narrow distribution that centers around 0.01mm/yr². Of 63 such tide gauges a quadradic fit shows the following distribution:
<pre>
mm/y²
-0.02 — 1
-0.01 — 2
0 —– 14
0.01 — 23
0.02 — 13
0.03 — 8
0.04 — 2
</pre>
David ==> On Error Bars — see my essay https://wattsupwiththat.com/2018/04/02/errorless-global-mean-sea-level-rise/
The close fit with the shifted sinusoidal curve may be coincidental but there seems to be a clear message there, that is the high “acceleration” quoted by Nerem et al. is more an outcome of the method used and not inherent in the basic data.
Figure 10 covers 35 years and results in a rapid reduction in “acceleration” to 0.118 mm/yr2.
_____________________________________________________________
Part of the method used was to alter the data from 1992-1998 which produced a 2nd order polynomial (quadradic) that curved upwards.
Figure 10 shows 0.118 mm/yr²?? Should be 0.0118 mm/yr² as shown on the chart
Kip, thanks for dogging this issue. The spectre of rising sea levels inundating coastal cities around the world is one of the biggest scares Climate Science generates. A google news search on “sea level rise” produces endless stories and images of flooded ocean front properties. You don’t have to follow very many links to find predictions of a meter or more of sea level rise by 2100. First one out of the box on my search a few minutes ago: Daily Mail
Thanks Steve for pointing out my Typo.
In the intro by Kip he mentioned the Nerem 2022 Paper. In that Nerem produces a similar plot (fig 2) to the RHS of my fig 4. He only goes up to end 2020 and says the acceleration is leveling off. I added my “accelerations” up to end 2021 to his fig 2 and they show a definite downturn from the peak. Interesting if he will continue this curve into the future. He says “level” whilst I’ve shown a 8%(ish) drop over 2 years and am predicting (dangerous) an extra 12%(ish) over the next 2 years. Before 2012 the “accelerations” were affected by the shorter time periods involved and a bigger influence from El Nino and La Nina events.
Steve ==> ALL of the alarm about sea level rise stems from 1) Cities already at risk from today’s sea levels and today’s storm surge because they are built literally at sea level (+/- a foot or so) 2) False predictions of dangerous sea level rise in the near future (20-50 years) built on RCP8.5 nuttiness.
I have written calming papers for two State legislatures on the topic tailored for their states. The real world data is not alarming, but can, in instances (like Miami, FL) be worrisme.
There is this thing, the sea’s boundaries.
The body of sea water, in between two different seas.
Does any body know if any research, scientific or otherwise, ever undertaken to study such as?
In proposition of the important parameter indicator of climate, the sea lvl variation;
the sea boundaries could offer a much clear indication of sea level rise, as naturally bound to respond to it, as a dedicated slave to a potential master.
My self do not know of any research what soever about such matter!
Any one that could help with some more enlightment in this particular issue?
Perhaps, maybe Rud could!
cheers
whiten ==> The seas, meaning major oceans, are one large rather odd shaped body of water. The only boundaries are where the water hits the land.
There are only human defined boundaries. The Mediterranean, the Black and Red Seas have some geographical pseudo-boundaries… but are in fact one continuous body of waer.
Thanks Kip.
Let’s see, how we can deal with the terminology and deformation of it, and try to keep it as rational as possible. outside of some blasting brilliance of wiki like mess.
Ok, let say that I whiten am considering fictional things… that according to the terminology, can not be or have any meaning.
Like for example;
that if one flies around the world observing the coastal bodies of water, one will clearly see not only different large bodies of water, touching in considerable long distances “lines” (geographically), but also one can clearly see where these ‘lines’ touch the coast.
In this fictional scenario, one can simply record by only usage of photo camera where actually such ‘lines’ touch the coasts, all around the world, where such ‘lines’ or boundaries actually exist.
So living aside for a moment all the might of complex terminology.
What would you say about this fictional proposition of mine… does it carry any kind of meaning at all in reality?
According to you, does such claimed natural condition exist or not?
Mind you, this proposition, fictional or not, addresses a (maybe supposed) natural condition that predates humanity.
I am open to correct my superficial understanding in this regard, but it will help a lot if the argument not solely based in the terminology and the assumed authoritative correctness of it.
Assure you that only trying to contribute, first and foremost towards my own understanding… in this particular issue.
cheers
meab ==> Well, I admit now that I have no idea whatsoever what you can be going on about.
Good, sorry for wasting your time.
But if I may say, and still further persist.
Look at the map, global or otherwise, and there is many seas there, put on the map with their own names, next to each other, with indisputable different physical parameters and different characteristics, very clearly distinguishable from each other… in reality there, via simple observations.
Consisting as large bodies of water with different easy observable characteristics, and therefore with different thermal responses.
Well, hopped that we could have got a little further, but seems difficult now, with your straight dismissive response.
Your ball your choice.
cheers
Methinks you should’ve added the “/s” tag to your original comment OR whatever
you’ve taken/done is affecting you more than you realize & a personal rule of not
commenting after using/doing it should’ve been made.
Old Man Winter
Thanks for your reply.
Not being judgemental but your reply too obscure in consideration of my comment.
It could have being simpler if you helped by telling me, that all my understanding, and the point tried by me, in my comment, is basically simply based in fiction or fantasy.
That there does not happen to be any thing like I claimed in reality there.
Can you at least confirm such a simple thing to me… so I clearly get the message?
To me believe it or not, this is a serious enough issue.
So I got to do my best of not misunderstanding.
Thanks in advance.
cheers
Not entirely following your question, whiten.
Are you referring to something like the Panama Canal, where the Pacific Ocean is 20cm (7.9 inches” higher than the Atlantic side of the canal?
PSMSL
Or are you referring to the abundance of imagery documenting water heights along the world’s coasts.
Much like early 20th century pictures of New York’s battery tide station?
One should not dismiss the abundant “fall-lines” worldwide where fresh water waterways meet tidal waters.
I’ve lived near fall-lines most of my errant 6 plus decades and I have yet to see a fall-line registering significantly higher tidal waters.
Placing them in the same level of danger from sea level rise as New York’s battery.
ATheoK ==> I hope he answers as I couldn’t figure out what he was talking about either…..
ATheoK
Thank you for asking.
Let’s just put it this way.
What I am talking about, is addressing a (maybe supposedly) natural condition, that exist about different bodies of water.
That holds true in concept and otherwise for both kinds, the large deep oceanic bodies of water and smaller shallow coastal bodies of water, but in the case of the small shallower ones is easier to observe and distinguish.
I am talking about the actual seas contiguous next to each other, with different parameters, like different saltines (salinity), different clarity, different sea floor, different depths, with different coast lines in front them, and other different physical characteristics, separated by a body of water, which is like a mix of both, where the different respective sea floors separated by a “sea floor boundary” that is like a mix of both respective sea floors.
Yes in consideration of large and deep oceanic bodies of water is difficult and very complex hard to see this but, in shallower smaller coastal bodies of water is more easy and realistic.
Why I think this is important.
Because, the separating body of water, in between contiguous seas, is bound to shift one way or the other over time, as the result of sea level variation… therefore carrying the sea level variation signal.
Different contiguous bodies of water have different thermal responses.
The condition of maintaining thermal equilibrium of such, between each other, and between each of them respectively with atmosphere above, under the condition of sea level variation, will result in the shifting position of the “boundary” one direction or the other over time.
There is no way to actually consider or expect any benefit by way of argument, in proposition of any given issue, if first not clearly established the validity of the main core subject.
So the first point to consider or establish here is;
whether this is a real observable natural condition, or simply just a figment of my imagination.
Thank you, and please feel free for further engagement, if you like to.
cheers
It seems to me that you are expecting a replicable neutral sea level measurement environment where water bodies meet.
Sort of like the mechanically isolated tide measurement stations worldwide.
Where two large bodies of water meet are often tumultuous. Whirlpools and maelstroms are located globally between two bodies of water;
On a smaller basis, my little Hydra Sport 17 foot center console is tossed around like a cork when transiting some smaller junctions between bodies of water; e.g., Cape May Canal which joins Cape May Harbor to the Delaware Bay. Small tide changes cause dangerous water conditions.
The world is full of separate but adjacent bodies of water. I’m sure many of their intersections have tidal stations measuring sea level height.
Isolating them and then comparing sea level height to neighboring bodies of water may satisfy your curiosity.
ATheoK
Thanks again.
First, if you read my first comment here, is pretty clear stated that I know not of any research or study in the proposition of the main core subject I tried to brink up,
so I am not expecting or pretending for some kinda of replication of any kind…
What happens to be the main point raised by me, especially in the first comment, is like:
If a condition, like real observable physical barrier buffers, do exist in proposition of contiguous large bodies of waters (seas) that we call seas, and also we have them represented in maps as seas, with even their own specific names,
then;
Is there actually any research or study there related or about such a condition?
You see, in my reply to you I think I made it very clear, that when it comes to large deep oceanic bodies of water,
such expectation, of any substantial research, could be far too much to expect, and most probably non achievable.
Also I think that attempting to research and study in the proposition of smaller and smaller compartmentalized portions, of contiguous bodies of water, like in the size of bays and harbors and capes, will be completely useless.
Again, for what it could be worth;
“Why I think this is important.
Because, the separating body of water, in between contiguous seas, is bound to shift one way or the other over time, as the result of sea level variation… therefore carrying the sea level variation signal.”
Am not claiming about the possibility, of another method of any direct actual sea level measurement.
If the barrier buffers, the ‘boundaries’ between contiguous seas carry the sea level variation signal,
then if there any adverse or out of normal acceleration of sea level rise, it will be detectable.
But, well, that only if such condition(s) is/are real in nature, and then researched and studied.
cheers
All the tide gauges in the world are contained herein
https://psmsl.org/data/obtaining/map.html#plotTab
all of these charts tend to show an overall linear rise or fall in relative local sea level rise with quite a large amount of random noise.
Not a single tidal gauge anywhere in the world shows a tendency to acceleration. Therefore whatever suppose acceleration can be wrung out of satellite data sets CPS corrected land sites or whatever is a piece of totally worthless data manipulation by pseudo-scientists who should find more worthwhile targets for their data manipulation skills.
Looking for psychkinesis would be a more rewarding and intellectually more honest enterprise.
From that dataset:
Phil ==> See NOAA’s chart:
Yes, monthly vs annual both show the acceleration. Alistair Gray chose the psmsl dataset so I took an example from it.
Proving once again, as if more proof were needed, that figures do not lie, but liars figure.
In hype they trust-
SIDS study shows the risks of science hype (msn.com)
Just perfume the stench of BS with some sciencey computer output and let noble cause do the rest. What could be more noble than saving a few bubbies every year? Now let me think……?
The “narrative” has long since replaced science.
Kip, I think you did the right thing encouraging Dr. Welch to complete and show us his work. Your personal note is well taken. Most of this is above my head the important point is that if a party is going to use curve fitting to make their point, they should use the proper curve. This seems so obvious after reading it I am thinking why hasn’t this topic been discussed here at WUWT before?
Bob ==> WUWT is at the mercy of its authors — all of who are volunteers and mostly amateurs (in the sense of not being hired and paid to do this work.)
I have written over 200 essays and news briefs here, on a dizzying variety of subjects. Only once or twice have I been asked to address a particular topic. Sometimes readers point me to interesting subjects. (of which curve fitting would not be one.)
Curve fitting is one of the controversial points of modern science — now that your handy-dandy (and mostly misunderstood) mathematics program will gladly fit whatever curve you ask it to any data set.
In the UK its coming to the end of a hectic day trying to keep up with all the comments.
I would like to take this opportunity to thank Kip for our discussions over the last 2 years or so, his support in helping me put together this essay and for his spiritual support following the death of my daughter from cancer 3 months ago. I’m a non-believer but his words helped me considerably.
Thanks also to all (or most) of those posting comments. This was my first taste of posting an essay on WUWT and the most difficult part was keeping track of new comments and responses to comments coming in.
Sorry for the break in responding but I needed to get my climbing bean frame erected! Ledbury, UK is at 80 metres elevation and using Nerem’s last “acceleration” I worked out the sea would be hampering my bean growing on 23rd Feb, 3319 so I had better get a move on!!
Funnily, we must also thank Nerem for his contributions otherwise we would have nothing to write about.
Alan ==> And it has been a pleasure to work with you. You have done a masterful job handling comments and I encourage you to stop back in tomorrow and pick up any late additions.
Overall, Nicely Done, Sir!
As the satellite data acceleration is based totally on adjustments and changes in satellites, the whole thing is a load of cow droppings anyway.
Dr. Welch –> Thank you for a short and concise description of one of the problems with doing curve fitting without a mathematical function to describe the variables involved and how what they each do to the output.
Curve fitting some data is only done to show an enhanced understanding of the function you are describing. In this case curve fitting is being used to show “my curve will show what will happen 80 years from now” by Nerem.
I’m sad to say this scientist knows little about science and math. I understand simple regression can give you a function OF ONE VARIABLE. However, climate is not determined by one variable (i.e., CO2). You will end up needing something like “ax^2 + by^2 + cz^2 + dx + ey + fz + some trig functions” to describe what is happening close enough to forecast out 80 – 100 years. This is where current GCM models fail.