From Dr. Roy Spencer’s Global Warming Blog
April 9th, 2022 by Roy W. Spencer, Ph. D.
SUMMARY
The proper way of looking for causal relationships between time series data (e.g. between atmospheric CO2 and temperature) is discussed. While statistical analysis alone is unlikely to provide “proof” of causation, use of the ‘master equation’ is shown to avoid common pitfalls. Correlation analysis of natural and anthropogenic forcings with year-on-year changes in Mauna Loa CO2 suggest a role for increasing global temperature at least partially explaining observed changes in CO2, but purely statistical analysis cannot tie down the magnitude. One statistically-based model using anthropogenic and natural forcings suggests ~15% of the rise in CO2 being due to natural factors, with an excellent match between model and observations for the COVID-19 related downturn in global economic activity in 2020.
Introduction
The record of atmospheric CO2 concentration at Mauna Loa, Hawaii since 1959 is the longest continuous record we have of actual (not inferred) atmospheric CO2 concentrations. I’ve visited the laboratory where the measurements are taken and received a tour of the facility and explanation of their procedures.
The geographic location is quite good for getting a yearly estimate of global CO2 concentrations because it is largely removed from local anthropogenic sources, and at a high enough altitude that substantial mixing during air mass transport has occurred, smoothing out sudden changes due to, say, transport downwind of the large emissions sources in China. The measurements are nearly continuous and procedures have been developed to exclude data which is considered to be influenced by local anthropogenic or volcanic processes.
Most researchers consider the steady rise in Mauna Loa CO2 since 1959 to be entirely due to anthropogenic greenhouse gas emissions, mostly from the burning of fossil fuels. I won’t go into the evidence for an anthropogenic origin here (e.g. the decrease in atmospheric oxygen, and changes in atmospheric carbon isotopes over time). Instead, I will address evidence for some portion of the CO2 increase being natural in origin. I will be using empirical data analysis for this. The results will not be definitive; I’m mostly trying to show how difficult it is to determine cause-and-effect from the available statistical data analysis alone.
Inferring Causation from the “Master Equation”
Many processes in physics can be addressed with some form of the “master equation“, which is a simple differential equation with the time derivative of one (dependent) variable being related to some combination of other (independent) variables that are believed to cause changes in the dependent variable. This equation form is widely used to describe the time rate of change of many physical processes, such as is done in weather forecast models and climate models.
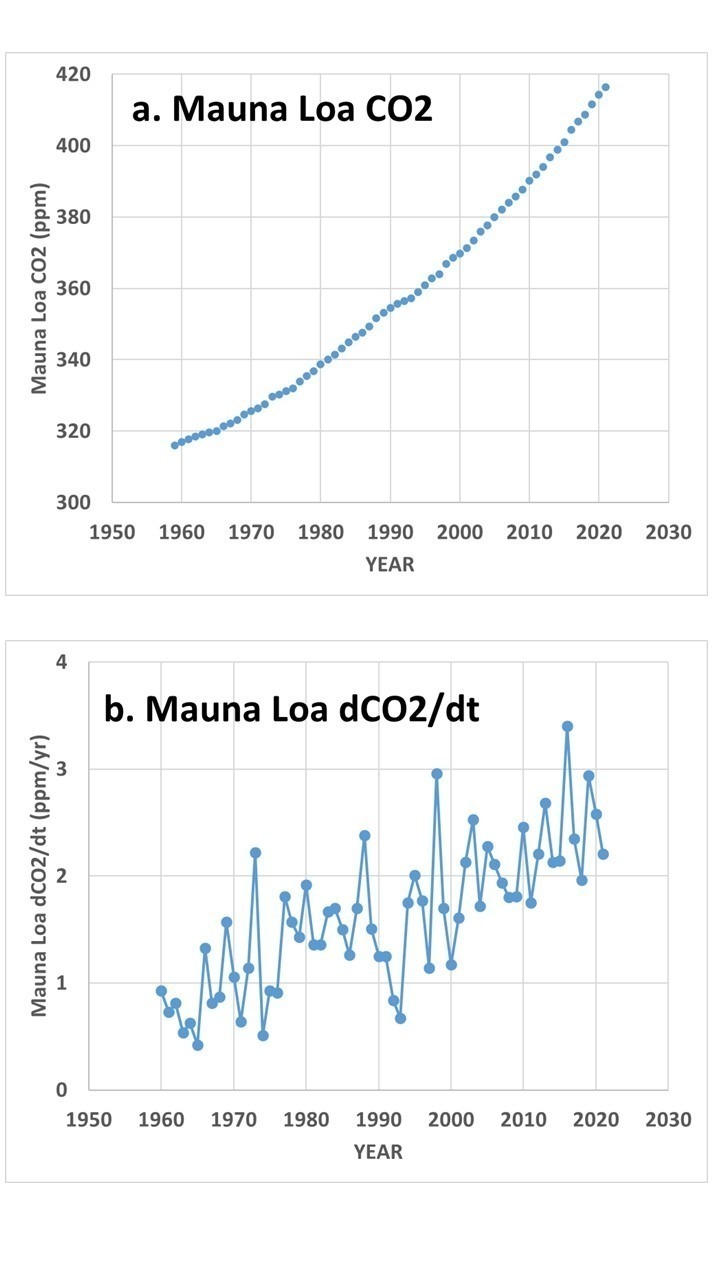
In the case of the Mauna Loa CO2 data, Fig. 1 shows the difference between the raw data (Fig. 1a) and the more physically-relevant year-to-year changes in CO2 (Fig. 1b).

If one believes that year-to-year changes in atmospheric CO2 are only due to anthropogenic inputs, then we can write:
dCO2/dt ~ Anthro(t),
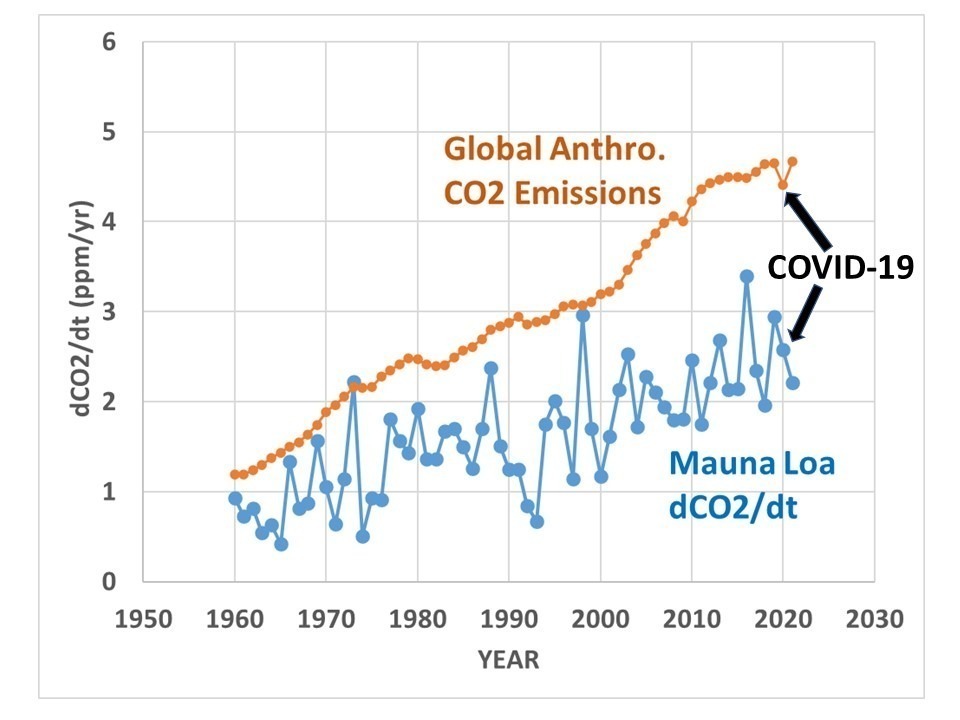
which simply means that the year-to-year changes in CO2 (dCO2/dt, Fig. 1b) are a function of (due to) yearly anthropogenic emissions over time (Anthro(t)). In this case, year-on-year changes in Mauna Loa CO2 should be highly correlated with yearly estimates of anthropogenic emissions. The actual relationship, however, is clearly not that simple, as seen in Fig. 2, where the anthropogenic emissions curve is much smoother than the Mauna Loa data.

Therefore, there are clearly natural processes at work in addition to the anthropogenic source. Also note those natural fluctuations are much bigger than the ~6% reduction in emissions between 2019 and 2020 due to the COVID-19 economic slowdown, a point that was emphasized in a recent study that claimed satellite CO2 observations combined with a global model of CO2 transports was able to identify the small reduction in CO2 emissions.
So, if you think there are also natural causes of year-to-year changes in CO2, you could write,
dCO2/dt ~ Anthro(t) + Natural(t),
which would approximate what carbon cycle modelers use, since it is known that El Nino and La Nina (as well as other natural modes of climate variability) also impact yearly changes in CO2 concentrations.
Or, if you think year-on-year changes are due to only sea surface temperature, you can write,
dCO2/dt ~ SST(i),
and you can then correlate year-on-year changes in CO2 to a dataset of yearly average SST.
Or, if you think causation is in the opposite direction, with changes in CO2 causing year-on-year changes in SST, you can write,
dSST/dt ~ CO2(t),
in which case you can correlate the year-on-year changes in SST with CO2 concentrations.
In addition to the master equation having a basis in physical processes, it avoids the problem of linear trends in two datasets being mistakenly attributed to a cause-and-effect relationship. Any time series of data that has just a linear trend is perfectly correlated with every other time series having just a linear trend, and yet that perfect correlation tells us nothing about causation.
But when we use the time derivative of the data, it is only the fluctuations from a linear trend that are correlated with another variable, giving some hope of inferring causation. If you question that statement, imagine that Mauna Loa CO2 has been rising at exactly 2 ppm per year, every year (instead of the variations seen in Fig. 1b). This would produce a linear trend, with no deviations from that trend. But in that case the year-on-year changes are all 2 ppm/year, and since there is no variation in those data, they cannot be correlated with anything, because there is no variance to be explained. Thus, using the master equation we avoid inferring cause-and-effect from linear trends in datasets.
Now, this data manipulation doesn’t guarantee we can infer causation, because with a limited set of data (63 years in the case of Mauna Loa CO2 data), you can expect to get some non-zero correlation even when no causal relationship exists. Using the ‘master equation’ just puts us a step closer to inferring causation.
Correlation of dCO2/dt with Various Potential Forcings
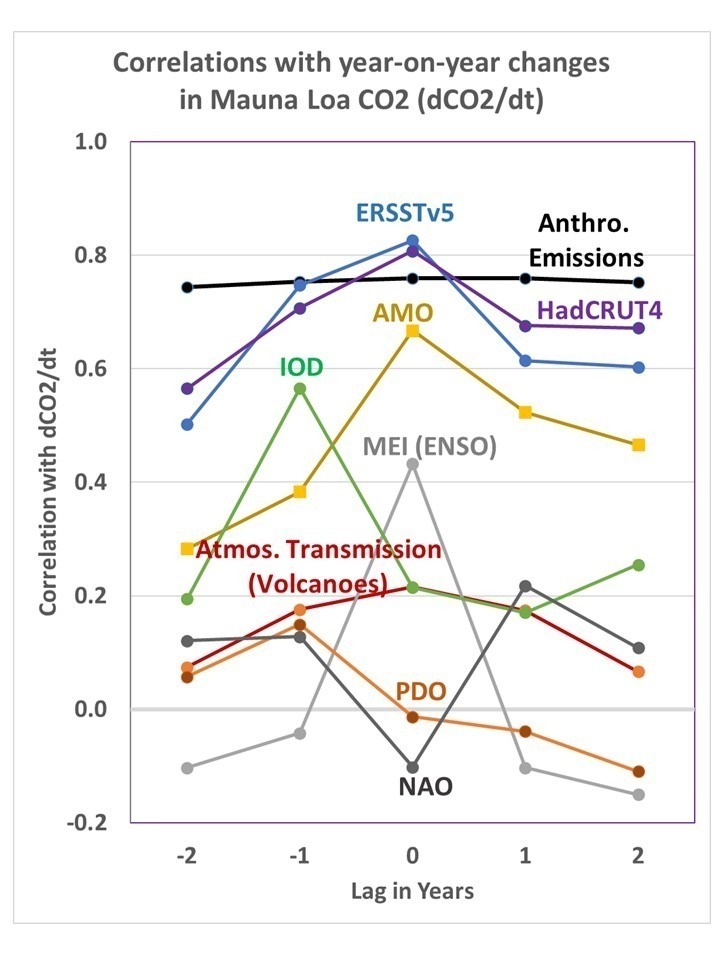
Lag correlations of the dCO2/dt data in Fig. 1b with estimates of global anthropogenic CO2 emissions, and with a variety of natural climate indicies, are shown in Fig. 3.

The first thing we notice is that the highest correlation is achieved with the surface temperature datasets, (tropical SST or global land+ocean HadCRUT4). This suggests at least some role for increasing surface temperatures causing increasing CO2, especially since if I turn the causation around (correlate dSST/dt with CO2), I get a very low correlation, 0.05.
Next we see that the yearly estimates of global anthropogenic CO2 emissions is also highly correlated with dCO2/dt. You might wonder, if the IPCC is correct and all of the CO2 increase has been due to anthropogenic emissions, why doesn’t it have the highest correlation? The answer could be as simple as noise in the data, especially considering the emissions estimates from China (the largest emitter) are quite uncertain.
The role of major volcanic eruptions in the Mauna Loa CO2 record is of considerable interest. When the atmospheric transmission of sunlight is reduced from a major volcanic eruption (El Chichon in 1983, and especially Pinatubo in 1991), the effect on atmospheric CO2 is to reduce the rate of rise. This is believed to be the result of scattered, diffuse sky radiation penetrating deeper into vegetation canopies and causing enhanced photosynthesis and thus a reduction in atmospheric CO2.
Regression Models of Mauna Loa CO2
At this point we can choose whatever forcing terms in Fig. 3 we want, and do a linear regression against dCO2/dt to get a statistical model of the Mauna Loa CO2 record.Â
For example, if I use only the anthropogenic term, the regression model is:
dCO2/dt = 0.491*Anthro(t) + 0.181,
with 57.8% explained variance.
Let’s look at what those regression terms mean. On average, the yearly increase in Mauna Loa CO2 equals 49.1% of total global emissions (in ppm/yr) plus a regression constant of 0.181 ppm/yr. If the model was perfect (only global anthropogenic emissions cause the CO2 rise, and we know those yearly emissions exactly, and Mauna Loa CO2 is a perfect estimate of global CO2), the regression constant of 0.181 would be 0.00. Instead, the anthro emissions estimates do not perfectly capture the rise in atmospheric CO2, and so a 0.181 ppm/yr “fudge factor” is in effect included each year by the regression to account for the imperfections in the model. It isn’t known how much of the model ‘imperfection’ is due to missing source terms (e.g. El Nino and La Nina or SST) versus noise in the data.
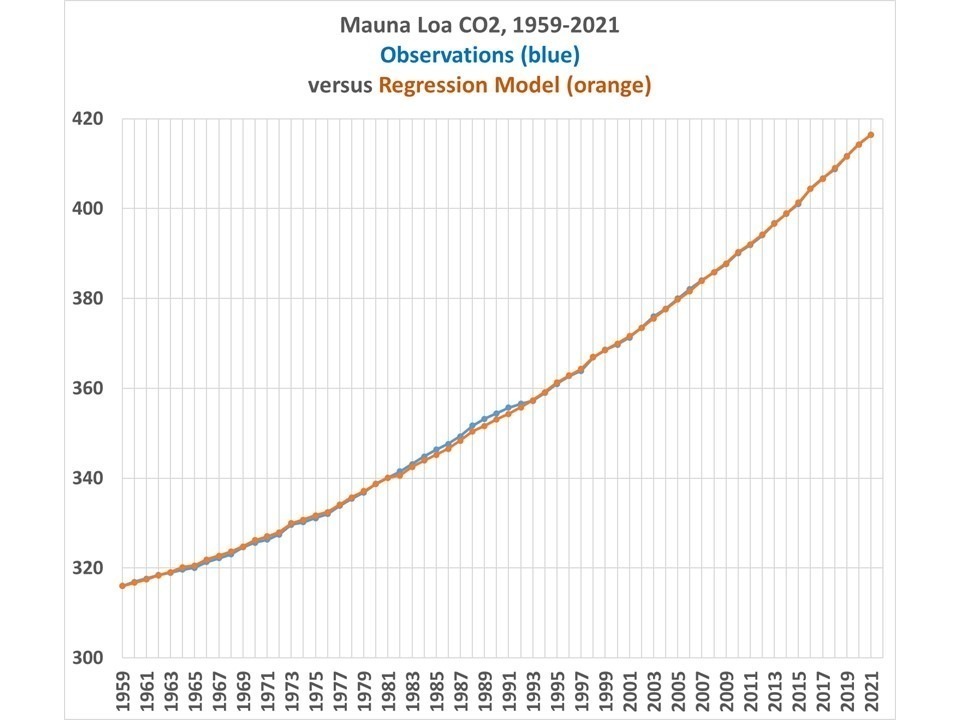
By using additional terms in the regression, we can get a better fit to the Mauna Loa data. For example, I chose a regression model that includes four terms, instead of one: Anthro, MEI, IOD, and Mauna Loa atmospheric transmission. In that case I can improve the regression model explained variance from 57.8% to 82.3%. The result is shown in Fig. 4.

In this case, the only substantial deviations of the model from observations is due to the El Chichon and Pinatubo volcanoes, since the Pinatubo event caused a much larger reduction in atmospheric CO2 than did El Chichon, despite the volcanoes producing very similar reductions in solar transmission measurements at Mauna Loa.
In this case, the role of anthropogenic emissions is reduced by 15% from the anthro-only regression model. This suggests (but does not prove) a limited role for natural factors contributing to increasing CO2 concentrations.
The model match to observations during the COVID-19 year of 2020 is very close, with only a 0.02 ppm difference between model and observations, compared to the 0.24 ppm estimated reduction in total anthropogenic emissions from 2019 to 2020.
Conclusions
The Mauna Loa CO2 data need to be converted to year-to-year changes before being empirically compared to other variables to ferret out possible causal mechanisms. This in effect uses the ‘master equation’ (a time differential equation) which is the basis of many physically-based treatments of physical systems. It, in effect, removes the linear trend in the dependent variable from the correlation analysis, and trends by themselves have no utility in determining cause-versus-effect from purely statistical analyses.
When the CO2 data are analyzed in this way, the greatest correlations are found with global (or tropical) surface temperature changes and estimated yearly anthropogenic emissions. Curiously, reversing the direction of causation between surface temperature and CO2 (yearly changes in SST [dSST/dt] being caused by increasing CO2) yields a very low correlation.
Using a regression model that has one anthropogenic source term and three natural forcing terms, a high level of agreement between model and observations is found, including during the COVID-19 year of 2020 when global CO2 emissions were reduced by about 6%.
Discover more from Watts Up With That?
Subscribe to get the latest posts sent to your email.
Without any higher math (although I am a real fan of mathematics) a question on the basis of the last sentence of the abstract (“One statistically-based model using anthropogenic and natural forcings suggests ~15% of the rise in CO2 being due to natural factors, with an excellent match between model and observations for the COVID-19 related downturn in global economic activity in 2020.”). As far as I can see from the graph of Mauna Loa, the yearly rise rate of the CO2-content is almost constant (almost a continuous line on the average, not on a monthly basis). However it is known, that the amount of the new CO2 in the atmosphere will be higher from year to year. The question: Where from does nature know, that the nature must produce more CO2 pro year to be able to provide a constant 15% share of the rise in CO2?
Too much differential equations to the pre-arithmetic green minds. Could Dr. Spencer be so kind as to change them so that people could make the calculations by counting on fingers?
I find this article to be a perfect example of the lack of a sense of proportion regarding atmospheric CO2. At 420ppm, CO2 is at a level of 1/24th of one percent of the atmosphere. A CO2 fire extinguisher containing less than one percent of CO2 would be considered empty and of no use in fighting a fire. Why then should we believe that the same tiny amount of CO2 in the atmosphere is driving the Earth’s air temperature and its climate?
I have frequently asked in arguments with warmistas that if CO2 was such an enormous reflector and positive feedback element to atmospheric warming, why don’t we insulate all our buildings with bags of CO2 rather than foam and fiberglass? Then we should be able to heat buildings with a candle in each room. .04 % of a gas controlling the other 99.96% is a thermodynamic free lunch.
If you have walls with 70 km space, that would work. Not with walls of 15-20 cm. In the atmosphere the total effect is over 70 km from surface to almost space…
Even so the gain from a CO2 doubling over 70 km is only 1°C, by far not enough to be comfortable in house.
And with sufficient insulation, indeed one can heat a room with a candle or simply with your body temperature, but that is not reachable with CO2…
Bill, that is a non-argument.
Replace the CO2 levels with same amount of hydrogen cyanide (HCN) and all animal life will drop dead.
Relative amounts don’t say anything about the effect: in the case of CO2 the effect on temperature is very modest, but not zero and mostly beneficial.
Your argument does not make sense. The ability of an amount of hydrogen cyanide to kill all animal life does not guarantee that an equal amount of CO2 is able to have an effect upon the air temperature of the Earth. The entities involved do not have the same characteristics and the tasks are not the same. .
Bill, my point is that you can’t use (relative) quantities as an argument. Neither for HCN as for CO2. You only can use that in combination with the effect for the quantities involved.
For CO2, every doubling has a (theoretical) effect of increasing the surface temperatures with about 0.7°C according to Van Wijngaerden en Happer, based on very accurate measurements in laboratories and confirmed by real life measurements. The IPCC multiplies that to 1.5°C – 4.5°C in their climate models, which are driving much too hot.
In reality not much and certainly no disaster, but not negligible either…
I’m not using relative quantities. You introduced that. I’m only saying that the level of CO2 in the atmosphere is not sufficient to cause temperature change large enough to be noticed by the devices in use to measure temperature as part of the world-wide measuring system.
I’d be willing to bet that 99.9% of the “pre-arithmetic green minds” can’t count on their fingers in binary either.
changes in atmospheric carbon isotopes over time
that argument used to seem very persuasive before I met the flow models
logically it seems there must be some anthro component, but not sure I’m convinced we have strong evidence for its bounds, or can even say exactly what CO2 PPM would be without any anthro component
And, the isotope argument doesn’t account for isotopic fractionation as CO2 enters and leaves water bodies. 12C should require less energy to cross the water/air barrier than 13C. The isotope argument only deals with some of the data.
Clyde, don’t use arguments that are refuted already a long time ago.
Of course the fractionation of the different isotopes at the water-air and air-water exchanges are known:
-10 per mil δ13C from water to air
-2 per mil δ13C from air to water
for a full cycle in equilibrium that gives a change of -8 per mil δ13C between water and air:
https://scope.dge.carnegiescience.edu/SCOPE_16/SCOPE_16_1.5.05_Siegenthaler_249-257.pdf
The deep oceans are around zero per mil, but the ocean surface is between +1 and +5 per mil δ13C, due to bio-life.
Over the past 10,000 years the ratio in the atmosphere was around -6.4 +/- 0.2 per mil δ13C.
Only in the past 170 years, levels dropped with more than 1.8 per mil to currently -8.2 per mil δ13C.
The only possible source: human emissions…
Assuming that the ocean – air circulation tries to restore the -6.4 per mil, one can estimate the deep ocean – air CO2 exchange. About 40 PgC/year:
Clyde,
If you expand Ferdinand’s plot you will see that his red line (40 PgC/yr) is below the observations from about 1890 to almost 1980. Here is my ‘model’ – the small bright green triangles – overlain on his plot.
My ‘model’ is simply based on the knowledge that the average δ13C of the incremental atmospheric CO2 has been -13 per mil since the start of CO2 growth (a coincidence according to Ferdinand). Why is it so consistent? I do not know, but it is demonstrated by analysis of the published data (direct atmospheric observations and Law Dome), it results in a much better match to the observations and, critically, it provides a major constraint on any hypotheses.
TallDave,
There are only two main sources of low-13C carbon in the world: fossil organics and recent organics. All inorganic CO2 (oceans, carbonate rock, volcanic vents,…) is higher in 13C.
Recent organics, that is the biosphere as a whole, is more sink than source for CO2, the earth is greening. Thus also an extra sink for 12CO2, and leaving relative more 13CO2 in the atmosphere, thus not the cause of the enormous drop in δ13C we see over the past 170 years. Only human emissions of low-13C are the cause and nothing else in such huge quantities.
That is reflected as well as in the atmosphere as in high resolution (2-4 years) coralline sponges which reflect the δ13C level of the ocean surface:
So what?
What does the extra CO2 do other than cause more greening?
Agreed, but my point is that the firm drop of 13C shows that human emissions are the (only) source of that drop and already 10% of the current atmosphere… Which is one of the many arguments that humans are the main cause of the CO2 increase in the atmosphere…
According to many here, human CO2 just disappears in space and the whole increase of CO2 is due to some mysterious natural phenomenon that just starts when humans started to use fossil fuels and increased in incredible fixed ratio to human emissions…
And they think that the alarmists will be convinced by that “argument”…
Ferdinand
have you ever said ANYWHERE that more CO2 in the air is NOT the cause of more warming? Your arguments have helped the idiots working for the IPCC.
For once, give me a clear answer on my comment
https://wattsupwiththat.com/2022/04/09/explaining-mauna-loa-co2-increases-with-anthropogenic-and-natural-influences/#comment-3495514
HenryP,
I have never said that, because CO2 IS a cause of more warming. Not much, but not zero either.
That not only is proven in laboratory measurements, but again in the field by the amount energy that was and is measured in back radiation and even specifically in the bands that are occupied by CO2: From 2000 to 2010, there is an increase of about 0.2 W/m2 extra from 22 ppmv CO2 extra:
https://escholarship.org/content/qt3428v1r6/qt3428v1r6.pdf
To start with where you have complete lost the plot:
“The Gas Law (PV=nRT) implies that due to the diffusion and equal dissipation of the extra CO2 into our atmosphere, especially TOA, the rate of warming of earth must be the more or less the same wherever you measure.”
The gas law has really nothing to do with the greenhouse effect. Nothing, zero, nada.
The greenhouse effect is about radiation, not pressure or volume or temperature of any gas.
That is when specific molecules catch IR waves of specific wavelength and send these again out in any direction, including back to earth. It doesn’t make any difference for a CO2 molecule if it is hit by a 10 micron IR wave: that will be absorbed (and eventually re-emitted) when at 1 bar pressure near surface or 1 microbar pressure high in the stratosphere, neither makes temperature any difference: from 283 K to 28.3 K: the same wave gets captured and a similar wave will be send out, if the time to the next collusion with other inert molecules (N2, O2) allows.
The latter is of course more frequent at high pressure than at low pressure.
And it is about energy transport, not temperature or heat. If the same amount of radiant energy falls on land that will cause more heating up or less cooling down than when hitting the oceans, for two reasons: in the oceans most IR absorption is directly used for evaporation, on land most is absorbed and adds to the energy budget.
Moreover land and ocean have different specific heat, thus for the same amount of radiant energy absorbed, land will warm faster than sea.
Then your references, to start and end with the “here1”:
https://www.scirp.org/journal/paperinformation.aspx?paperid=99608
From the expectations:
“The strength of this IR backscatter can be measured by the IR2 detector. This added energy will heat the rear wall and this will increase the temperature of the air in the rear chamber, according to the Greenhouse Effect.”
Of course not, only a black body does absorb IR, air doesn’t and white Styrofoam neither (I suppose). Only the black heating plate could do that. And then in both directions, reducing the possible temperature increase in half.
They measured the increase in temperature of the plate maybe once, but in the case of the electric heating, they adjusted the temperature of the plate to maintain the 100°C, thus effectively compensating the external heating to the extra internal heating from the back radiation by CO2…
I am not sure if they didn’t something similar for the heating lamp…
They expect to see an increase of about 4 K from the measured (!) back radiation, but that is the temperature increase that they expect from the total gas content. In fact the black painted heating plate is the only part of the experiment which absorbs the IR back radiation. That is some 3% extra heat input that must warm the rest of the air in the equipment.
What I am sure of is that, if there is 30 W/m2 back radiation, that can’t be lost, there is some law about the conservation of energy that must be obeyed…
If they couldn’t measure that in some temperature increase (they have measured the returning radiant energy!), then there was something wrong with their experiment…
Ferdinand
I will come back to your comment here at some time in the future but the arguments you make have nothing to do with my question I posed Roy on this thread. You were supposed to give a reasoned explanation for the results in Table 2, more especially heat-in versus latitude.
https://breadonthewater.co.za/2022/03/08/who-or-what-turned-up-the-heat/
Here is a good hint.
https://www.ad.nl/wetenschap/onderzoekers-mysterieuze-veranderingen-in-temperatuur-neptunus~a480d189/
The atmospheric CO2 level also began to increase at about the same time that the theoretical five hundred year warming period began and the Earth’s vegetation began to increase. Add to that the fact that the CO2 increase and the global air temperature increase do not corelate.
Over the past 800,000 years there was a rather constant ratio between temperature and CO2 levels in the atmosphere of about 8 ppmv/K for Antarctic temperatures or about 16 ppmv/K.
There was a less than 10 ppmv drop in CO2 between the warm MWP and the cold LIA. The warming since the LIA then is good for only maximum 13 ppmv, not 120 ppmv…
Humans emitted over 200 ppmv since 1850. What else could be the cause?
If you believe some of the mapping using OCO-2 data, it would appear to be the increased vegetation caused by the warming. That mapping shows the highest concentrations of CO2 to be located at the most extensive vegetation (jungles).. I also wonder at the accuracy of earlier CO2 measurement. If it were based on ice core measurements then I think it is grossly inaccurate. OCO-2 data mapping shows a low presence of CO2 in areas that would have produced ice cores that had never melted and re-frozen. Such areas would also have no vegetation and would probably show little or no variation in CO2 level
Ferdinand
How do you know that 200 ppm caused any direct warming?
I could not find a net warming effect when I carefully analyzed the IR spectrum.
My finding is that the CO2 causes more greening and this traps some heat.
The study you referred to earlier is, i.e.
https://escholarship.org/content/qt3428v1r6/qt3428v1r6.pdf
is of the same ilk as the one they made before, when they started with this CO2 nonsense. It is a correlation study where delta T is observed against delta [CO2] at 2 places on earth. They tell you that from the start but the results are just reported or converted to W/m2 so that you must think it is not a simple correlation study.
Nou ja, as you know, correlation is not causation, especially not with Henry’s Law around and nobody knowing, for example, how much carbonates are in the oceans, exactly, and how much insoluble carbonates are lying on the bottom of the oceans.
You should please stop with this nonsense about ppm’s CO2 from mankind because it is not even relevant and it does not help our cause, i.e. to make an end to spending so much money on the
The Green Illusion | Bread on the water
HenryP, Feldman e.a. not even mentioned temperature in the back radiation that was measured, he only measured the full spectrum of back radiation and concluded that the 22 ppmv extra CO2 added 0.2 W/m2 to the back radiation. That is energy and when hitting the earth and absorbed, that adds to the energy budget. If that gives more warming or less cooling, depends of the local energy budget, but in general a CO2 doubling adds 0.7 K to a planet in energetic equilibrium, according to Van Wijngaerden and Happer.
That has nothing to do with correlation, only with radiant energy, which can and is measured.
From the abstract:
“Here we present observationally based evidence of clear sky CO2 surface radiative forcing that is directly attributable to the increase, between 2000 and 2010, of 22 parts per million atmospheric CO2.”
and
“The time series both show statistically significant trends of 0.2 W/m2 per decade”
Where do you see the word “temperature”?
The same for the Henry’s law: even if you don’t have any clue about (bi)carbonates in the oceans, there were hundredthousands of pCO2 measurements of seawater all over the oceans, which show as area weighted average that the pCO2 of the oceans is about 7 μatm lower than in the atmosphere, which implies that the net CO2 flux is from the atmosphere into the oceans, not reverse.
https://www.pmel.noaa.gov/pubs/outstand/feel2331/mean.shtml
Confirmed by the increase of DIC at all places where there are longer time series available:
https://tos.org/oceanography/assets/docs/27-1_bates.pdf
That means that CO2 and derivatives in the oceans are increasing with lowering pH and thus not the cause of the increase of CO2 in the atmosphere (when the pH lowers, CO2/DIC should decrease, not increase)…
Ferdinand,
perhaps try reading the report?
quote
In principle, CO2forcing can be predicted from knowledge of the atmospheric state assuming exact spectroscopy and accurate radiative transfer. Forcing can then be estimated using radiative transfer calculations with atmospheric temperature
end quote
they use atmospheric temperature to ‘calculate’ the forcing
but they are assuming that there is a net warming effect of CO2 and the ” calculation’ is probably estimated from the past, by using the original dumb formula.
The 4W/m^2 or 3.7W/m^2 values that many choose to mention from the IPCC is actually bogus and it is from a misleading calculation.
It relies on the surface temperature for it to be derived.
rf = f * ln([CO2]/[CO2]prein)/ln(2) becoming AF = 5.35 ln(CO2/CO2) = 3.7 W/m^2
f = Factor including 0.6C that was used at the time representing all the global warming.
[CO2]prein = CO2 concentration pre-industry (1850)
“The forcing due to a doubling of carbon dioxide is 3.7 Wm2[Andreae et al., 2005], while the observed change in surface-air temperature is taken to be 0.6°C.”
It fails to distinguish any temperature from natural or unnatural sources and presumes all the 0.6C was caused by more CO2
There is no warming effect from more CO2. All observations and subsequent calculations are based on observed warming versus observed increase in CO2. It is pure stupidity. But as we all know, more CO2 follows heat and not the other way around. More green comes from more CO2 and this traps heat. Earth itself has also a lot of energy and only this can explain the figures in my Table 2, which by the way, all came from peer reviewed reports and officially recognized data sets. Read my my final report on this matter and get wise(click on my name)
Can ANYBODY give a reasoned explanation for the figures in my Table 2 other than the one I have given? I am all ears.
Sigh…..
HenryP,
You have a quite different interpretation to what is written…
The factor f has nothing to do with temperature and certainly not the pre-industrial effect of CO2, which is much larger than 0.6°C than you suppose.
It is simply the calculated factor, that is what it is, for each doubling of CO2, where the radiant energy of CO2 is measured line by line for each side band, when the main bands of CO2 are saturated.
Van Wijngaerden and Happer only came to a smaller factor by looking at more detailed line spectra for CO2: 2.7 W/m2 i.s.o. 3.7 W/m2, because of a smaller factor f, without looking at any temperature. Each line in a spectrum represents energy in W/m2, depending of amplitude and wavelength, no need at all to know temperature.
Last but not least, CO2 follows temperature on al time scales: seasonal, year by year (opposite to each other!) and multi-millennia, but CO2 by far leads temperature over the past 170 years.
Moreover, that CO2 follows temperature doesn’t exclude that temperature can be influenced by more CO2. As long as the total fortification is much smaller than unity, there is no runaway effect, they only somewhat increase each other:
I see a clear correlation with peaks during El Nino years (outgassing?), could the corona-dip be explained by La Nina dominated last 2 years? There are some non-El Nino years with high emission score but giving low to no increase in co2 level.
I understand oceans do in- and exhale co2 according to its temperature, resp. cold and warm, and Mauna Loa being at first row of it. The respons to ocean seems to me much larger than role of our emissions.
Roy, You are nearly there. CO2 has no effect on sea surface temperature (well known and proved by experimentation) but SST has an effect on CO2 level. The reason for that is the solubility of CO2 in fresh and saline waters decreases with increasing temperature (and vice versa)- a well known and experimental fact which is shown in publications such as the chemical engineering handbook. Many scientists have no understanding of physical properties and reactions plus have no clues about engineering subjects such as thermodynamics. Please Roy, look into the Chemical Engineering Handbook and get some clues (you will find mathematics and statistics there also)
cementafriend,
Influence of seawater temperature on atmospheric CO2 levels: 12-16 ppmv/K per Henry’s law. Maximum 13 ppmv since the LIA. The rest of the 120 ppmv increase is from human emissions (around 200 ppmv since 1850)…
Confirmed by hundredthousands of seawater samples in the past centuries and the drop of CO2 level during the LIA. If the MWP was at least as warm as today, then we would be around 285 ppmv, not 415 ppmv…
Could your conclusions be in large part because Henry’s Law applies? In reality the oceans contain 98% of the surface CO2 and that must be in a temperature related equilibrium with the atmospheric concentration over time. So Henry’s law makes it clear hIgher SST means higher atmospheric CO2, as you found, because solubility decreases with water temperature.
No models required to know that, its proven physics, right?
Taking a more daft view, if you think increasing atmospheric CO2 emissions will permanently change the atmosphere over time, ain’t it necessary to consider that every ppm rise in atmospheric CO2 must require 50ppm to be absorbed by the Oceans if Henry’s Law is to be obeyed?
PS IF Henry’s law is followed over a reasonable cycle time for the process, as SST’s rise, and hence CO2 is lost from the ocean to the atmosphere, ocean pH must decrease, not increase.
etc. Did I get something wrong above. Henry’s Law matters. And Photosynthesis.
Brian, the total quantity of CO2 and derivatives (-bi-carbonates) doesn’t matter for Henry’s law. All what matters is the real CO2 partial pressure of CO2 (pCO2) of seawater at the surface.
If you fill a bottle of soda water from the same carbonated batch, it hardly matters if you shake a bottle of 0.5, 1 or 1.5 liter: you will find (nearly) the same pressure under the cap for the same temperature.
What matters is the concentration and temperature at the oceans surface.
For the same concentration, the influence of a change in temperature is exactly known (as measured with thousands of samples) and can be calculated with the following formula:
(pCO2)sw @ur momisugly Tin situ = (pCO2)sw @ur momisugly Teq x EXP[0.0423 x (Tin-situ – Teq)]
where Tin situ is the temperature of the seawater inlet and Teq the temperature at the equalizer where the pCO2 of seawater is measured.
That formula is used to compensate the measured pCO2 for the temperature difference between the ship’s inlet and the temperature of the continuous pCO2 measurement equipment on board of commercial sea ships.
That formula is the same for a static single seawater sample as good as for the complete dynamic equilibrium of the total oceans…
If the oceans warm from average 15°C to 16°C that would give a difference of 12 μatm in ocean pCO2. To get a dynamic equilibrium in the atmosphere with the oceans, the atmosphere must increase with 12 μatm (~12 ppmv) too.
Every ocean part that is warmer will release CO2, every ocean part that is cooler will absorb CO2, but at 12 ppmv extra in the atmosphere, release and absorption are equal.
Further, one need to make a differentiation between the upper ocean layer and the deep oceans. The latter are largely isolated from the atmosphere and only at near the poles CO2 sinks with the cold waters and comes back some 1,000 years later near the equator. That exchange is quite limited.
The ocean surface only contains about 1,000 PgC, comparable with the current atmosphere at about 800 PgC and moreover has a limited buffer capacity.
While Henry’s law works the same for fresh and seawater, in fresh water pure, dissolved, CO2 is 99% of all inorganic carbon species (DIC). In seawater CO2 is only 1%, 90% are bicarbonates and 9% carbonates. These don’t count for Henry’s law…
The point is that due to chemistry, a 100% increase in the atmosphere gives a 100% increase in dissolved CO2 in both fresh water and seawater (thanks to Henry’s law), that is a near doubling in fresh water but only from 1% to 2% in seawater… Despite that, the following reactions increase the total inorganic carbon content of seawater up to 10% of the change in the atmosphere. That is the Revelle/buffer factor. Even so about 10 times more CO2 get dissolved in seawater than on fresh water for the same change in the atmosphere…
The pH of seawater increases when CO2 is released, as also H+ decreases. It decreases when extra CO2 is absorbed, as is the case nowadays.
No, Ferdinand. You are still wrong.
I gave up on this scene a few years ago. Just no point trying to convince people of what they don’t want to believe. Too bad I happened on this after the board has gone stale and you will probably never see this. But, dCO2/dt is still faithfully tracking T.
It’s utterly pointless to argue that ML is merely noise to a plot of the integral of NH SST, but not for good reasons.
I put forward my argument on a conservative blog and got back an argument that the plot of dCO2/dt in ppm per month was the result of subtracting out 99.8% of the data. In my third attempt to point out how stupid this argument was, I used the example of how a 100 ppm change in 5 decades would be 20 ppm per month, not subtracting out 4/5th of the data. The rebuttal was a fatal flaw in my argument – they have been measuring at ML for 60 years.
I also tried to point out that his argument was like trying to argue with a cop that you were only doing 1 in a 50 zone, not 60 because you were driving at 1 km per minute.
It’s not just his recalcitrance that stuck in my mind, it’s how conservative readers on the conservative blog lapped it up.
Robert, you can’t deduce the cause of a trend by looking at the variability around the trend…
Seasonally the huge amplitude is caused by vegetation: higher temperatures: more CO2 uptake.
Year by year, the variability also is caused by vegetation: higher temperature, more CO2 loss.
Long term trend of vegetation: more uptake than loss, with slightly increasing temperatures… The earth is greening.
It is like saying that there is no sea level change, because the few mm/year are not measurable in the huge noise of waves and tides: you need at least 20 years of data to calculate a statistical trend…
For the CO2 increase in the atmosphere, the trend is already confirmed after 3 years in a row and temperature is not the cause: the influence of the increase of the average seawater surface temperature is not more than 12-16 ppmv/K per Henry’s law…
Ferdinand,
perhaps try reading the report?
quote
In principle, CO2forcing can be predicted from knowledge of the atmospheric state assuming exact spectroscopy and accurate radiative transfer. Forcing can then be estimated using radiative transfer calculations with atmospheric temperature
end quote
they use atmospheric temperature to ‘calculate’ the forcing
but they are assuming that there is a net warming effect of CO2 and the ” calculation’ is probably estimated from the past, by using the original dumb formula.
The 4W/m^2 or 3.7W/m^2 values that many choose to mention from the IPCC is actually bogus and it is from a misleading calculation.
It relies on the surface temperature for it to be derived.
rf = f * ln([CO2]/[CO2]prein)/ln(2) becoming AF = 5.35 ln(CO2/CO2) = 3.7 W/m^2
f = Factor including 0.6C that was used at the time representing all the global warming.
[CO2]prein = CO2 concentration pre-industry (1850)
“The forcing due to a doubling of carbon dioxide is 3.7 Wm2[Andreae et al., 2005], while the observed change in surface-air temperature is taken to be 0.6°C.”
It fails to distinguish any temperature from natural or unnatural sources and presumes all the 0.6C was caused by more CO2
There is no warming effect from more CO2. All observations and subsequent calculations are based on observed warming versus observed increase in CO2. It is pure stupidity. But as we all know, more CO2 follows heat and not the other way around. More green comes from more CO2 and this traps heat. Earth itself has also a lot of energy and only this can explain the figures in my Table 2, which by the way, all came from peer reviewed reports and officially recognized data sets. Read my my final report on this matter and get wise(click on my name)
Can ANYBODY give a reasoned explanation for the figures in my Table 2 other than the one I have given? I am all ears.
Sigh…..
Sigh….
There is no warming effect from more CO2 itself.
All observations and subsequent calculations are based on observed warming versus observed increase in CO2. It is pure stupidity. But as we all know, more CO2 follows heat and not the other way around. More green comes from more CO2 and this traps heat. Earth itself has also a lot of energy and only this can explain the figures in my Table 2, which by the way, all came from peer reviewed reports and officially recognized data sets. Read my my final report on this matter and get wise(click on my name)
Can ANYBODY give a reasoned explanation for the figures in my Table 2 other than the one I have given? I am all ears.
Sigh…..
Click on my name to get to the report and find Table 2
The rate of emissions from 2002 was about three times the rate prior to that, and would seem to be due to China’s accelerating energy generating ability. Atmospheric CO2 does not show this increase. Similarly the fall in emissions consequent on the Great Financial Crisis of 2007-8 does not seem to be recorded in atmospheric record, particularly the rapid increase from 2009-10? Can someone explain this perhaps?