By Christopher Monckton of Brenchley
Andy May’s splendid brace of articles about climate sensitivity, which gives a concise and elegant summary of close to half a century of scientific debate, concludes as follows:
“The ‘consensus’ estimates of the impact of greenhouse gases, especially CO2, on climate and global warming are the same as they were 42 years ago. The uncertainty has not narrowed. Observations invalidate the high IPCC modelled climate sensitivity today, just as they did for the National Research Council in 1979. …
“It is terribly sad that, after spending billions of dollars and untold man-hours, we have not narrowed the range of climate sensitivity to CO2 since 1979.”
In this essay, I propose to explain why it is that the range of predictions of future global warming remains so broad, and so excessive, and how it can be quite tightly constrained.
Andy’s words above echo those of the deputy director of the Russian Academy of Sciences, Academician Semenov, at a high-level meeting on climate sensitivity that I attended in Moscow at the invitation of the City Government two years ago. Academician Semenov opened the meeting by saying it was unsatisfactory that the interval of equilibrium sensitivities has remained as broad and as unconstrained as it is for as long as it has.
I replied that the reason why climate sensitivities had proven unconstrainable was the mistreatment of temperature feedback in climatology. Semenov drew me aside after the meeting, together with an IPCC representative, and I was asked to explain what I had meant.
Semenov, on hearing what I had to say, and on seeing that the IPCC representative could not refute it, called in the chief architect of the Russian climate model, who took careful notes.

Fig. 1. Rectangular-hyperbolic system response ECS to projected feedback fractions H > 0.5 entails excessive, ill-constrained ECS, while H < 0.25 constrains ECS well.
The problem is that unit feedback response (per degree of reference sensitivity), and hence the system-gain factor (the ratio of equilibrium sensitivity including feedback response to reference sensitivity excluding it), and hence equilibrium sensitivity itself, respond rectangular-hyperbolically to the feedback fraction (Fig. 1).
Because climatologists imagine (unjustifiably, as I shall show) that the feedback fraction is around 0.75, their predictions of global warming are both excessive and ill-constrained. The lack of constraint arises because the entire interval of overstated official global-warming predictions falls on the part of the rectangular hyperbola that soars away towards infinity.
I shall not be relying upon the climate models, because, as Pat Frank’s paper of 2019 on propagation of uncertainty in time-step models has definitively demonstrated, models cannot accurately predict global warming. They can tell us absolutely nothing – nothing at all – about how much warming we may cause. They may have many other purposes, but that is not one of them.
Pat – whose paper has not been refuted in the learned journals, though there have been one or two strikingly ignorant blog posts about it – has now written to draw the attention of the IPCC, via its error-reporting protocol, to its mistake in relying upon models for predicting future warming, For he has proven, using the standard validation technique of statistical propagation of uncertainty, that all the models’ predictions are no better than guesswork.
He has not received a reply, of course. For his paper – perhaps the most important ever to have been published in the field of climate-sensitivity studies – renders the entire basis for IPCC’s predictions, and for the pathetic pandemic of panic about warmer worldwide weather, null and void.
Instead, I shall use an earlier and inherently more reliable method of constraining equilibrium doubled-CO2 sensitivity (ECS), which is approximately equal to the entire all-causes anthropogenic warming over the 21st century (the two radiative forcings being about the same, at 3.5 Watts per square meter).
That powerful empirical constraint on equilibrium sensitivities outside GCMs, still deployed today, is apportionment of the total greenhouse effect between three quantities: direct warming by natural and anthropogenic greenhouse gases and feedback response –
“The strength of the greenhouse effect can be gauged by the difference between the effective emitting temperature of the Earth as seen from space (about 255 K) and the globally-averaged surface temperature …” (IPCC 1990, p. 48).
Let us begin by agreeing some quantities. In my submission, the quantities in the following paragraphs are, broadly speaking, agreed by all sides in the climate debate.
First, as IPCC says above, the emission temperature that would prevail near the Earth’s surface in the total absence of greenhouse gases at the outset would be about 255 K.
As Professor Lindzen, the world’s foremost climatologist, said in a paper published in 1994, the true zero-feedback emission temperature, before allowing for any greenhouse-gas warming or feedback response, is more like 271 K once one has recalled that clouds would not be present in the absence of greenhouse gases. However, that is before allowing for Hölder’s inequalities between integrals, which might bring emission temperature back down to about 255 K.
As Professor Brown has written in these columns, establishing the true emission temperature is not a trivial problem. Here, ad argumentum, we shall consider an interval 255 [240, 270] K of emission temperature.
Today’s global mean surface temperature is about 288.5 K. Therefore, the midrange total greenhouse effect is 288.5 – 255, or 33.5 K. The 33.5 K greenhouse effect is the sum of three components: direct warming forced by preindustrial noncondensing greenhouse gases to 1850, before we had any significant influence on climate; direct warming forced by anthropogenic noncondensing greenhouse gases during the industrial era from 1850-2020; and feedback response.
Table 1. Preindustrial greenhouse-gas forcings

Table 1, based on concentrations of greenhouse gases in 1850 from Meinshausen+ (2017), gives the preindustrial radiative forcing to 1850 from the principal radiatively-active species. CFCs and HFCs are excluded because in 1850 their concentration was negligible.
Since the Planck sensitivity parameter (the first derivative of the Stefan-Boltzmann equation) is about 0.3 Kelvin per Watt per square meter, the direct warming by preindustrial greenhouse gases was 0.3 x 25.3, or 7.6 K.
Anthropogenic forcing from 1850-2020 was 3.2 Watts per square meter (NOAA AGGI), with all non-greenhouse-gas anthropogenic forcings broadly self-canceling, so that direct period warming by anthropogenic greenhouse gases was about 0.9 K.
Therefore, the 33.5 K total greenhouse effect to date comprises 7.6 + 0.8 = 8.5 K direct greenhouse-gas warming, and 25 K feedback response.
We have also allowed for a 10% uncertainty (Cess et al. 1993) either side of the midrange 8.5 K estimate of total natural and anthropogenic reference sensitivity to date, and, simili modo, 10% either side of the midrange 1.06 K reference doubled-CO2 sensitivity (RCS: the product of the 0.3 K W–1 m2 Planck sensitivity parameter and the 3.52 W m–2 CMIP6 mean doubled-CO2 radiative forcing: Zelinka+ 2020).
Climatologists universally but erroneously assume that all of the 25 K feedback response to date must be feedback response to the 8.5 K direct warming by natural and anthropogenic greenhouse gases.
In logic, climatologists’ position cannot be correct. For the feedback processes that subsist at any given moment in a dynamical system such as the climate are inanimate. They have no freedom to decide that they will not respond at all to the first 29/30 of the 263.5 K total reference temperature in 2020, but that they will respond only, and suddenly, and very vigorously, to the final 1/30. Where is the sense in that?
Therefore, at any specified moment, such as the present, the feedback processes subsisting in the dynamical system of interest, the climate, must perforce respond equally to each degree of the 263.5 K total reference temperature.
The unit feedback response is, at that specified moment, applicable equally to each degree of reference temperature, without distinction. To the inanimate feedback processes, a Kelvin is a Kelvin is a Kelvin, regardless of its origin.
Therefore, the unit feedback response is not 25 / 8.5, or ~3, as climate scientists imagine. It is 25 / (255 + 8.5), or less than 0.1. Their implicit midrange unit feedback response is overstated by a factor 30.
Thus, the system-gain factor (just add 1 to the unit feedback response) is not 33.5 / 8.5, or ~4, as implied by the midrange CMIP6 ECS projection. It is (255 +33.5) / (255 + 8.5), or <1.1.
ECS, then, is not 4 times the 1.06 K RCS: after correction, it is <1.1 times RCS: i.e, more like 1.1-1.2 K. The currently-imagined ~4 K mean midrange ECS in the CMIP6 models is thus a near-fourfold overstatement – another reason why we do not concern ourselves with the models.
Table 2 shows that, though the current method of deriving ECS by apportionment of the total greenhouse effect is very sensitive to quite small uncertainties in emission temperature and in reference sensitivity to greenhouse gases, the corrected method is far less sensitive, for the dominance of emission temperature in the corrected equations calms everything down.
Table 2. ECS derived from current and corrected apportionments of the greenhouse effect

Sure enough, the use of mainstream, midrange data for the industrial era, making due allowance for the currently-estimated Earth energy imbalance, gives midrange ECS of 1.1 K, near-identical to the midrange 1.2 K obtained straightforwardly by correctly apportioning the total greenhouse effect.
At any moment, the feedback processes subsisting at that moment must necessarily respond equally and without discrimination to each degree of the then-subsisting total reference temperature. Therefore, at that moment, the magnitude of the feedback response to each component in that reference temperature is necessarily and strictly proportional to the magnitude of that component.
Thus, in the midrange case, the three components in the 263.5 K reference temperature are the 255 K emission temperature, the 7.6 K natural reference sensitivity and the 0.9 K anthropogenic reference sensitivity.
Therefore the three components in the 25 K total feedback response are the feedback responses of 24.2 K to emission temperature, 0.7 K to natural reference sensitivity and 0.1 K to anthropogenic reference sensitivity.
Note that this strictly-proportional apportionment at any given moment does not necessarily entail invariance of unit feedback response and consequently of the system-gain factor with temperature: it is simply an Augenblick of the position obtaining at that moment.
However, given that the 3.2 W m–2 total anthropogenic forcing to date is equivalent to 90% of the 3.52 W m–2 doubled-CO2 forcing, and given that RCS is little more than 1 K, it is scarcely credible that ECS will fall on the currently-implicit interval 4 [2, 6] K, for that would imply, per impossibile, that the doubled-CO2 unit feedback response 3 [1, 5] would exceed the industrial-era unit feedback response 1.1 – 1 = 0.1 by a factor 30 [10, 50].
Climatologists, by not realizing that emission temperature is by far the largest contributor to feedback response, mistakenly added the 24.2 K emission-temperature feedback response to, and miscounted it as though it were part of, the 0.8 K feedback response to direct warming forced by natural and anthropogenic greenhouse gases.
Thus, they exaggerated all the feedback-related quantities – including the unit feedback response (per degree of reference sensitivity), the feedback fraction (the fraction of equilibrium sensitivity represented by feedback response, and the system-gain factor. Table 3 shows the current and corrected calculations for these and other feedback-related quantities:
Table 3. Excess of current over corrected values of key feedback-related variables

There, then, is the answer to Andy May’s question. Suddenly, the hitherto-unconstrainable equilibrium sensitivities become constrained – and their entire interval turns out to be below the lower bound of the currently-imagined interval. Inserting the 255 K emission temperature in the equations for the relevant feedback-related variables calms the entire system down, and leads us to expect a small, slow, harmless, net-beneficial warming over the coming century.
Unless, that is, the solar grand minimum first adumbrated by Soon and Baliunas, Habibullo Abdussamatov, Valentina Zharkova, David Archibald, David Evans and others, and now beginning to be anticipated even by official climatology, cancels much or perhaps all of the 1.1-1.2 K 21st-century warming that is all that we can realistically hope for.
“Table 2 shows that, though the current method of deriving ECS by apportionment of the total greenhouse effect”
This is not anybody’s “current method”.
“Climatologists, by not realizing that emission temperature is by far the largest contributor to feedback response, mistakenly added the 24.2 K emission-temperature feedback response to, and miscounted it as though it were part of, the 0.8 K feedback response to direct warming forced by natural and anthropogenic greenhouse gases.”
Who on Earth does that to determine ECS?
Mr Stokes is wrong as usual. Lacis et al. (2010) explicitly state that 75% of the entire greenhouse effect is feedback response and that, therefore, the system-gain factor is 4. The product of the system-gain factor and the ~1 K reference doubled-CO2 sensitivity is equilibrium doubled-CO2 (ECS).
Sure enough, current predictions of global warming in the CMIP6 models also envisage about 4 K ECS, consistent with climatologists’ error in apportionment of the total greenhouse effect, and inconsistent with the corrected apportionment, which thus serves as an independent yardstick against which to assess the current over-predictions of global warming.
“Nowhere do the IPCC models invoke, use, assume, or otherwise depend upon any feedback equations. Those equations are just greatly simplified approximations that allow us to discuss how the climate system responds to an imposed energy imbalance. If somebody has published a paper that incorrectly explains the climate system with a feedback equation, that does not invalidate the models. There might be many errors in models that cause them to be too sensitive, but how someone misrepresents the model behavior with their favorite feedback equation is that person’s problem… not the model’s problem.
Feedbacks in the IPCC models are diagnosed after the model is run; they are not specified before it is run. Now, it IS true that how some uncertain model processes such as cloud parameterizations are specified will affect the feedbacks, and therefore affect the climate sensitivity of the model. So, I suppose you can say that feedbacks are indirectly imposed upon the models. But there isn’t a feedback factor or feedback equation input into the model.”
Roy agrees with Nick.
And yet, the models cannot agree between themselves about what the value of ECS is.
The reason models to not agree is because, despite all the claims of “basic physics”, it all depends on a basket full of poorly constrained “parameters” which they have a large degree of freedom to tweak and this determines the overall sensitivity of the model.
Hansen at al 2005 clearly stated that you can get just about whatever sensitivity you want by changing model parameters.
And that is why, as Frank (2019) has demonstrated, models’ predictions are no better than guesswork.
I, too, agree that the models do not incorporate feedback formulism directly: instead, feedback response is an emergent property arising from the iterated solutions to the Navier-Stokes equations in computational fluid dynamics across one or two million atmospheric cells and hundreds of time-steps.
However, we do not concern ourselves with the internals of the models. There is no point: for, as Frank (2019) has demonstrated, their predictions of global warming are, statistically speaking, no better than guesswork.
Our approach is to use the corrected apportionment of the total greenhouse effect as an external, independent yardstick against which to judge the appropriateness of the models’ outputs.
“There is no point: for, as Frank (2019) has demonstrated.”
With your Kellyanne Conway alt.statistical invocation of Frank, you just lost superterranea.
Bigoilbob is perhaps unaware of the research that has gone into our result. We naturally studied my good friend Pat Frank’s result. Indeed, I was present at the invitation of the president of the World Federation of Scientists when Dr Frank presented his result at the annual meeting of the Federation on planetary emergencies in Erice, Sicily, in 2016.
Dr Frank was treated with monstrous discourtesy by the many climate fanatics at the meeting. I went up to him afterwards and told him not to worry: he was in no way at fault, but the climate Communists are vicious to anyone who threatens the Party line as directly as Dr Frank has done.
I encouraged him to continue his research. After nine successive attempts, he found a journal whose reviewers were more than usually competent. One of these was Dr Karl Wunsch, no skeptic but an honest scientist, who realized that Dr Frank is correct and had the integrity – as well as the courage – to say so.
I have also kept in touch with Dr Frank since 2019, and no peer-reviewed paper – as far as he knows – has refuted, or even attempted to refute, his conclusion.
There have been some strikingly ignorant attempts in blog postings (on both sides of the divide) to overthrow Dr Frank’s result: but it is sound, and it is rooted in long-established and well-tested statistical method.
If Bigoilbob has any scientific reason – any scientific reason at all – to question Dr Frank’s result, perhaps he would be good enough to share it with us. Mere yah-boo won’t do.
There are plenty or reasons to question Dr. Frank’s results. For starters Dr. Spencer published a refutation of it on his blog at:
https://www.drroyspencer.com/2019/09/critique-of-propagation-of-error-and-the-reliability-of-global-air-temperature-predictions/
Another person who doesn’t understand the difference between error and uncertainty, just like Izaak the Idiot.
And Pat Frank refutet point by point what Roy Spencer wrote
“And Pat Frank refutet point by point what Roy Spencer wrote.”
Actually, no. If you follow the progress of this paper, you can see that above ground, folks just quit pig fighting. The real metric – the one referred to by Andy May – citations, shows how well received this ground breaking paper was. It he has NO relevant cites…
Logical fallacy, bob. Closer to home, I’m sure Alfred Wegener didn’t have any positive citations for many years. Try refuting Dr. Frank’s premises instead.
“Logical fallacy, bob. Closer to home, I’m sure Alfred Wegener didn’t have any positive citations for many years.”
Might want to clue in Andy May, who recently appealed to the authority of a source by bragging about how many citations he had for peer reviewed papers. And w.r.t logical fallacies, are you REALLY trying to compare Pat Frank to Andrew Wegener, who (1) published under a whole different system, (2) used settled science as the basis for his views?
BTW, support for Wegener’s claims ultimately GREW over time. For AGW denial, just the opposite. Every frequent poster here makes periodic whines about how this or that organization doesn’t treat him nice any more. Their group of followers deceases over time, as it should.
bob,
I’ll let Andy May speak for himself. As for the Frank / Wegener comparison, I think it’s apt, but perhaps you can better explain 1) what you mean by, and / or the relevance of “published under a whole different system” and 2) what’s “unsettled” about error propagation in scientific measurements?
But there are more important points to consider: Wegener’s proposal of continental drift had absolutely no political or economic implications at the time, so opposition to his ideas was strictly a function of the bruised egos of those scientists steeped in the existing geological paradigms of the time. On the other hand, Frank’s proposal that GCMs make meaningless predictions is absolutely loaded with political implications in terms of big vs. limited government, not to mention billions, if not potentially trillions, of dollars of economic impact.
So while Alfred Wegener became a symbol of how one scientist who happened to be right could stand against the scientific establishment, I’d argue that Pat Frank and other skeptics, if they eventually prevail against a far more formidable political establishment, will have provided a far greater service to humanity.
“ It he has NO relevant cites…”
Oh no!
And in my opinion Dr. Spencer’s criticism is still valid. Dr. Frank is mistaken in thinking he has a valid point to make. For starters if you take Dr. Frank’s analysis to be valid the error depends linearly on the number of steps so if you take your time step to be 100 years your error is 100 times less than if your time step is 1 year which is nonsense. In addition Dr. Frank’s analysis claims that even in a steady state with constant forcing the errors in numerical models would diverge which doesn’t happen.
Try reading his work again – the errors scale with time, so short time steps / long time steps, you get to the same place.
Too bad you didn’t bother to learn anything about metrology or uncertainty.
There is no doubt that Roy Spencer was caught by surprise when he saw Pat’s paper. I had the advantage of having heard Pat describe his result before the World Federation of Scientists in Erice, Sicily, in 2016. Therefore, I had had the time to study the norms of propagation of uncertainty in quadrature by the time the paper was published in 2019.
“With your Kellyanne Conway alt.statistical invocation of Frank, you just lost superterranea.”
bob,
With your reference to Kellyanne Conway, you just lost your argument. Try sticking to science.
Problem is science doesn’t stick to bob
As does Monckton when he calls people he have the temerity to call his obdurate denial of his misrepresentations (just follow some links and compare his, err “interpretation” of the science with the original) ..
just an example from this thread ….
“Poor Mr Banton, steeped in Communism, resorts as ever to mere yah-boo, repeating the reputational assaults of the pipsqueak Bickmore and the sneering Hadfield, neither of whom is fit to lick my snakeskin cowboy boots.”
the man is unfit to advocate for anything with that attitude.
If you have issues with Monckton’s ideas or writing style, you should address him directly. My previous responses under this thread have addressed adhominem or erroneous statements directed at Pat Frank’s findings of significant error propagation in GCMs.
I, too, agree that the models do not incorporate feedback formulism directly:
Ah, but you do. In your Table 2. Now sue me.
Mr Phillips has not, perhaps, read the head posting with due care and attention. My table 2 is not taken from any models: it is compiled by us directly from the data and their uncertainties as described in the head posting. It shows that if one corrects climatology’s error the uncertainties have very little influence on ECS, which is 1.1-1.2 K, but that if one fails to correct climatology’s error the uncertainties have a significant influence on ECS, which is not only excessive but also ill-constrained, as Fig. 1 in the head posting shows.
Since just about every draft and version of our paper (there are three currently circulating) explicitly mentions that the models do not incorporate feedback formulism directly, it is self-evident that on this point Dr Spencer and we are at one.
One hundred percent of National Science Academies have issued statements saying that AGW is real and potentially dangerous.
For your edification here is His Lordship disproving the entirety of climate science by sitting on a park bench in am ill-advised baseball cap chatting with a German teenager.
“One hundred percent of National Science Academies have issued statements saying that AGW is real and potentially dangerous.”
And 10 out 9 dentists agree that global worming is Bad News…
… and they know the drill.
Mr Phillips imagines that because several scientific trades unions have issued statements favorable to their members’ interests those statements must be true. That is naive.
Argument from consensus is an unhappy conflation of two 2400-year-old Aristotelian fallacies – the fallacy of headcount and of appeal to the imagined authority of supposed experts.
The Royal Society is just one of the scientific trades unions that has issued “gimme-more-money” statements about climate change. Yet its rules expressly forbid it to take any position on any scientific question. Why should we rely upon a scientific trades union that breaks its own rules?
Furthermore, as the head posting makes plain, climatology has made an error in its definition of temperature feedback. It made that error by borrowing feedback formulism from control theory without understanding what it had borrowed (just read the confused postings from Nick Stokes, for instance).
The scientific trades unions may well have thought they were right about global warming, but, as the head posting indicates, they were actually wrong. Very wrong. Doesn’t matter how many of them chanted the same Party line. That is the nature of Party lines. But the Party line is simply flat-out wrong. Get over it.
“Doesn’t matter how many of them chanted the same Party line. That is the nature of Party lines. But the Party line is simply flat-out wrong.”
That sums it up nicely.
We’re dealing with human psychology here, not climate science when it comes to alarmists. Obviously, some in the highest offices of the land are not immune to the climate change propaganda and distortions.
The one thing they don’t have is evidence to back up their CAGW claims.
My baseball cap is a Stetson. I need it to shade my eyes. It hsa a longer peak than most such caps.
And the video in question merely points out that argument from an imagined consensus of supposed experts is a conflation of two ancient logical fallacies, from which the only conclusion that may legitimately be drawn is that those – such as Mr Phillips – who perpetrate those fallacies (of headcount and of appeal to authority) are insufficiently educated to understand the irrationality of their position.
Time to bring up the appeal to authority
“One hundred percent of National Science Academies have issued statements saying that AGW is real and potentially dangerous. ”
Do they say CAGW is real? Isn’t that what you mean by AGW? Isn’t that what they mean, too?
What if they’re wrong about CAGW? That’s a possibility you know. A very good possibility. In fact, I see no signs of CAGW at all. You?
“Lacis et al. (2010) explicitly state that 75%…”
The claim was that
” the current method of deriving ECS by apportionment of the total greenhouse effect”
Lacis et al were not deriving ECS. Who actually uses this “current method”? What ECS do they find?
Crickets.
Perhaps Mr Stokes would get his kindergarten mistress to read him Lacis’ paper, whereupon he would realize that ECS is one of the quantities considered in that paper.
Your quote again:
” the current method of deriving ECS by apportionment of the total greenhouse effect”
My question again – a simple one.
What value of ECS do they derive?
The answer is, of course, that they are not deriving ECS by this method. No-one does.
Let me explain again for Mr Stokes, for he is plainly concerned that the climate scam to which he has devoted so much time and other people’s money is about to be seen for exactly what it is.
If Mr Stokes would only read Lacis et al. (2010), a paper whose existence was drawn to my attention by an IPCC representative at a high-level Russian Academy of Sciences conference in Moscow under the aegis of the City Government a couple of years ago, he would find that Lacis et al. attribute 25% of the total greenhouse effect to direct warming by greenhouse gases and 75% to feedback response thereto. Therefore, they envisage a system-gain factor in excess of 3.
That is the typical current apportionment of the entire greenhouse effect.
However, feedback processes in the climate at any given moment respond not only to the noncondensing greenhouse gases in the air at that moment but also to emission temperature.
Therefore, one may use climatology’s long-established apportionment-of-the-greenhouse-effect method of estimating climate sensitivity as an independent, external yardstick to verify the models’ projections of equilibrium sensitivity.
However, one must do it right. One must realize that at any given moment, such as the present, such feedback processes as are subsisting in the climate system must perforce respond equally to each Kelvin of the reference signal then subsisting. Therefore, the feedback responses to the various components in the reference signal will be, at any given moment, strictly proportional to the magnitudes of the components to which they are responding.
The reason is that feedback processes, being inanimate, cannot distinguish between one Kelvin and another. To them, a Kelvin is a Kelvin is a Kelvin, regardless of its origin. Therefore, the feedback processes cannot decide, as climatology does, that they will not respond to the 255 K emission temperature but will only respond to the 8.5 K direct warming by noncondensing greenhouse gases.
It is not difficult, therefore, to calculate that the total feedback response to all anthropogenic influences on climate to date is of order 0.1 K.
Yet climatology, playing futilely with models that are proven incapable of making predictions in any material sense distinguishable from guesswork, proposes that ECS today is 3.9 K (Zelinka 2020), of which 2.85 K is feedback response.
That midrange projection is egregiously at odds with any result that one might reasonably expect given the corrected apportionment of the total greenhouse effect to date.
I have already published an essay here that provides a couple of dozen references to papers where feedback is erroneously defined or discussed as responding solely to changes or perturbations rather than to the entire reference signal, which is the sum of the base signal and all perturbation signals.
Your quote again:
” the current method of deriving ECS by apportionment of the total greenhouse effect”
My question again – a simple one.
What value of ECS do Lacis et al derive?
You give a fog of words to cover that Lacis was not deriving ECS by that method, and you can’t name anyone who does. There are none.
Asked and answered supra.
Mr Stokes may care to read the following extract from Lacis:
“Noncondensing greenhouse gases, which account for 25% of the total terrestrial greenhouse effect, … provide the stable temperature structure that sustains the current levels of atmospheric water vapor and clouds via feedback processes that account for the remaining 75% of the greenhouse effect.”
Looks to me as though they are saying that the 25% of the entire greenhouse effect that is direct greenhouse-gas warming is what drives the remaining 75% by way of feedback response.
That is why they find what they call a “feedback factor” (more properly a system-gain factor, the ratio of equilibrium to reference sensitivity) of well above 3, which, as they state, on the assumption of 1.2-1.3 K reference sensitivity to doubled CO2 (RCS), would imply ECS of about 4 K.
These days, the midrange RCS is 1.06 K (derivable from the 3.52 K doubled-CO2 forcing given in Zelinka (2020, supplementary matter).
“ which, as they state, on the assumption of 1.2-1.3 K reference sensitivity to doubled CO2 (RCS), would imply ECS of about 4 K.”
Lacis et al did mention a climate response of 4°C pre climate doubling. But it wasn’t their calculation. It was from Hansen’s 1984 paper, which used a 3D GCM experiment to get sensitivity in the usual way. They worked back from that to get the feedback factor. In fact, that is all done in the 1984 Hansen paper.
Lacis et al. say the 25% of the entire greenhouse effect that is direct warming by greenhouse gases drives the feedback response that constitutes 75% of the greenhouse effect. The implication is that the system-gain factor is 4, implying ECS of about 4 K.
In complex dissipative systems feedbacks do not lead to equilibrium. Instead they lead to oscillation.
The question “what is ECS” is ill -posed.
The mathematics of control theory is well understood and proven, but not yet understood in climatology. Briefly, because the sum of the infinite convergent geometric series of powers of the feedback fraction or closed-loop gain factor has a closed-form solution under the convergence criterion that the feedback fraction be below unity, the climate system would not be rendered unstable by the presence of feedback unless the feedback fraction were close enough to unity.
Oscillation would only occur in a system in which the feedback fraction was so large that the output was driven towards, but could not reach, infinity. That situation is not applicable in the climate, though the absurdly overstated upper-bound values of ECS posited by the climate models might well cause some instability if they were in any way realistic. But they aren’t.
That is not climatologists do either.
They define the pre-industrial supposed “equilibrium” determined by negative (radiative) and positive (GHG) feedbacks as the neutral point. So they are NOT attributing all 25K to anything. Nowhere.
Additional GHGs produce an additional forcing and that leads to a certain warming. Poorly constrained model parameters are chosen freely tweaked and assumptions are made ( constant rel humidity ) which lead to net positive increase in balance between +ve and -ve feedbacks compared to the pre-industrial case.
It is that additional feedback which roughly doubles the “basic physics” CO2 warming.
That additional f/b will apply to the whole surface temp as CofB points out. That does not mean it’s wrong or that it not adding an equal amount. The whole thing is a misunderstanding on his part.
Whether the parameters are fortuitously correct is another question, however, there is nothing wrong with way it is done.
CoB is simply misapplying his feedback analogy.
There is a “tweaked” additional climate feedback in the models ( clouds, WV, etc ) and this reacts to the entire spectrum of emitted IR due to the absolute temperature of the surface ( not just the CO2 differnce ).
If this additional forcing happens to be about equal to the “basic physics” CO2 forcing that does not mean it is calculated as a proportion of that forcing, which seems to be what CoB is claiming.
Other estimations of ECS ( such as Lewis and Curry ) indicate that the model parameters are wrong, they do not support CoB’s feedback analogy.
Thanks to Nick Stokes for his attempts to bring some reasonable discussion, despite the constant, ignorant and gratuitous insults from our resident pommie aristocrat.
One wondered when Greg would emerge from the slime. He has, as usual, failed to understand the argument in the head posting, clearly-expressed though it be.
At any given moment, such as the present, there subsists in any dynamical system moderated by feedback a reference signal and a feedback response thereto.
The reference signal comprises, at minimum, a base signal. That base signal, in climate, is emission temperature, for – like it or not – the Sun is shining (except in Scotland).
There may also be perturbations contributing to the reference signal. In climate, these perturbations are the directly-forced warmings by, or reference sensitivities to, greenhouse gases.
At any given moment, such as the present, any feedback processes subsisting in the dynamical system at that moment will necessarily respond equally to each unit of the reference signal, and, therefore, proportionately to each component therein.
Therefore, since the 255 K emission temperature comprises 29/30 of today’s entire reference signal, it contributes 29/30 of today’s feedback response.
Therefore, ECS is little more than 1.1 K.
However, climatology universally defines temperature feedback as responding solely to perturbations of the base signal, and not also to the base signal itself.
Furthermore, its exaggerated predictions of global warming are consistent with its misdefinition of temperature feedback.
Well without all the pontificating pseudo-intellectual waffle you could probably have said that is two sentences. You ten pages, filled with inconsistences, to explain a simple error of calculation “clearly expressed”?
Of course not but the 29/30 of the 263.5 K is what gave us the pre-industrial “equilibrium”. ALL that happens after that is (allegedly) AGW, assuming there is no natural variability resulting in a random walk variation, plus a ton of equally dubious assumptions.
The “basic physics” CO2 warming is amplified by the other residual positive feedbacks above and beyond the 29/30 of the 263.5 K. So ALL of that is AGW.
Yes, that additional f/b ( WV, cloud etc ) is acting on radiation from the full 263.5 K but it is part of climate reaction the AGW signal and so attributable to it.
You attempt to re-attribute 29/30 of amplified part of the AGW change back pre-industrial climate is fallacious.
You goofed again !! Just like you did with the COVID fiasco.
Joe Born and Nick Stokes are both far more technically competent than you and are impeccably polite yet you wade in with gratuitous insults every time.
You insult everyone who disagrees with you, so have to expect the same in return.
Now climb back into your cess-pit and stop wasting our time, we have enough work arguing liars like Mann and the industrial perversion of science, without being distracted by your incompetent waffle.
Greg whines about what he rightly calls the COVID fiasco. I had run a series of articles with the purpose of ensuring that the arguments in favor of restrictions upon interpersonal close contact until successful vaccines were available were put. I had correctly predicted – in a post that was not published – that millions of deaths would arise. Millions of deaths have arisen. There was a lot of disagreement with me, by people not familiar with epidemiological modeling or the characteristics of the susceptible-infected-removed model in particular, but in government circles it was my viewpoint that prevailed. As a result, the still larger numbers of deaths that would have occurred without restrictions on movement have been averted. Now it will be necessary for Western nations, whose vaccines actually work, to vaccinate the rest of the world.
Greg’s account of climatology’s official position on feedbacks is even more garbled than those that appear in learned paper after learned paper by climatologists unfamiliar with control theory.
We know the position as it stands today: 255 K emission temperature and 24.2 K feedback response thereto; 7.6 K direct warming by preindustrial noncondensing greenhouse gases and 0.7 K feedback response thereto; 0.9 K direct warming by anthropogenic greenhouse gases and 0.1 K feedback response thereto.
The total anthropogenic contribution to today’s temperature is thus of order 1 K, or little more than 1/300 of total current temperature.
Greg is entitled to his view that Messrs. Born and Stokes are more competent than me. Yet Mr Born has not, as far as I know, contributed a single paper to any learned journal in climatology or in control theory, the two disciplines most applicable here; and as for Mr Stokes, our kind host suspect that he is paid to disrupt these threads, and it is not clear to me that in his comments here he has in all matters been straightforward.
Furthermore, Greg and other climate Communists witter on and on about my imagined lack of competence, knowing perfectly well that I am merely one of a team that contains professors of both climatology and control theory as well as doctors of engineering and of physics.
Mr Stokes is wrong as usual. Lacis et al. (2010) explicitly state that 75% of the entire greenhouse effect is feedback response and that, therefore, the system-gain factor is more than 3. The product of the system-gain factor and the ~1 K reference doubled-CO2 sensitivity is equilibrium doubled-CO2 (ECS).
Sure enough, current predictions of global warming in the CMIP6 models also envisage about 4 K ECS, consistent with climatologists’ error in apportionment of the total greenhouse effect, and inconsistent with the corrected apportionment, which thus serves as an independent yardstick against which to assess the current over-predictions of global warming.
Lord Monckton,
What exactly is this “feedback response” you speak of?
You also don’t mention H2O as a green house gas. Why not?
Is the “feedback response” due to water vapour?
Please enlighten. Thanks.
Feedback response is – er – the response to feedback. It is denominated in Kelvin, and it is dependent upon, and proportional to, the direct temperature or warming to which it is a response.
Take the position today. The 288.5 K present-day temperature comprises 255 K emission temperature, 8.5 K direct warming by noncondensing greenhouse gases and 25 K feedback response. The feedback response is, therefore, a response to the 255 + 8.5 K, or 263.5 K, reference signal or direct temperature.
Clahmatawlagy makes the mistake of imagining that the 25 K feedback response is response only to the 8.5 K direct warming. That’s a big mistake.
“Clahmatawlagy”
Surely you don’t wish to imply that the warmunist moonbats speak with a Texas twang? Or is that East Anglia, TX?
Think Bubba J.
Again, what about this one
“Climatologists, by not realizing that emission temperature is by far the largest contributor to feedback response, mistakenly added the 24.2 K emission-temperature feedback response…”
Who “mistakenly added”? Names? Citations?
This is fantasyland stuff. To call it a strawman would be to exaggerate its substance.
Poor Mr Stokes! He knows perfectly well that we are right but cannot bring himself to admit it.
Let him read, for instance, Lacis et al. 2010 and weep. There he will see the authors saying that 25% of the entire greenhouse effect drives the other 75% that is feedback response.
If he likes, I can give him several dozen papers in which feedback is misdefined as responding only to changes or perturbations, and not also to the 30-times-larger emission temperature.
He may care to look, for instance, at IPCC (2013, p. 1450), where “climate feedback” is thus misdefined. The word perturb or perturbation occurs five times in that misdefinition, which an eminent climatologist described to me, rightly, as “nonsense”. There is no mention whatsoever of the feedback response to emission temperature.
If Mr Stokes can find any papers in which feedback response is correctly defined as responding to the base signal as well as to any perturbation thereof, and in which the feedback response to emission temperature is explicitly quantified, perhaps he would be kind enough to draw them to my attention. It may be that there are some such.
However, I beg leave to doubt it: for the current 4 K midrange ECS projection in the CMIP6 models (Zelinka 2020) is consistent with the error and inconsistent with the corrected definition of feedback.
Moncton has got away with his “misrepresentation” of the science for to long Nick, though he is now only limited to this Blog, where Denizens (mostly) lap up it up uncritically. Those that do bother, such as yourself get the “… is as usual wrong” (his polite version) without any comeback on the critique. Or else the usual Moncktonesque blizzard of verbiage, that leaves you non the wiser but allows the Denizens to worship their very own chief snake-oil salesman.
He of course knows that the likes of yourself can go only so far in engaging his obfuscation. And generally gets the last word …. Which of course in these here parts amounts to a win for him.
Because, of course, shooting down criticism by numbers is a “win”.
Yet he (and others) have the … to call this a place peer-review!
Well yes, I suppose, if the peer-review you’re after is for hugs and kisses.
And what is actually the current cause of GW in the World of Monckton at the moment ?
Do I understand it’s undersea volcanoes?
Well of course, because it’s ABCD isn’t it ?
BTW: There’s some questions down below for you to address me Lordship.
I see you haven’t.
What a surprise.
Mr Banton appears to be very frightened indeed at the good news that global warming will not, after all, be a global crisis.
I have no idea what contributions each of the various possible causes of global warming make. And nor does anyone else. See Legates et al. (2015), where it was shown that only 0.3% of 11,944 papers on climate and related topics were willing to state that global warming in recent decades was chiefly anthropogenic.
I have no idea whether some of the 3.5 million subsea volcanoes many of which are along the mid-ocean divergence ridges are a significant cause of warming. There is a correlation between warming in recent decades and seismic activity along the mid-ocean divergence zones (Viterito 2018), but it is well above my pay-grade to know whether the correlation is causative.
What I do know is that at any given moment, such as the present, feedback processes necessarily respond not only to the perturbation signal but also to the base signal – emission temperature. Therefore, feedback response to direct warming by greenhouse gases is a lot less than climatology imagines. Therefore, global warming – all other things being equal – will be, as it has been in the past three decades, about a third to a quarter of current midrange projections, ending the “climate emergency”.
Celebrate the good news! Or find specific, credible ways to refute it. And don’t be foolish enough to imagine that this is my only outlet. It is a remarkably useful one, but it is by no means the only one.
Dear oh dear.
Address my quests Monckton.
It’s quite, quite pathetic that you are snake-oil selling undersea volcanoes now.
How many “non ABCDs” have you gone through before arriving at that?
The heat capacity of the oceans is ginornmous.
So whilst you deny that the heat sequestered in the oceans (93% of TSI) is of any consequence … or others on here say deeper waters are not heating … or squirrels.
You are saying that this massive upwelling of heat to the ocean surface is responsible for GW ?
How have we missed these hot-spots in SST?
Where are these foaming ocean surfaces and indeed there would be a signal through the vertical from the sea-bed, as deep water heat is buried from being passed on to the atmosphere.
Warm water rises (given similar salinity).
The oceans take a thousand years to circulate. More snake-oil and the converted lap it up.
Or do they now?
Are some finally seeing that the Emperor is naked ??
Mr Banton might perhaps like to get his Komsomol kindergarten mistress to read him the following passage from my immediately previous answer to him:
“I have no idea whether some of the 3.5 million subsea volcanoes many of which are along the mid-ocean divergence ridges are a significant cause of warming. There is a correlation between warming in recent decades and seismic activity along the mid-ocean divergence zones (Viterito 2018), but it is well above my pay-grade to know whether the correlation is causative.”
When I say I have no idea I mean I have no idea. I have provided scientific evidence, which is more than Mr Banton has done, but I have reached no conclusion thereupon.
I am, however, investigating further, and am studying a possible link between mid-ocean divergence-zone seismic activity and the celestial mechanics of the Moon, the orbital characteristics of the gas giants and the consequent motion of the Sun about the gravitational barycenter of the solar system.
This is called “research” – an activity with which Mr Banton seems to have very little familiarity. Research usually yields negative results, but sometimes yields positive results. One cannot be sure which until the research is concluded.
That’s the scientific method. It is of course entirely antithetical to Mr Banton’s approach, which is to recite the Party Line and then to whine if anyone casts any doubt upon it.
Well, as the head posting plainly reveals to all who have eyes to see and ears to hear (i.e., to all who, unlike Mr Banton, have open minds), the Party Line on the climate question was flat-out wrong. Soon the world will come to realize that, and no amount of bluster or diversion from Mr Banton will alter that fact.
“Mr Banton might perhaps like to get his Komsomol kindergarten mistress”
And there Monckton just shows that you belong in the kindergarten.
what a pos
Don’t whine.
There has been quite a lot of this by your fan club.
<Monte Carlo is right. Methinks the climate Communists do protest too much.
No Nick, he would have to defend it then.
This is just for the faithful
.
Remember we, or at lest I am ….
“…. steeped in Communism, resorts as ever to mere yah-boo, repeating the reputational assaults of the pipsqueak Bickmore and the sneering Hadfield, neither of whom is fit to lick my snakeskin cowboy boots.”
You couldn’t make it up.
And he’s a “Lord “as well !
And that ladies and gents if the lens through which our major in Classics and Journalism conducts his climate “science”.
Well ya “pays yer money and takes yer choice folks.
How’s about addressing Hadfields’s uncovering your lies (patently obvious when comparing with the original sources) ?
As I have some here (and Nick Stokes elsewhere) wrt Wu, Hu Et al.
Throwing yer dummy out of the Pram (stroller), calling people names and inferring their motivation directly because it’s the opposite of yours.
Is no way to conduct scientific discourse, well anything in life actually.
But you are our better aren’t you m’lord.
Nasty ad hom is OK from you.
whereas poor Mr Frank was treated frightfully.
FFS
What a hypocrite
Mr Banton continues to be snide, incoherent and incapable of making any sound scientific point. There is really no point in his continuing to resort to the Communist device of organized reputational assault, to which all of us who dare to question the Party Line are routinely subjected. It won’t work any more.
Mr Banton must put down the Works of Lenin and try to find a proper scientific argument against our result. Of course our result is uncongenial to climate Communists such as he is, but his tired recycling of ad-hom attacks on me by his fellow climate Communists does not impress, and leaves no footprint in the scientific discussion.
Grade F. Detention. Confiscation of Communist textbooks. Must try harder.
“Mr Banton continues to be snide, incoherent and incapable of making any sound scientific point. “
And there, good readers, we have another aspect of the Monckton “Schtick”.
Avoiding all requests to address the scientific question that I originally put up for him to address via the use of countless smears and ad Homs ….. and then returning for the last word (because of course the last word means a “win”) ….
with the devastating repost of (Insert name of unfortunate individual) continues to be snide, incoherent and incapable of making any sound scientific point.
Like I’ve said – you couldn’t make it up
what a nice aristocratic major in journalism and the classics you are m’lord.
Don’t whine. If there is a scientific point, man up and make it.
Typical lie by Nick. Claim there’s an error but not correct it, because he’s incapable of making a focused response on topic.
It’s a question. And no answer is offerred. Who uses this “current method”? Who actuyally “mistakenly added the 24.2 K emission-temperature feedback response”. Names?
There is no correction, because no actual facts are offerred.
Mr Stokes is being disingenuous, as usual. The current CMIP6 midrange global warming projection is about 3.9 K (Zelinka 2020). Of this, 2.85 K is feedback response to 1.05 K reference doubled-CO2 sensitivity. The implicit midrange system-gain factor is 3.7.
However, up to the end of 2020 the entire anthropogenic feedback response was less than 0.1 K.
In an earlier posting, I provided some two dozen references to papers in which feedback was incorrectly described as responding only to changes or perturbations, and not at all to emission temperature, which is 30 times larger than all the changes added together. That error implies a system-gain factor 33.5 / 8.5, or 4.
One can see, therefore, that the CMIP6 midrange ECS is consistent with the endlessly-repeated erroneous definition of feedback, and inconsistent with the corrected definition.
Nick,
You and others appear to be saying something along the lines of,
“If there were no non-compressing GHGs (CO2 and other minor GHGs) in the atmosphere then there would also be little or no water vapor in the atmosphere.”
I find this notion utterly ridiculous. I’m sure this can’t be your position.
Could you explain to me in a civil way, why this is not what you believe and answer the following question.
If there were no non-compressing GHGs in our atmosphere, what atmospheric temperature would you ascribe to water vapor in this atmosphere?
If you answer this question with about 25K then you are agreeing with Lord Monckton. If you say significantly less, which is what you appear to be saying, then you are lowering the so-called WV feedback to CO2.
We all understand that these things are not linear. Lord Monckton’s analysis gives a broad over view that is useful, in my opinion.
I look forward to your reply.
Sorry,
” If you say significantly…..feedback to CO2.”
Should have read,
“If you say significantly less, then you need to explain why and give your range of estimates”.
Bad day.
There’s not a lot of water vapour in the atmosphere at -18 degrees Celsius 🙂
I am most grateful to Mr Irvine for his support. Simon, however, responds that “there’s not a lot of water vapour in the atmosphere at -18 degrees Celsius” [which is 255 Kelvin, the emission temperature].
Actually, there would be water vapour in the atmosphere, for the entire Tropics would be ice-free. See e.g. Lacis et al. 2010.
However, our argument, as outlined in the head posting, does not depend in any way in what conditions might have prevailed at emission temperature. All we need to know is that emission temperature is by far the largest component in today’s reference temperature, and that, therefore, the feedback response to emission temperature is today by far the largest component in total feedback response, and that, therefore, the feedback response attributable to anthropogenic forcings to date is a minuscule 0.1 K, and that, therefore, there is very little reason to suppose that the feedback response to the direct warming by doubled CO2 would greatly exceed 0.1 K, and that, therefore, the equilibrium sensitivity in response to the 1 K direct warming by doubled CO2 will be about 1.1-1.2 K.
What do you mean by “emission temperature”? Is that the temperature at the time of an individual emission? The net feedback response is much greater that 0.1 K. Lacis is attributing forcing, not absolute temperatures.
Emission temperature is a well-understood term in climatology. It is the temperature that would prevail near the surface in the absence of any greenhouse gases in the atmosphere at the outset. In dozens of papers its value is given as 255 K.
Importantly, emission temperature constitutes by far the greater part of today’s surface temperature. Therefore, the feedback processes in the climate today must perforce respond not only to the 7.6 K direct warming by preindustrial noncondensing greenhouse gases and to the 0.9 K direct warming by anthropogenic noncondensing greenhouse gases but also to the 255 K emission temperature.
The total feedback response in today’s climate is 25 K, of which 24.2 K is attributable to emission temperature, 0.7 K is attributable to direct warming by preindustrial greenhouse gases and, exactly as stated in my earlier comment, 0.1 K is attributable to direct warming by anthropogenic greenhouse gases.
Build a test apparatus and see for yourself. Or see any textbook of control theory. In a feedback amplifier, not only the perturbation (represented by the gain block) but also the input signal arrives at, and is, therefore, modified by, the feedback block.
We got a national laboratory to test these things for us, and it confirmed our understanding, to the nearest tenth of a Kelvin equivalent, in each of 23 distinct tests arranged in four groups each intended to examine a proposition in control theory that any control theorist would at once recognize as true but very, very few climatologists understand.
My point here is that no-one uses what Lord M claims is ” the current method of deriving ECS by apportionment of the total greenhouse effect”. I have asked him to name just one usage (with the value of ECS obtained). He cannot. It matters because his post is based on a claimed correction to a method no-one uses, for the good reason that it cannot tell you ECS. Neither can his revision.
As to the removal of non-condensing GHGs, that is a long standing teaching example to illustrate the extent of the GHE. It is usually presented assuming that albedo stays constant, and wv vanishes too in the cold. It is a thought experiment so depends on whether you find that plausible. The paper by Lacis that Lord M has latched onto does the exercise of actually removing those non-condensing GHGs in a GCM. Somewhat surprisingly, it finds that the result is increased clouds, and hence albedo. The air is dryer, but colder, and with the added albedo the temperature drops below 255K.
None of this has any reality. It is a thought experiment. It makes no sense to assert that a temperature which never happened is somehow being fed back into the current climate, as Lord M does.
Nick
Thanks for the reply.
GCMs overwhelmingly find positive cloud feedback. That position along with strong water vapor feedback is, of course, what we are disputing here.
It is, therefore, not relevant to this debate to remove non-condensing GHGs in a GCM and use consequent cooling from increased cloudiness as an argument.
If we removed all non-condensing GHGs from the 1850 atmosphere, Lord Monckton would expect global average temperature to be close to 7C. (15 -8C).
The air would be dryer, as you say, but tropical water vapor content would not alter significantly. Tropical temperatures are kept remarkably stable by convection etc. and have been for millions of years.
This trop[ical water vapor content would be significant, and cannot be attributed as a feedback to non-condensing GHGs.
One of the early IPCC reports attributed 5C to this original WV with 8C to CO2 etc. and 20C to feedbacks to CO2 etc. (total 33C). This is from memory but I can find it if I have to.
I find this utterly implausable.
Do you have a more recent estimate than this 5C?
Mr Stokes is using wilful misdirection. Would there, or would there not, be a temperature that would prevail at the surface in the absence of any greenhouse gases? Yes, there would. Would that be a theoretical or a real temperature? It would be a real temperature, of somewhere between about 240 and 270 K.
Does that real temperature form part of today’s temperature? Yes, it does. Are feedbacks animate or inanimate? They are inanimate. Then by what mechanism can they choose to respond only to one-thirtieth of today’s total reference temperature, and not to the 29/30ths that is the 255 K emission temperature? Mr Stokes has in the past said that in an electronic circuit one can insert a differencer to allow feedbacks to amplify only the perturbation signal and not the base signal. Is there any such differencer in the climate? No.
Therefore, the feedbacks must respond not merely to the perturbation signal but also to the base signal. And, since 1 K of the base signal is the same to them as 1 K of the perturbation signal, the feedbacks today will respond equally to each 1 K, wherefore the magnitudes of the individual feedback responses to each of the components in today’s reference temperature will be proportional to the magnitudes of those components: 24.2 K feedback response to 255 K; 0.7 K to 7.6 K; 0.1 K to 0.9 K.
Getting back to the analog electronics analog: a difference amplifier subtracts two separate voltages, it does not split a single voltage into two.
Consider two DC voltages added together to form a single voltage, and then trying to amplify one and not the other—there is no way to sort out the two without more information.
Another example is a sinusoid with a DC bias—detection of the sinusoid requires frequency selection, a difference amplifier cannot do this unless the exact value of the DC component is presented to the negative input.
The point is that removing an unwanted signal requires knowledge of the signal, it just can’t be done blindly.
If this statement is valid, then judging by IPCC #6 numbers, the current method has to involve darts, a dartboard, and a pub.
Knowing that clouds are not treated properly, any treatment of feedback is done with nothing more than a guess and by golly! You have no proof of proper feedback treatment in any models!
so, the choice is to utilize the model(s) that, to date, most accurately reflects reality. And then pay attention to how things go from there.
or, continue to utilize the model(s) that don’t reflect reality, but pay.
Christopher’s “peer review” is a bit different to the usual definition.
Yes, especially with the involvement of the police. Gilbert and Sullivan would have had fun with it.
Mr Stokes’ own role may yet be investigated. Our kind host here suspects, as do I, that he is paid to intervene vexatiously here. If he is thus paid, since he has failed to declare his interest and has a long record of vexatious and usually inaccurate interventions intended to divert attention away from the weaknesses in the Party Line, then it may be that he is perpetrating and perpetuating for profit the deliberate deception underlying the current panic about global warming. Let us hope not.
You can’t determine ECS from a back of the envelope calculation, especially if it is accompanied with much misinterpretation and hand waving. This is because the feedbacks are nonlinear. The best approach is a properly parameterised GCM, which seems to indicate an average ECS somewhere around 3 degrees Celsius.
Alternatively, we could wait until we reach a new equilibrium, but that is not going to happen if we keep perturbing the system with additional greenhouse gases.
That is what the likes of m’lord want. Keep on pushing the doubt.
Because of course they require 100% probability.
Which will never be reached and well before then it will be to late.
Mind you there is no doubt at all that the LIA existed and that we dont know what caused it……. so of course we don’t know wat’s causing current warming.
Yes we do, as far is ever going to be scientifically possible.
Uncertainty.
Squirrels did it.
ABCD.
Then we periodically get the Great climate snake-oil salesman here.
To sell another recipe – ABCD of course.
And the disciples here lap it up Or do they?
Actually I think it’s just cowardice now.
None of them dare quiz him.
The hugs and kisses are “most gratefully received” and the great ego preens himself.
I makes my blood boil.
I have read lots of “threads” here and elsewhere where he is nastily obdurate in NEVER explaining or admitting fault.
Often ending, as he did with me if you aren’t put off, with “makes no scientific point”.
FFS
He bald-facedly lies about Wu, Hu et Al’s conclusions against the face of a self explanatory graph and then turns the original sin of the lie of 70% to “little more than 50%”.
And so he sails serenely on.
Only me and N.S dare call out that the Emperor is naked.
N.S has of course to quit the race early as he knows where the moderating penny falls and he is a long term player here.
But, fear not – persist and then we get the crack in the carapace.
His nastiness incudes the word “socialist” or “communist”.
Bloody hell the recipient of such is condemned to Hell and damnation.
Less than Human, worthless and any of his/her utterances obviously wrong.
Go to far and out comes the threats of litigation (none of which to my knowledge have ever been followed through with).
As I said to SUNMOD (if the post wasn’t snipped).
Eventually this place may realise that m’lord is a liability here
Apologies to
Simon, bgdwx, TheFinalNail and the odd other brave chap for trying to pin down the oh, so slippery *advisor* to Mrs Thatcher – (preen preen).
+ Joe Born
wrong place
Don’t whine.
Grow some integrity.
I know it’s not going to happen but it’s the least ad hom I can muster
Mr Banton makes no discernible scientific point. Instead, as he usually does, he merely continues the well-funded campaign of climate-Communist reputational assault on anyone whom the Kommissars deem dangerous to the Party Line.
I of course did, and m’lord still has the needle stuck in his habitual groove.
Just to so do again (Sorry SUNMOD)
Should you not require m’lord to desist … of are we think of potential, err threats?
My original post (Again … which has of course a “discernable scientific point”.
Made forgotten by serial obfuscation ( as his MO) – SUCH that he can come back and utter that patent Bollocks…
May I refer you to my original contribution m’lord.
Monckton:

Fig 4 from Wu,Hu et al ….
“Mr Stokes is, as usual, wrong.”
No he isn’t.
You again double down on your snake-oil selling.
Fig 4 above that Nick Stokes posted up (and you didn’t in this article or the one in June – I wonder why?) and which verifies clearly what Nick is stating on behalf of Wu, Hu et al.
The dotted curves at the botton, partitioning CO2, PDV and AMV – the “changes” (AKA variations) result over the period to a mean Zero sum.
See the RH scale of INDIVIDUAL CONTRIBUTION Deg C to the overall warming.
What does it show on the extreme right?
Do you see they are at ~ 0.0.
Where is the CO2 contribution at extreme right?: ~0.75C
And what does that mean?
That the variations in contributions through the whole time period are ENTIRELY made up of those of CO2.
If the period had ended in 1940 then non-CO2 drivers would have contributed ~0.65C.
But it doesn’t.
So what Wu. Hu et al and Nick Stokes is saying is that the CHANGES through the period can be partitioned into 30% to AMV/PDV and 70% to CO2
But WARMING at the end of the period is 100% due to CO2.
Cyclic PDV/AMV variations have zero sum.
From Wu, Hu et al …..
https://www.nature.com/articles/s41612-019-0075-7
“both AMV and PDV play a significant role in modulating global mean and regional SAT changes in the past a century-and-a-half.”
(What does “modulating” mean?)
“Overall, the AMV contributes significantly to the global mean SAT TRANSIENT CHANGES on multidecadal timescale, however, the contributions of PDV and AMV to global mean SAT have similar magnitudes on decadal timescales with the PDV leading AMV in most parts of the 20th century. Moreover, when PDV and AMV are in-phase, the contribution of NATURAL CLIMATE VARIABILITY to global and regional climate can be significantly larger than that from GHGs, but an out-of-phase change of PDV and AMV could minimize their contribution to global and regional climate. As the GHGs increase further, our study shows a declined influence of the PDV and AMV to global and regional climate relative to that of GHGs.
(my caps)
(What does “transient changes” mean?)
(What does “natural climate variability mean”?).
Now a repeat of your snake-oil selling spiel is not sufficient – except to the non-sceptical “sceptics” here eager to purchase a bottle.
Answer my questions please.
Failing that just post some ad hom of me that seems to suffice for you when you can’t wriggle any further.
AND I MEAN THE QUESTIONS ARE OF WU, HU ET ALL 2019
not any other fatansy paper by “distinguished colleages.
Thanks for that well constructed detail.
I suspect the BBC won’t be reporting this.
Please send a copy to the Guardian, and ask them to officially comment. They are the world wide coordinator of Climate Alarmism so I am sure they would like to respond…..
Mr Evans is right: the unspeakable BBC and the Grauniad won’t report anything that in any way casts any doubt upon any part of the climate-Communist Party Line. Our result, now inching its way through peer review (it has been with the editor of a leading climate journal for more than seven months) shows very clearly that there will be little more than a quarter of the currently-predicted global warming. That ends the “climate emergency’.
Communist China and its shills who infest these threads in the hope of keeping the scam going, already controls some 70% of all the rare-earth minerals that are essential to batteries for electric cars and backup to windmills and sunscreens. It is buying placeholder and sockpuppet stakes in the remaining 30%, with the aim of cornering the market, thereby crippling the West, whose governments continue to drool and drivel about the chimera of “net-zero emissions”.
Of course our result is profoundly uncongenial to the butchers of Tienanmen Square, Tibet, Sinkiang and Hong Kong, but it is becoming more widely discussed now. No one has successfully landed a blow on it, for it is self-evidently sound. Either the Sun can evaporate water or it can’t. We say it can. Climatology acts as though it can’t, and as though all of the 25 K feedback response in the climate system is attributable to the 8.5 K direct warming by natural and anthropogenic greenhouse gases.
I prefer “East Turkestan”.
And so do I. However, the Han Chinese are the most racialistic identity group on Earth (just look at the forced-interbreeding program in unlawfully-occupied Tibet, for instance), and have been so since the First Empire. The mixture of Han racialism, Communist ideology and the economic Fascism of Xi Jinping is a clear and present danger to humanity.
For those who’d prefer not to wade through that whole post, Lord Monckton has encapsulated his theory in a single slide at https://wattsupwiththat.com/2018/08/15/climatologys-startling-error-of-physics-answers-to-comments/. Indeed, he refers to it as “the end of the global warming scam in a single slide.”
For those who’d prefer a more up-to-date account of our research, read the head posting. It comes to the same conclusion as my talk some years ago, but provides rather more detail.
Lord Monckton is right that the head post comes to the same conclusion as his “single slide” post–and more than ten other posts of his this site has run on the same subject. More important, all those posts are based on the same theory, which as I explained in the post at https://wattsupwiththat.com/2021/05/11/an-electronic-analog-to-climate-feedback/ boils down to bad extrapolation.
Unable to refute my demonstration that he’s merely extrapolating badly, Lord Monckton employs name-calling, contending that I somehow lied. Tellingly, though, he fails to specify just what that lie might have been.
There are good reasons to believe that climate sensitivity is low. Lord Monckton’s bad extrapolation is not among them.
If the Born Liar, who richly deserves his soubriquet, instead if reciting his usual tired mantras, were actually to read the head posting, he would see that there has been no “extrapolation” at all. The 33.5 K total greenhouse effect comprises about 7.6 K direct natural greenhouse-gas warming, 0.9 K direct anthropogenic ditto, and 25 K feedback response.
Since feedback response at any given moment is strictly proportional to the components in the temperature that triggered it, the feedback responses to the 255 K emission temperature and to the 7.6 K and 0.9 K direct warmings are 24.2 K, 0.7 K and 0.1 K respectively. The unit feedback response is 25 / (255 + 7.6 + 0.7), or less than 0.1; the system-gain factor is thus less than 1.1; and, on that basis, equilibrium sensitivity to the 1 K direct warming by doubled CO2 would be little more than 1.1-1.2 K.
By an entirely distinct method, the energy-budget method (Gregory 2004; Lewis & Curry 2014), using recent, midrange, mainstream climatological data for the industrial-era from 1850-2020, ECS is again about 1.1 K.
Therefore, whether one uses the “average slope” or the “local slope”, as Mr Born calls them, ECS is about the same. That is what, if one were not poisonously and pettily prejudiced, one might expect of a system in which one source of temperature – the Sun – so strongly predominates.
As the head posting will explain when Mr Born gets around to reading it rather than moaning about its length, since the entire industrial-era anthropogenic feedback response is 0.1 K, one would not imagine a doiubled-CO2 feedback response over the next hundred years to be all that much greater than another 0.1-0.2 K.
The fact is that climatology, in failing to take account of the fact that the Sun is capable of evaporating water, and that it can do so without the assistance of noncondensing greenhouse gases, has fooled itself into imagining that ECS is three or four times what is realistic.
At https://wattsupwiththat.com/2021/05/11/an-electronic-analog-to-climate-feedback/ I demonstrated Lord Monkton’s error, which I had analyzed in more depth in the post I summarized at https://wattsupwiththat.com/2019/07/16/remystifying-feedback/#comment-2747162.
The Born Liar, having been caught out deliberately making false statements in the past, has been pettily but wrong-headedly objecting to our research ever since. He is not to be relied upon.
If pressed, he will admit that there is indeed a feedback response to emission temperature – a response that climatology currently misattributes to direct warming by greenhouse gases. Once that is admitted, the rest of our conclusions follow.
“First, as IPCC says above, the emission temperature that would prevail near the Earth’s surface in the total absence of greenhouse gases at the outset would be about 255 K.”
Or does convection and evaporation in an ocean-coupled dynamic troposphere set the skin temperature at the tropopause to minus 60C and lower the actual near surface summer temperatures of around 60ºC to that observed at the height of a Stevenson Screen?
The only meaningful greenhouse effect is that of radiation from the boundary layer 1.5km thickness after being warmed by the daily convective cycle slowing down surface radiative cooling at night which in hot dry deserts can drop to below freezing even with an air temperature of 5ºC.
The 255 K emission temperature would obtain near the surface in the absence of greenhouse gases. Water vapor is a greenhouse gas. Evapotranspiration is the mechanism by which water-vapor feedback and related feedbacks arise in response to emission temperature and to any direct perturbation thereof by noncondensing greenhouse gases.
The unalloyed truth is that the climate change crisis has been long ignored. Despite various warnings from researchers to take immediate action against climate change- people and politicians, in general, have not taken the possible harm of climate crisis very seriously. This attitude has been inherently flawed and dangerous to our ecosystem and life on earth.
The world that is on pins and needles with the continuously deteriorating environmental conditions had been wistfully pinning hopes on COVID-19 spillovers to turn out as its saving grace. But nothing good seems to come out of the pandemic as the recent record-high carbon dioxide (CO2) level disheartened many environmental enthusiasts.
You are joking, right?
Mr Smith, with his “unalloyed truth”, is a zealot. He would do well to read the head posting and then think about it, rather than futilely parroting the climate-Communist party line. Warmer weather is better than colder: but there will be a lot less warmer weather than the climate Communists profiteer by predicting.
It’s impossible to accept your proclamation in the absence of any data to support your claim. Perhaps you didn’t try to support your claim with specifics because you don’t know of any that will stand up to scrutiny?
John for someone who believes in the Warming Crisis as you do, you seem to be unaware of the elephant in the room. Even if the West reduces fossil fuel use to zero,at a cost of an estimated $90 trillion for the US alone, we are going to see 600ppm CO2 by 2100 anyway. 5 billion non-Westerners have opted for lifting their people out of poverty and going for a prosperous future using coal, which is abundant and cheap. Moreover they are succeeding amazingly. One example, Bangladesh a few decades ago was one of the poorest of countries,but today, GDP has grown to over 15% a year and, incidently, in one generation has reduced their fertility rate from 6 children per family to todays 1.9 children. Larger footprint in energy production but diminished per capita footprint. The rest of Asia, Africa have jumped on this opportunity. Africa south of the Sahara is ~3% growth in GDP. Over 400 coal fired power plants are under construction or on the drawing board ready to go.
Think about this. There is no turning back. There is no stopping this. Colonial experience has taught these people not to rely the West anymore. We are going to do the big CO2 experiment regardless of what the West does. We are going t find out exactly what the climate is going to do. Even Joe Biden and Kerry have said that if the Third World continues on this path. There is no point to the West destroying its economies to no avail.
Does this trouble me. No. Nothing bad is happening out there to the climate after over 40yrs of alarm. The ‘scientists’ made projections those years ago that subsequently proved to be 300% exaggerated and this was then followed by 18yrs of no warming. Presently we are in the 6th year of a new cooling event globally.The only palpable sign of climate change has been the Great Greening of the Earth due to elevated CO2 in the atmosphere.By 2017 NASA reported that new “leafing out” has covered 18% of the globe. In 2015 forest areas had expanded 15%. Probably by today both are about 20% more than they were 35years ago. Along with this bounty of new habitat, bumper harvests have doubled and redoubled grace of the same CO2. It looks like we could get a maximum of another 0.6C for the coming 100yrs, or it is just as likely to be cooler.
John, broaden your reading away from the gray gloom and doom literature, NYT Wapo and cable news. Suspend belief for a little while and investigate it yourself. You at least have come to WUWT, a good first step. Even Michael Moore was upset at the lie of renewables he unexpectedly uncovered in his “Planet of the Humans” documentary. Find it and watch it. It is one of the few investigative journalism products to be found. He didn’t get everything right but what he did find was dynamite. Did you know that the owner of this blog, Anthony Watts was once a believer in the ‘Crisis’, as was I.
What must really disheartening to an alarmist zealot is that even with everyone grounded for over a year, it did not even make a perceptible blip in the levels of daemonic CO2. That makes it very clear to everyone then even continuing to lockdown the entire population would not be enough to have the slightest effect on reducing CO2 and their whole crusade is in fact a farcically misinformed mistake.
The trouble is this isn’t about anything other than blind faith; a new religion if you will.
There are more holes in their theory than there are in a colander and yet it remains their truth. And it seems unshakable. For example, the BBC had someone on this morning advocating adding messages to contraceptive packaging along the lines of ‘you’re helping to save the planet.‘
That’s not normal.
In response to fredslider, our approach is to see if we can persuade a learned journal of climatology, edited by a scientist who is on record as saying there are no credible arguments against the climate-Communist party line, either to tell us what is wrong with our result or to publish it. If our result is published, then unless someone can point out a sufficiently significant error that will be the end of the climate scam.
Though the trolls for the Party Line have done their worst to overthrow our result, they have failed and they know they have failed. Either the Sun can evaporate water, in which case our result follows, or it can’t, in which case greenhouse gas increases can’t either.
I wish you the very best in your endeavours. Science and the method are very much in need of defence from the post-modern lunacy where the alternative hypothesis is true until falsified – and the fad is for making it unfalsifiable. Key number 2100
If only it were just about scientific argument. As I said in my original comment, this is their truth – no matter what the scientific evidence might show.
There are many factors coming into play right now and one of the most important of those in the last year has been the attainment of social control. In the UK all the signs are this will be retained ad infinitum in some shape or form.
I thought the last parliament bad enough, but this one is very woke and very green and like its predecessors, above monarch and people. One only need look where parliament and government get their advice…
Well, I am old-fashioned enough to believe that objective truth cannot be indefinitely denied, and will eventually emerge regardless of the farces ranged against it. In the end, we are going to compel clahmatawlagy to admit that the Sun is shining and that, therefore, one ineluctable consequence is that nearly all of the feedback response in the climate system is feedback response to the emission temperature in the absence of any greenhouse gases, and hardly any is feedback response to direct warming by noncondensing greenhouse gases.
The truth will out!
The sun begins the process of creating water vapor and increasing its energy. CO2 is a bit player.
I wish someone would produce such a graph using the actual solar spectrum above the atmosphere! It’s jagged as the dickens. I’m lousy at it. The two I put together, after matching their scales, had the top of atmosphere insolation lower than at ground level.
Here is the graph of the AM0 spectral irradiance from ASTM E490:
“Either the Sun can evaporate water, in which case our result follows, or it can’t, in which case greenhouse gas increases can’t either.”
Ever since the first human moved water from a source to where they planted seeds to grow food, has increased evaporation above what would have occurred naturally. Farming has greatly increased since that time globally. The amount of Evaporation to create Atmospheric Water in a growing season globally would be gigantic.
From the first Steam Engine that created more Atmospheric Water to the first fossil fuels electric plant that created steam to turn a turbine and the first Solar Mirror Farms that create steam to turn turbines, to Nuclear Plants that create steam to turn turbines, to today where those fossil fuels and solar mirror and nuclear add gigantic amounts of Atmospheric Water.
From the first non-food garden that was watered to every home, apartment complex, condominium, park, city wide planting flora, housing communities, businesses and everything else that plants anything that is watered increased Evaporation.
While all the Flora has sequestered Water and CO2 for its lifetime as food’s and cosmetics that are short term as crops are harvested and cosmetics cut and trimmed, and wood that has become building materials to sequester some of the Water and CO2 until it burns.
All Fauna sequestered Water and Carbon for their lifetime until they lose weight, die, decay or burn to return the Water and CO2 back to the environment.
That getting any idea of how much Water and CO2 is in the Atmosphere or sequestered would be impossible to calculate. But, that Humans have added more Atmospheric Water that’s being ignored is my point.
That both warming and cooling is due to the Water in the Atmosphere and how much Solar Radiation there is, makes all other GHGs not worth the time to even consider… much less be causing the scare tactics being used.
John Chism is not quite correct. Water vapor in the atmosphere (actually, only in the near-surface boundary layer) will tend to increase its concentration with temperature, in accordance with the Clausius-Clapeyron relation. That is why it is treated as a feedback. If we put noncondensing gases into the air and they cause a direct warming, the increase in water vapor consequent upon that direct warming will cause further warming. That is the water-vapor feedback. And that is why one cannot avoid consideration of the direct warming by the noncondensing greenhouse gases.
We’ve passed 1.5°K with another 0.1 baked in and that’s only x150%. About 3° seems a pretty good bet given recent years are above the long term indicating accellerating warming.
What a joke. The world is cooling. Growing seasons are shortening, vast areas are experiencing much cooler temperatures including summer snows and most importantly the ocean temperatures are dropping. Even Greenland is experiencing no melt season this year to date.
Europe is heading for a few decades of much colder weather. The North Atlantic is growing cold. Better figure out how you are going to survive. Making up numbers and purporting them as the truth isn’t going to work when people are freezing to death in their homes.
Not a shread of evidence for any of your illinformed misapprehensions. Give us your numbers.
Global temperature trend from 2020 –
https://www.woodfortrees.org/plot/uah6/from:2020/to:2021.5/trend/plot/hadcrut4gl/from:2020/to:2021.5/trend/plot/gistemp/from:2020/to:2021.5/trend
Greenland melt season to date:
http://polarportal.dk/fileadmin/polarportal/surface/SMB_curves_LA_EN_20210707.png
CDAS SST Temp Anomalies:
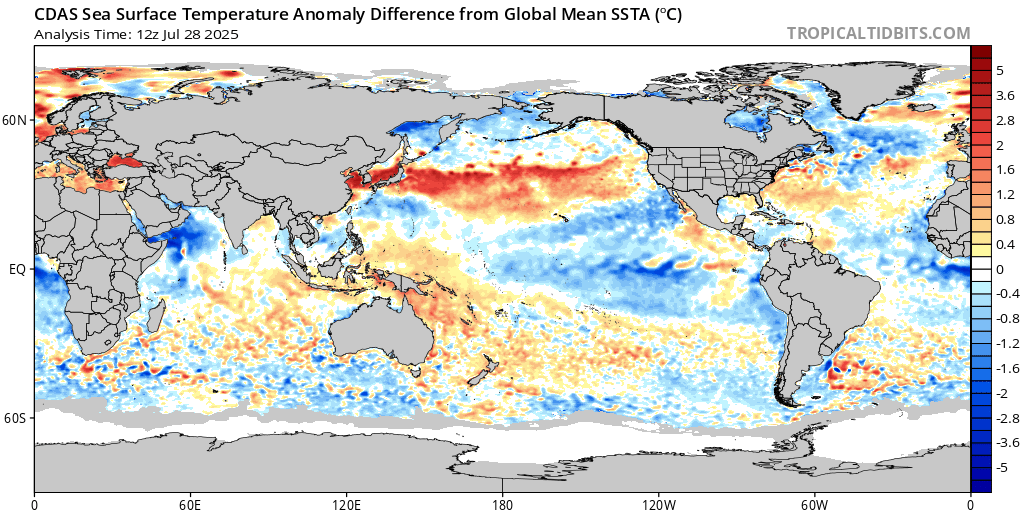
The asinine “Loydo”, without offereing any evidence, says “We’ve passed 1.5 K”. According to HadCRUT4, make that 0.9 K, or 1.04 K according to the much-tampered HadCRUT5. Loydo offers no evidence that even another 1 K of global warming would be net-harmful.
And serious researchers don’t just pluck an estimated ECS out of the air and say, on the basis of an inaccurate representation of the data, that it is “a pretty good bet”.
Loydo’s paymasters are wasting their money funding him to post stupidities here.
No, all serious searching should begin in 1750,
http://berkeleyearth.org/wp-content/uploads/2015/02/annual-comparison-small.png
from whence it all began. From humble beginnings our legacy is now up to 0.18C/dec or so and shows no sign of slackening. Still looks like 3ish and none of your embarrassing outbursts will change that.
Loydo is, as ever, plumb wrong. The warming rate over the past six decades (which are the minimum for long-term trend estimation) is 1.5 K/century equivalent, of which little more than half is anthropogenic. Even allowing for some further acceleration, therefore, the anthropogenic component in warming this century is unlikely greatly to exceed 1 K.
It is indeed embarrassing that Loydo cannot understand the simple point being made in the head posting: which is that the Sun can evaporate water and that, therefore, nearly all of the feedback response in the climate system is feedback response to emission temperature – a point that climatologists have not yet understood, which is why they make such absurd over-predictions.
“of which little more than half is anthropogenic.”
citation please m lord
For the last three decades, see Wu et al. 2019, table 2. For the six decades – and, indeed, for the whole industrial era – see an imminently forthcoming paper by some of my distinguished scientific colleagues, jointly with colleagues on the other side of the scientific divide on the climate question. I shall write about it here as soon as it is in print. It has been accepted.
“For the last three decades, see Wu et al. 2019, table 2”
Lie.
As I’ve pointed out multiple times.
just saying so does not make it so.
Why then does their graph refute what they are “saying” (it doesn’t)
You can read a graph?
If you can’t, then tell us how a NV can add to long-term warming when (as the graph shows) it in turn is both +ve and. -ve resulting in zero sum – as it must as it is cyclic.
And then the supposed 70% becomes “little more than 50%”
Dear god, misrepresentation heaped upon lies.
Have you been like this all your privileged life Monckton.
Never being able to admit that you are wrong?
You are in intelligent chap.
No expertise in science, true, but I find it hard to think you are unaware that you are lying about this and (see Hadfield’s) exposure – many others.
But, who knows how far the DK syndrome may go when added to privileged hubris (and not forgetting, added knowledge of the Classics of course).
Maybe it is the sense of superiority from a privileged background that you show in, err, “conversation” with people who challenge you here, but I suspect it is a natural character trait … and a deeply unpleasant one
ONE THAT DOES NOT BELONG IN SCIENTIFIC DISCOURSE
(well life in total actually)
I remember seeing a vid of you spieling your way through a presentation on GW and being aghast at the complete distortions you conjured up with you your, oh so slippery rhetoric that had the already converted there mesmerised.
You don’t mesmerise me you scientific phoney.
And then you flunked the opportunity to defend yourself against Hadfield that Anthony provided you here.
Full of nasty spittle-flecked anger against (sic) communists is what drives you m’lord, and your, so called science.
Why does the graph directly refute your lies Monckton?
It’s what the paper says that matters. And what it says, at table 2 and in the conclusion, is that only 70% of industrial-era change in temperature (not in temperature variability) is anthropogenic.
In any event, a more recent paper, which has been accepted and is trembling on the verge of publication, will reduce the anthropogenic fraction to 50%. We shall, therefore, substitute that value into our paper once the new paper is finally published.
And Mr Banton should dial back on the ad-homs. They do not reflect well on him.
CMIP6 calls 1850 the pre-industrial period. The world was barely burning coal between 1750 and 1850.
Everyone will agree the global temps went up over the past few decades; however, the trend is down and relatively rapid since the last El Niño. -.4C in 18 months is a pretty fast change and it certainly doesn’t support the every month is warmer than the last mantra.
I’m glad I live in an area of the Earth that is warm because if the AMO flips as it appears it is doing, Europe with their move to wind/solar power generation is in for a “heap of trouble” as they say here in the American South. Good luck Loydo, you are going to need it.
“and it certainly doesn’t support the every month is warmer than the last mantra.”
Yes, we haven’t heard those kinds of claims lately since they have a hard time selling it when it is cooling as it is now.
Serious searching should start 200 years before any significant rise in CO2 levels?
Are your really that desperate.
Yep, from the end of the LIA. Why did the change occur and what was going to stop warming?
Loydo thinks that the ideal global temperature occurred in the depths of the little ice age.
Loydo thinks?
Yep, lets start at the coldest period of the Holocene to make a point that its been warming for about 300 years. Your problem is that the globe has been cooling for about 3 to 5 thousand years. Will the world end if we get back to the temperatures of the Roman Warm Period?
True rbobcock – the world is getting colder – as we published in 2002 (and 2013).
The UPPER BOUND of climate sensitivity (CS) to increasing atm. CO2 is ~1C/2xCO2.
In reality CS is probably so small that the practical conclusion should assume it equals zero.
Society has been panicking, harming billions and squandering trillions over a gossamer fiction.
Notes from the Underground – Записки изъ подполья – 2013 Version
https://wattsupwiththat.com/2013/12/02/study-predicts-the-sun-is-headed-for-a-dalton-like-solar-minimum-around-2050/#comment-1147149
philjourdan says: December 2, 2013 at 6:13 pm
Given the sun was the most active in the past 300 years during the latter half of the 20th century, and that “coincided” with the rapid warming that seems to have abated, how does the theory work (I heard Gavin Schmidt voice it) that the warming of the latter half of the 20th century could NOT be due to the sun?
I am curious how that was ruled out given the studies that show the sun activity was very active.
________
It’s like this – the warming on Earth actually causes increased activity of the Sun!
Same principle as “CO2 drives temperature” – when we know that CO2 LAGS temperature at all measured time scales.
Do I need to say sarc off?
(Not directed at you Phil – rather my observation on the obviously false and foolish global warming “crisis”, the ECS debate, etc.)
P.S. I suggest global cooling starts by 2020 or sooner. Bundle up.
__________________________________
http://www.thegatesnotes.com/Books/Personal/The-Bet?WT.mc_id=12_13_2013_TheBet
[excerpt]
The “mainstream” global warming debate centres on the magnitude of Equilibrium Climate Sensitivity (“ECS”) to atmospheric CO2, which is the primary subject of contention between global warming alarmists (aka “warmists”) and climate skeptics (aka “skeptics”).
Warmists typically say ECS is high, greater than ~~3 degrees C [3C/(2xCO2)] and therefore DANGEROUS global warming will result, whereas skeptics say ECS is 1C or less and any resulting global warming will NOT be dangerous.
The scientific evidence to date strongly suggests that if one had to pick a side, the skeptics are (much) more likely to be correct.
However, BOTH sides of this factious debate are in all probability technically WRONG. In January 2008 I demonstrated that CO2 (change) LAGS temperature (change) at all measured time scales*, so the mainstream debate requires that “the future is causing the past”, which I suggest is demonstrably false.
In climate science we do not even agree on what drives what, and it is probable that the majority, who reside on BOTH sides of the ECS mainstream debate, are both technically WRONG.
Well this is just dandy…
BTW, the grape crop in France and Germany was frozen out this spring.
Any more of this global warming will freeze our nuts off. And the veggies.
ARCTIC FRONT TO BUFFET EUROPE + THE SCHOOLING SYSTEM AND MINDLESS ROBOTS
July 8, 2021 Cap Allon
School produces unquestioning sheep that concern themselves not with the authoritative thumb under which they find themselves, but instead with the trivial routine of the daily grind, and, in the most indoctrinated of cases, with the exaggerated ’emergencies’ of the time.
SUMMER SNOW AND SUB-ZERO LOWS SWEEP CANADA, AS SOUTH AMERICA CONTINUES TO FREEZE
July 8, 2021 Cap Allon
A severe chill has invaded large pockets of both North and South America of late, as Greenland posts yet more historic snow and ice GAINS.
Watch that La Nina – if it happens, expect more cooling.

RARE JULY FROST AND RECORD COLD HIT MINNESOTA, S. AMERICA CORN SUFFERS DUE TO “UNUSUAL COLD”, AS ADDITIONAL POLAR BLASTS STRIKE AUSTRALIA AND NEW ZEALAND
JULY 9, 2021 CAP ALLON
The global average temperature has dropped some 0.7C since the start of 2016. And looking ahead, climatic patterns look set to accelerate this cooling into 2022. #Prepare.
NOAA DECLARES “LA NIÑA” WATCH FOR THE FALL: THE GLOBAL COOLING ACCELERATOR
JULY 9, 2021 CAP ALLON
Entering a La Niña event when global temperatures are already around baseline is significant — readings 0.4C below the 30-yr average should be expected by the spring of 2022.
“WITH APOLOGIES TO EVERY POET WHO EVER LIVED…
We predicted global cooling – and we weren’t fooling.:
Back in 2002 – we did tell you.
We told you so – 19 years ago.
Starting ~2020 – with cold a-plenty.
I’d rather not – but it’s what we got.
Cause I’m getting old – and hate the cold. 🙂
RECORD LOWS LOGGED IN SYDNEY, AS UPPER MICHIGAN SUFFERS A RARE SUMMER FREEZE, + TWO SOLAR FLARES, TWO RADIO BLACKOUTSJuly 10, 2021 Cap Allon
Every Aussie state and territory registered temperatures cold enough for frost this week, as frigid polar air swept the continent. Plus, a minor solar flare just led to radio blackouts over Europe and Asia.
“Growing seasons are shortening”
I think you need to tell Mother Nature that she’s got it wrong then ….
https://esajournals.onlinelibrary.wiley.com/doi/full/10.1002/ecs2.1465
“Here, we use estimates of start of spring based on climatically modelled dates of first leaf and first bloom derived from indicator plant species to evaluate the recent timing of spring onset (past 10–30 yr) in each U.S. natural resource park relative to its historical range of variability across the past 112 yr (1901–2012). Of the 276 high latitude to subtropical parks examined, spring is advancing in approximately three-quarters of parks (76%), and 53% of parks are experiencing “extreme” early springs that exceed 95% of historical conditions. Our results demonstrate how changes in climate seasonality are important for understanding ecological responses to climate change, and further how spatial variability in effects of climate change necessitates different approaches to management. We discuss how our results inform climate change adaptation challenges and opportunities facing parks, with implications for other protected areas, by exploring consequences for resource management and planning.”
Because it doesn’t seem to be aware of your “alternate news”
Growing season for farmers is last frost to first frost. It can even be abnormally warm in early spring but that one frost that comes late is the killer. The start of Spring and the start of the growing season isn’t the same thing. Additionally it can be spring and cold, which doesn’t support the growth of the crops that have been planted. This extends the time to maturity, which can also put the plant at risk. Additionally soil temperatures can be abnormally cold keeping the seed from germinating. Plus cold wet weather keeps you out of the fields.
All this has nothing to do with someone arbitrarily assigning some definition of Spring so a computer model can take fake temperature numbers and spit out a length of Spring metric. There is a difference between when native perennials leaf in the Spring and planted corn or soybeans. Most native plants can survive frosts and even freezes early in the season.. corn and soybeans won’t. Maybe you need to education yourself on this “alternate news”.
Would you like to apply your “Alternate facts”
To this as well?
This time provide some observations eh?
And not worthless hand-waving denial.
https://www.epa.gov/climate-indicators/climate-change-indicators-length-growing-season
“Key Points
To most people, a longer growing season would be good news.
Planting was ~one month late across the Great Plains of North America in both 2018 and 2019. In 2018 the growing season was warm and the crop recovered, but in 2019 there was a huge crop failure across the Great Plains; funny we did not read about that in the mainstream press, did we?
In 2019 fully 30% of the huge USA corn crop was never planted because of wet ground. Much of the grain crop across the Great Plains was not harvested because of early cold and snow in the Fall. Read the paper by Joe D’Aleo and me.
THE REAL CLIMATE CRISIS IS NOT GLOBAL WARMING, IT IS COOLING, AND IT MAY HAVE ALREADY STARTED
By Allan M.R. MacRae and Joseph D’Aleo, October 27, 2019.
https://wattsupwiththat.com/2019/10/27/the-real-climate-crisis-is-not-global-warming-it-is-cooling-and-it-may-have-already-started/
”Planting was ~one month late across the Great Plains of North America in both 2018 and 2019”
2 seasons is weather not climate.
long term trend please if you have observations that contradict the above.
Seriously AB???
We predicted in an article published in 2002 that global cooling would start circa 2020, and it has clearly started. There is no “long term cooling trend” because cooling is only a few years old.
Do I have to explain that to you again or do you understand?
For numerous major cooling events, see Electroverse.net
Yes seriously.
As is obvious to anyone who is not a regular denizen.
It is laughable that you refer to a forecast from 2002 that reckons cooling will start by last year and call upon the multiply “adjusted”UAH v6 as evidence when you will fully deny decades of warming.
Are you not aware of the modulation that ENSO provides to the GMST?
What have we recently seen in the equatorial pacific?
Of course you are as it is so, so important that you have a Nina.
FYI in the past a Nina used to take the GMST down a bit (in surface indices).
Now it just registers a pause.
And no, a Nino does does not drive warming. It cannot as any extra energy they inject within the atmosphere is lost to space within weeks/months.
Looking at UAH V6
can you seriously mot envisage the current dip returning to the spikes shown multiply in response to NV?
Try drawing a linear trend line through it – that is the AGW trend. The noise around it is NV (chiefly ENSO) that oscillates around it.
AB – utter drivel.
You took the words out of my mouth, said internally every time i read yours.
But thank you for the Moncktonesque response.
Thankfully without the verbosity.
So ENSO does not modulate climate?
Then Ninos cant be driving warming.
And Roy’s data is incorrect in reflecting the correlation with ENSO
Is it the Sun? Leif says no.
Is it (the current Monckton bollocks) undersea volcanoes?
Or is it not happening at all?
I know….
All Earth scientists are incompetent.
Or
All Earth scientists are committing a fraud (all the way back to Tyndall and Arrhenius).
Actually the answer is…..
THEY KNOW MORE THAN YOU.
Because you come at the science in an ideologically motivated ABCD
More drivel.
indicating accellerating warming.
Those of us who are enduring a very cool and wet summer (we were promised hotter, drier summers by AGW theorists like David King, Met Office, UEA – University of Easy Access etc) would appreciate some accelerated warmth.
So is your heat (NW America) or our cold global and representative?
“Those of us who are enduring a very cool and wet summer “
(presuming you live in the UK)
“UK last monthJune 2021The first half of June was largely dry and warm, though less settled over Scotland towards mid-month. The second half saw temperatures broadly nearer to average, with some days very cool for the time of year, and numerous showery days over England including some thunderstorms, and some heavy convective outbursts especially in the south-east.
The provisional UK mean temperature was 14.2 °C, which is 1.2C ABOVE the 1981-2010 long-term average. Mean maximum temperatures were up to 2 °C ABOVE normal in some northern areas, while mean minimum temperatures were similarly high in parts of eastern England. Most areas from Wales and the Midlands northwards had a DRY month, with less than a third of the usual rainfall in some areas, but south-east England was very wet with more than double the average rainfall for some locations. The UK overall had 59% of average June rainfall. Sunshine was above average for northern and eastern areas, but just below average for some western fringes, with 107% of average overall.”
So apart from being wrong there …
“we were promised hotter, drier summers by AGW theorists”
Were you expecting every summer to be so?
Not sure where fretslider lives, but I think it’s the UK from his previous posts. Summer means June, July and August in the UK. We’ve only got numbers for June so far, and the Central England Temperature series (CET), at 15.5 C, was +1.3 C warmer than the long-term average for June. 15.5 C is also +0.8 C warmer than the 1991-2020 CET average for June and it was the warmest June since 2018.
https://www.metoffice.gov.uk/hadobs/hadcet/index.html
Same story for the UK as a whole. Met Office report UK average temperature for June was +14.2 C, which is +0.9 C warmer than the 1991-2020 average and makes June 2021 the 14th warmest June in the UK temperature record, which begins in 1885. Again, it was the warmest June in the UK since 2018.
Met Off also supply rainfall statistics. Average rainfall across the UK in June 2021 was 43.2 mm, making it the 29th driest June in the UK rainfall record, which starts in 1862. It was also the driest June since 2018.
https://www.metoffice.gov.uk/research/climate/maps-and-data/uk-and-regional-series
Links are supplied just in case the unfortunate fretslider, who somehow managed to stay cold and wet in the UK during a month with above average temperatures and below average rainfall, wants to check for himself. (Pity he didn’t think to do this before posting, him being a ‘skeptic’ and all.)
Taking a look at the ensemble data for average temperature for SSP185, and you’re off by 0.2C.
Temperature in 1850 13.6C
Warming 1850-1900 0.1C
Warming 1900-1950 0.2C
Warming 1950-2021 1.1C
Total warming since 1850 1.3C
At the current exponential rate of CO2 concentration, and the since 1978 linear trend in temperature of +1.4C per century, which shows no sign of acceleration, we will be at 560ppm in 2082, with an additional warming of 0.7C. That would suggest ECS is 2.1C
HadCRUT4 says 0.9 K from 1850-2020; HadCRUT5 says 1.04 K. Furthermore, according to a forthcoming paper, about half of all warming to date is anthropogenic, and Wu et al. (2019) find that since 1990 little more than half of warming has been anthropogenic. Allowing for these factors, ECS is about 1.1-1.2 K.
I don’t doubt what you say. I don’t trust the historical temperature figures prior to 1950. At least, the tortured, spotty, incomplete figure that are sausaged into proxies. I’ve been trying to show friends how all of the models consistently over-predict warming and meanwhile the trend since 1979 has been steady and linear at +1.4C per century.
I’m using the data from CMIP6 just for convenience but I have no doubt they have yet gain chilled the past. I find it insane that most of these models have different historical temperature sets. That alone should be a basis to reject all of these models. Averaging them all and assuming that’s right is silly.
The point to my friends has been, if you assume the warming stays steady, and CO2 continues to rise exponentially (although Roy Spencer has suggested the biosphere might actually be increasing its ability to absorb excess CO2) you see 560ppm CO2 by the year 2082, and the linear trend in temperature has us 0.7C higher than today at 15.7C, or 60.2F to use God’s preferred scale. This is a silly and absurdly simple calculation, but most people can grasp it and shrug off the totally unalarming warming below all of the scenarios.
Captain Climate is right that there are many ways of deducing that there will not be anything like as much global warming as the usual suspects profiteer by asking us to imagine. However, there is no substitute for a reasonably rigorous scientific demonstration that they have made an elementary and significant error of physics and that, after correction of that error, it is self-evident that there is no good reason to expect more than about a quarter of their current midrange projections.
“Wu et al. (2019) find that since 1990 little more than half of warming has been anthropogenic. Allowing for these factors, ECS is about 1.1-1.2 K.”
There you go again (for the 3rd article in a month from you) – No Wu, Hu et al most certainly don’t conclude that.
“Also the fake news is getting worse! – 70% is a tad more than “a little more than 50%”) – but that’s just another of your snake-oil selling spiel.
They find that the variability through that period was 30% due to natural variation and that the total NV at the end of the period was a Zero sum.

That is 100% anthro.
The graph you don’t like (I wonder why?) – with the bottom curves showing Zero contribution to the total warming AT THE END (that’s bottom right).
Which is of course the relevant time to judge WARMING through the period.
(For those mesmerised by the salesman NV is cyclic and cannot contribute to climate, it is the moving around of heat within climate and in no way a driver).
From Wu, Hu et al …..
https://www.nature.com/articles/s41612-019-0075-7
“both AMV and PDV play a significant role in MODULATING global mean and regional SAT changes in the past a century-and-a-half.”
(What does “modulating” mean?)
“Overall, the AMV contributes significantly to the global mean SAT TRANSIENT CHANGES on multidecadal timescale, however, the contributions of PDV and AMV to global mean SAT have similar magnitudes on decadal timescales with the PDV leading AMV in most parts of the 20th century. Moreover, when PDV and AMV are in-phase, the contribution of NATURAL CLIMATE VARIABILITY to global and regional climate can be significantly larger than that from GHGs, but an out-of-phase change of PDV and AMV could minimize their contribution to global and regional climate. As the GHGs increase further, our study shows a declined influence of the PDV and AMV to global and regional climate relative to that of GHGs.”
(What does “transient changes” mean?)
(What does “natural climate variability mean”?).
“Allowing for these factors, ECS is about 1.1-1.2 K.”
Due to the above showing your, err, “misinterpretation” of Wu, Hu et al.
You are therefor incorrect.
And no childish ad homs along the lines of “Born Liar” Monckton.
It most assuredly unbecomes a Lord of the Realm don’t you know?
Just answer the questions please (they are the ones with ? at the end).
Poor Mr Banton whines as his superstition collapses in ruins about him.
Perhaps he had better read Wu’s paper, rather than using the unreliable analysis of his fellow troll Stokes.
He might have a look at Table 2, for instance.
Oh, and a forthcoming paper by some distinguished colleagues of mine will show that not 30% but 50% of industrial-era warming was natural. Piece by piece, the edifice of climate nonsense is dismantled.
“Oh, and a forthcoming paper by some distinguished colleagues of mine will show that not 30% but 50% of industrial-era warming was natural.”
Really?
Must be true then
I mean – distinguished colleagues no less.
“Poor Mr Banton whines as his superstition collapses in ruins about him.”
LOL
“And no childish ad homs along the lines of “Born Liar” Monckton.
It most assuredly unbecomes a Lord of the Realm don’t you know?
Just answer the questions please (they are the ones with ? at the end).
QED
NO substantive come-back just childish ad-hom.
Answer my question on the lies you tell about the Wu, Hu et al paper if you please m”lord.
Mr Banton, who at least now posts under his own name, does appear to be more than a little frightened at our result showing that the Great Cause to which he has devoted so much time at the behest of the Party turns out to be based on a spectacularly elementary and grave error of physics.
As to his question about Wu et al., it is asked and answered supra.
“As to his question about Wu et al., it is asked and answered supra.”
Should be fun.
denying the obvious in black and white.
Oh and do post the graph as well m’lord.
And tell us that the rh scale where it shows 100% of. warming caused by CO2, is actually only 70% !!
or as you put it a the top, oh, so disingenuously “little more than 50%”
Asked and answered supra.
I refer you the request I’ve made multiple times.
Post the response here.
The Hu/Wu et al graph flatly contradicts you (and themselves it seems).
The bottom rh side shows zero NV warming over the period in question. There having be both +ve and -ve aspects canceling out. Leaving ALL warming due to CO2.
Plain as day.
And what’s more intuitively obvious …. unless you only have degrees in journalism and the Classics and attempt to portray yourself as being an expert in climate science, and heck, electronic gain theory as well.
You are no expert in either m’lord.
Mr Banton should read Wu’s paper, look at Table 2 and think before shouting.
Your spaghetti graph is unintelligible, even when posted multiple times.
It’s not mine.
It’s by Wu, Hu et al
So what, its still unintelligible.
Mr Banton is well out of his depth here. Those who, like Mr Banton, imagine that Mr Stokes was right that Wu et al. did not mean what they said when they said that only 70% of recent global warming was anthropogenic may care to look at table 2 of Wu’s paper.
I looked at table 2. The cumulative SAT is 0.891C. The cumulative AMV+PDV contribution is -0.037. The cumulative CO2e contribution is +0.815. The table documents the residual as well. The authors also say that some of the CO2e “leaks” into the residual so that +0.815 is likely underestimating the anthropogenic contribution. In other words, table 2 is implying that anthropogenic contribution is at least 91% and could possibly be as high 104% to compensate for the -4% contribution from natural variability. I encourage you to plug the values into Excel, integrate the trends, and check my work.
He wont.
I’m not sure that one can total the trends in that way. And one still has the conclusion, which states that 70% of the “changes”, not “variability”, in global mean surface air temperature are anthropogenic.
However, the point will instantly become moot when an updated paper by solar physicists on both sides of the divide shows that about 50% of the warming to date is natural – just as Table 2 appears to show for 1990 onward.
They tell you exactly how they arrived at the 70% figure. It is from their equation GMSAT = 0.229*CO2e + 0.072*AMV * 0.024*PDV. Note that 0.229 + 0.072 + 0.024 = 0.325 and that 0.229 / 0.325 = 70%. This equation is how they model the temperature time series. It is important to note that “changes” mean any movement of the GMSAT either positive or negative. The reason why CO2e is only 70% here is because the GMSAT has periods of higher/lower movements than can be modeled by CO2e alone. In fact, the GMSAT even has periods of decline that CO2e cannot model at all since it is always positive. It is important to note that AMV and PDV, unlike CO2e, can take on negative values. The methodology here tells us that the 70% figure is one of variability. In fact, the section that describes the methodology even uses the word “variability” to describe the coefficients above.
It would have been helpful if Wu et al. had used the word “variability” consistently throughout the paper, particularly in the conclusion. “Changes in global mean surface temperature” usually means the difference between the value at one end and the other of a timeseries, while “variability” means the ups and downs either side of the trend.
I shall make further enquiries. However, the point is moot, since a paper imminently due for publication finds that about half of the warming of the industrial era was natural. We currently take 70% as our midrange case. We shall in future take 50% as our midrange case, but we shall still also show the value of ECS assuming that all warming were attributable to us, just as our current draft does.
I kicked mine off in 1750 when our CO2 emitting started. The bit of landclearing before that can be ignored.
Warming 1850-1900 0.1C
Warming 1900-1950 0.2C
Warming 1950-2021 1.1C
Looks a bit like acceleration. Now its more like 0.15 – 0.2C/decade, so its going to be the Eemian all over again except this time with a lot more CO2, so actually more like the early Miocene all over again.
It’s a pity this field constant quotes anomalies for ever-changing reference ranges so as to confuse everyone. Of course, when they do that, you notice their baseline for 1850 is constantly changing. Was it 13.6C or not? Was the temperature in 1900 13.7C or not? I’m taking the CMIP6 ensemble historicals as Gospel, when I really don’t think they have a prayer in hell of resolving global temperature to 0.1C in 1850.
Never question the output of your calculator or spreadsheet! It is precise to as many digits as it displays, by definition. Nonsense about significant figures is a conspiracy to sow doubt about the ability to magically improve precision by averaging large numbers of thermometers of different design and with unknown calibration, with different protocols for reading and recording temperatures.
“ Nonsense about significant figures is a conspiracy to sow doubt about the ability to magically improve precision by averaging large numbers of thermometers of different design and with unknown calibration, with different protocols for reading and recording temperatures.”
AGAIN? You are nothing if not stalwart in your brain froze defamation of the CLT. And what up with this ridiculous “large numbers of thermometers of different design and with unknown calibration”?
The time period under discussion is over 200 years after the first estimate of the speed of light. I.e., for all intents and purposes “modern”. Therefore, they understood everything they needed to know about both the accuracy and precision of the instruments and processes under discussion. This is accounted for in every temp aggregation from 1880 on, in the form of decreasing sigma as the time advances. This from better instrumentation/processes, better siting, etc.
BTW, while you are out of this world on your alt.stats and areal interpolating w.r.t. single month estimates (and their sigmas) you are even sillier regarding their trending. Even your worst CLT denial on areally interpolated averages pales when compared to how out to lunch you are when those averages are trended. Since the influence of those tiny monthly sigmas on the trends is over an order of magnitude smaller than even the (usually small) standard errors of any physically statistically significant trends, when computed from expected values. BFD. In other words, most of the trends you decry have such a small chance of being incorrect to any significant degree from your pearl clutching, fact free “unknown calibration” whines, that neither of us can calculate the odds on our home machines…
I think we would be better off with scientists from 200 years ago evaluating the modern data quality than the likes of you.
However, what is at issue is the manufacturing quality-control on thermometers of that time, the development of standardized procedures for calibrating the field thermometers, and training for those doing the reading. Clearly, those have all improved and contribute to the declining sigma over time.
However, what really is important is that since the advent of computers, many trained in the sciences have not been instructed in the proper use of significant figures, and blithely publish data that implies greater precision than is warranted. They unthinkingly accept the output of a computer as being the last word.
There are constraints on when the CLT can be applied, which you seem to be unacquainted with. Most importantly, the data must be of the class that mathematicians call “stationary.” That is, the data must be obtained from measuring something that doesn’t change with time, and be normally distributed. There are numerous problems resulting from trying to adapt temperature measurements to a task for which they were not intended. To whit, 1) the daily temperatures are mid-range values, not true arithmetic means; 2) averaging makes it appear that the variance is smaller than it actually is; 3) temperature data are almost always skewed, i.e. not normally distributed; 4) improperly applying the CLT further reduces the apparent variance; 5) the interpolation procedures for data between stations erroneously assumes that the temperature changes are always smooth and continuous, with no abrupt changes as produced by moving weather fronts, or intervening microclimates produced by topography and bodies of water.
Speaking of “fact free”…
Please explain how the population from which you sample remains invariant when the population is changing with time:
[insert hand-waving here]
Furthermore, with any time-series with a positive trend (as with global temperature), the global mean and standard deviation will both increase with time. Therefore, even if CLT applied, the increasing values would work against the attempt at reducing the uncertainty.
I see I got a down-vote for this comment. But whoever is responsible (is that you bigoilblob?) provided a “fact free” vote. No rebuttal other than an implied, “I don’t like what you say.” Rather typical of those who ‘de-nye’ that Nature could have any role in the changing climate.
If most of the warming occurred without any significant rise in CO2, that proves one of two things.
1) most of the warming had nothing to do with CO2, in which case the NULL hypothesis would be that most of the warming since then also had nothing to do with CO2.
2) CO2 is absolutely played out as a driver of temperature.
Where exactly did world wide burning of fossil fuels start in 1750? Wood doesn’t count or it would count today!
Loydo must be a recent product of British miseducation, in which teaching the history of the Industrial Revolution is racist, sexist, cisheteropatriarchal, colonialist and imperialist.
Watt’s steam engine was first sold commercially in 1776,then steadily improved. Coal-burning before then was minimal. Although more primitive engines did exist, none was ever widely adopted.
The first stage of the IR from c. 1760 was water-powered.
Another splendidly learned and apposite comment from John Tillman. Loydo knows the Party Line and faithfully regurgitates it here, but he is obviously unaware that IPCC dates the industrial era from 1850, the date on which the first global temperature record began, because before that date there was too little anthropogenic influence to be significant.
Before 1930 there wasn’t sufficient burning of fossil fuels to have any worldwide impact.
People tend to forget that neither China nor India nor big parts of Europe and the United States had any electricity or cars. Using coal for heating and cooking was already the biggest contribution.
Did you not get his reference to “land clearing”?
That both produces CO2 and reduces the volume of it’s sink, which did cause Atmos CO2 to rise (v slowly) from ~ 1750
So what?
That’s what.
Exactly. And with the land clearing came crops, grass, plantations, etc, etc. All which use CO2. Loydo must think the land turns to desert when cleared
Loydo must think = oxymoron
Moreover global pop in 1750 was~750 million, 10% of todays, and 80% of these were subsistence third world preindustry, depending on mainly human labor. industrial activity today must be several hundred times greater per capita. The unquestioning faithful have no sense of scale and proportion. At that time. CO2 was probably still declining from LIA solution in colder oceans. Easily led and enthralled by asterisked PhDs, MSM, UN, lysenkoist polar bear boffins, the defenders of the consensus screed believe the climate was boringly flat and calm with a preindustrial atmospheric content of 280ppm for eons.
Absolutely right, not only was there not sufficient industry and technology distributed to have a recognizable per capita effect prior to 1930 but there were also way less people to count to the per capita.
Having a small per capita number multiplied by way less people than today results in even less impact.
Actually we’ve only passed about 1.0C with no proof that any of it was caused by CO2.
BTW, where the heck is this accelerated warming.
When you manipulate the data, you can create any acceleration you want.
“Accelerated warming” occurred c. 1910 to 1940. CliSciFi liars use years prior and subsequent to hide that warming, which is of the same magnitude as the late 20th Century trend that so frightens the politicians. You can’t stampede the sheep unless they are ignorant of history. The same sort of trick that Mann used to solidify a trillion dollar CliSciFi industry.
This continues to astound me. Monckton has taken their own assumptions and equations and shown how completely wrong they are. The fact this has evaded peer review for years shows climate science is garbage.
Evaded peer review or been given a nod?
I think with such an over-complicated field like this, a follow-the-crowd attitude is valuable to self preservation. Climatology has shown itself to be built on bad data (Frank) hand waved into consistency with the central limit theorem and then put into models replete with theory error. But since none of these errors are the exact speciality of the participants, it gets by.
Climate science is as meaningful as environmental science.
Does that include, ecology, zoology, botany, biology etc etc
In most of those other fields, you don’t consider modeled numbers and interpolated data sets to be evidence. In chemistry, you don’t ignore uncertainty by just waving it away.
Captain Climate is right: the history of peer review for our paper is scandalous. I have already discussed it with a senior police contact. He is waiting for me to attract just one more rejection which, in the opinion of my distinguished co-authors, is not a sound, scientific or justifiable rejection, whereupon he will pass the file to the fraud squad and to Interpol, which is now investigating the climate scam.
Can we get some politicians to start interrogating the IPCC about the “error correction process?” It clearly doesn’t exist. Let’s get them under oath to pursue themselves.
Really, it isn’t, is it? The fraud squad? Interpol? Pull the other one!
Are you new around here? His Lordship throws out threats of legal action every couple of years. They never achieve anything (other than free entertainment).
“By this letter I give notice that, subject to anything you may say within the next seven days, I propose to report you for fraud to the prosecuting authorities in the United Kingdom, where your press release has been widely circulated, in the United States, where you perpetrated your fraud, and internationally to Interpol. I wrote yesterday to the Chancellor of your institution, drawing his attention to the lies and misrepresentations in your press release and inviting him to withdraw it.”
https://wattsupwiththat.com/2019/08/17/the-nature-communications-hate-list-a-fast-moving-story/
John:
Yes, there is a full rap-sheet for our so, so, polite snake-oil salesman …
https://bbickmore.wordpress.com/lord-moncktons-rap-sheet/
Please can you respond to the “Misrepresenting Scientific Literature” part, me lordship.
As that is something that people have verified and can verify your lies (not that most denizens will because that’s why you, err, “misrepresent” the science) — they will lap it up uncritically.
eg Peter Hadfield – who you so nobly absented from responding to when Anthony gave you the opportunity here.
Poor Mr Banton, steeped in Communism, resorts as ever to mere yah-boo, repeating the reputational assaults of the pipsqueak Bickmore and the sneering Hadfield, neither of whom is fit to lick my snakeskin cowboy boots.
He is, of course, wholly unable to produce any credible scientific argument against the head posting. So, just like the Desinformatsiya Directorate under Pacepa, or the Reichspropagandaamt under Goebbels, he attacks the man rather than the argument.
You really are pathetic milord.
Childish ad nom again.
actually I voted Brexit.
Did you?
A response to my stating that you are lying about the Wu, Hu et al paper please m’lord
Oh and do please include your usual childish ad-homs
It seems that you have a compulsion.
We continue to be in correspondence with Nature Communications. In due course, a resolution will be reached.
Pull the other one.
It is not a criminal offence to reject a paper in peer-review.
just blowing smoke as usual.
Monckton surely has you on a leash.
Jump!
Jump!
Another un self-aware denizen
He is showing himself for what he is.
And the longer he does the more my motive is realised.
I of course, knew he would never admit fault.
Not in his psyche
Mr Banton, by now in full panic mode as he sees the edifice of climate-Communist nonsense tumbling about his ears, desperately avers that it is not a criminal offence to reject a paper in peer review.
Well, we have already consulted a very senior police contact about that. And his advice, on hearing of the shenanigans to which so many of us are subjected by the gatekeepers of climate Communism in the journals, was that in addition to the two improper rejections we have received to date we should obtain one more. That, he said would establish a pattern of fraudulent behaviour across several journals, and would definitely arouse the interest both of the Serious Fraud Office in the UK and Interpol.
He was particularly intrigued when I told him that the latter of the two rejections was based on the objections of two reviewers, all of whose objections we were able to rebut to the entire satisfaction of the editor. However, his fellow-editors would not allow him to publish this or any such paper questioning the Party Line.
His eyebrows shot upward when I told him what one of the reviewers had said: “I find the conclusions of this paper uncongenial. Therefore, I have not read the arguments that justify the conclusions.” And that was the entire review.
The element of fraud arises in several respects. First, journals of repute hold themselves out as conducting themselves properly and publishing sound science, which implies that the peer review process will be competent and fair.
Secondly, if there is indeed no likeliehood of warming fast enough to be dangerous in net terms, then an apparent conspiracy on the part of the climate-science community to prevent publication of a paper devastating to the Party Line would raise questions about whether these rejections are part of a far wider global climate-change fraud of the sort that Interpol are currently investigating.
Mr Banton, like any climate Communist, is of course free to make up his own opinions on what is and is not fraudulent without doing even the minimum of research. By now he will perhaps be beginning to realize that I do not make the allegations of fraud lightly. I have sent people to prison for fraud before, so I know the game. The evidence is piling up, and, in due course, if we are rejected a third time without what seems to my co-authors to be legitimate justification, our police contact has already assured us that considerable interest will be taken in our allegations, which will be carefully investigated.
“Mr Banton, like any climate Communist”
Another Monckton classic.
Oft repeated in this thread – because I dare to challenge him, on this otherwise echo-chamber to his ilk.
You cant be anything other than a right-on chap to understand climate science.
As I’ve said elsewhere on this thread.
I voted for BREXIT
Did you?
Tiny childish minded of course but the privileged classes can have different standards.
To you and I they are called hypocrites.
Climate Communists routinely use reputational assault in the hope of silencing all dissent as the scientific case for their Party Line crumbles. Very nearly all of Mr Banton’s posts here have taken the form of reputational assaults. since Mr Banton uses climate-Communist methods, then he is like any climate Communist.
Mr Banton has made no significant scientific contribution to this discussion, inferentially because he is not competent to do so. I, on the other hand, have a team of more than usually competent scientists at my back. So Mr Banton’s rebarbatively repetitive whining that I don’t have the right pieces of paper to indicate that I have received appropriate Socialist training in the relevant scientific disciplines rather misses the target.
The argument we are presenting is an argument in that branch of formal logic known as Socratic elenchus, which I first studied at Cambridge. It allows rational conclusions to be reached by obtaining the agreement of one’s interlocutor to propositions to which the interlocutor cannot legitimately object, and then drawing from those propositions conclusions that those propositions logically entail – conclusions that contradict the interlocutor’s original proposition.
And I have made a handsome fortune out of mathematics – the language of all the physical sciences. But what is relevant here is that my team has found and exposed the fundamental error of physics underlying climatology’s over-predictions of global warming. That fact may be an annoyance to Mr Banton, but it is a fact. Climatologists screwed up when they borrowed feedback formulism from control theory, a branch of engineering physics with which they were insufficiently familiar.
Of course, on my team we have the benefit of a more than usually talented Professor of Control Theory, who, like many of us, has been viciously attacked by his own university for putting his name to our paper showing what nonsense the Party Line is. But he has refused to buckle, and is gallantly facing down not only the principal of his university but also his nation’s government. And he will win.
The suppression of academic freedom of thought, speech, research, inquiry and publication is intolerable and, in due course, several free nations, motivated by the climate-Communists’ attempts to shut down debate on the global warming question, will enact laws to guarantee academic freedom.
Griff speaks, as usual, from ignorance, malice and Communism – a nasty mixture. The police are indeed now taking an interest in the climate scam, for one of the advantages of our result is that, notwithstanding the attempts by certain trolls here at misdirection, it is actually simple. What is more, Interpol has had a climate-change fraud division actively investigating various fraudulent aspects of the global-warming scam for some years – and I give nothing away when I say that the division has not, hitherto at any rate, had occasion to investigate climate skeptics.
The noose is drawing ever tighter around the necks of the climate Communists.
griff, what we really want to hear from you is an answer BobM’s question that you keep ignoring.
Would you prefer living in 1700 to 1775 when CO2 was so benign, or this terrible time of “dangerous” CO2, 1950-2025?
But maybe in light of Loydo’s contribution, we should adjust that time of utopia back to 1675 to 1750. I think that you really would have enjoyed the 1690s.
We, much of his story hinges on his assumption that the feedback works not on the elevation from equilibrium, but from the absolute temperature and there is no justification for his unique approach.
To me this sounds like saying that you have to include the weight of the earth when you calculate lifitng with a lever, because you are pushing against it….
Feedback response is a result of the total signal, not just the change.
Hurrah!
Consider that you have a poorly regulated, or noisy power supply. If the absolute variance is 1 volt, that is tolerable for most applications running off 115V AC mains. However, if it is driving a solid-state device, it might well be destructive. Therefore, looking at just the change from the nominal value doesn’t give one the whole picture.
What exactly do the climatologists mean by “feedback”,“negative feedback”,“positive feedback”, “feedback response”, etc.? I have been struggling mightily to figure the terminology out and keep coming up short.
In response to Monte Carlo, it is exasperating that there is no standard terminology to describe the various inputs to, elements of and outputs from the feedback amplifier in control theory.
In the climate, a feedback, denominated in Watts per square meter per Kelvin, is a knock-on, additional forcing driven by a direct warming of the climate, or by emission temperature itself. The chief feedback process is water-vapor feedback, for the space occupied by the atmosphere may hold near-exponentially more water vapor as it warms. All other feedbacks broadly self-cancel.
Feedback response is an additional warming engendered by and proportional to the direct warming to which the feedback processes in the climate are responding. It is the difference between the reference signal and the output signal.
Positive feedback amplifies the original temperature or warming; negative feedback attenuates it.
The base signal, in climate, is the 255 K emission temperature.
The perturbation signal is the 8.5 K direct warming by natural (7.6 K) and anthropogenic (0.9 K) greenhouse gases.
The reference signal is the sum of the base signal and the perturbation signal.
The output signal, in climate, is equilibrium temperature or sensitivity, the sum of the reference signal and the feedback response.
The feedback fraction, or closed-loop gain factor, is the fraction of the output signal that is represented by feedback response.
The system-gain factor is the ratio of the output signal to the reference signal. It is the quantity by which the reference signal is multiplied to yield the output signal.
The unit feedback response is 1 less than the system-gain factor. It is the feedback response per degree of the reference signal: i.e, the ratio of the feedback response to the reference signal.
Hope that helps!
Thank you very much! I shall copy this and save it.
I defer to Christopher’s explanation.
I cannot imagine that a basic solid state device like a block of silica would be impacted much by either votlage, but your little thought experiment seems to hinge on the fact that the elevation from equilibrium is 110V for that device you trying to roast.
Anecdotally, I once worked with a guy who had a company laptop. When he was fired, they asked for the laptop back. He obliged, but not before apparently applying 115V to one or more of the interface ports.
The important thing is that most devices have a voltage tolerance that is best expressed as a percentage of the nominal input. The absolute over-voltage tolerated by a high-voltage device would almost certainly fry a low-voltage device, unless heavily protected.
Laws of Nature is not, perhaps, familiar with control theory. To neglect the fact – and it is a fact – that any feedback processes in a dynamical system will respond not only to perturbations of the base signal but also to the base signal itself is to perpetuate and to perpetuate climatology’s error.
So, even were that true.
you’re not m’lord
quals in Journalism and the Classics.
LOL
Mr Banton rebarbatively and tediously repeats his ad hom about my apparent lack of pieces of paper to indicate that I have received sufficient Socialist training in relevant subjects. Yet again, he neglects the fact that the result outlined in the head posting is described there not as my result but as our result. At my back I have a team of eminently-qualified specialists who are content to work with me, notwithstanding my apparent lack of Socialist pieces of paper, because, having studied Classical mathematics and architecture, as well as logic, at Cambridge, I bring to the table an ability to marshal a rational argument by Socratic elenchus.
In that team there are tenured professors of climatology and of control theory, as well as environmental and electricity-grid specialists, control engineers and programmers. If Mr Banton can do no better than ignore the qualifications and long experience of my team, then perhaps it would be better if he were to fall silent. He is adding nothing of value here.
Of course, one understands that our result is a mortal threat to his superstitious faith in the climate-Communist Party line. But the Party line is simply flat-out wrong, and he’d better get used to it. Screaming about my qualifications won’t alter the facts he now faces.
“Mr Banton rebarbatively and tediously repeats his ad hom about my apparent lack of pieces of paper to indicate that I have received sufficient Socialist training in relevant subjects. “
QED
Yes of course you have m’lord.
I’ll take you “word” for it.
Because that is all we have eh?
It’s plainly apparent you do not speak with fork tongue (sarc)
“Socialist training”.
ergo no scientist can ever be correct.
Ergo it can never be allowed to ABCD.
Any scientific point to make? No, seems not. Don’t whine.
Your assumptions about my person are entirely irrelevant for this discussion, you seem to follow the climatologists approach of ad hominem attacks when wrong.
You need to justify your assumption that the “base signal” would have anything to do with absolute temperature instead of the elevation from equilibrium. As you pointed out climate scientist use additional warming from anthropogenic CO2 as signal (multiplied by feedback), which has nothing whatsoever to do with absolute zero, no place in the atmosphere is anywhere within 200K from that making your calculation absurd.
Also, there are also some basic physics facts in the way of your little model, not only you will not have any atmosphere below 70K or much water vapor feedback below 270K.
I had merely made the mild observation that Laws of Nature was not, perhaps, familiar with control theory. From his present answer, I should venture to suggest that he might benefit from reading some of the textbooks on the subject.
Let me explain (again) that the calculations in the head posting relate to today’s temperature, and not to what might have happened at zero K or 70 K or 270 K.
Today’s temperature is 288.5 K. Emission temperature is 255 K or thereby. The 33.5 K difference between these two is the total greenhouse effect. Of that 33.5 K, 8.5 K is direct warming by greenhouse gases and the remaining 25 K is feedback response.
But feedback response to what? Climatology says the 25 feedback response is feedback response solely to the 8.5 K direct warming by greenhouse gases. Control theory says the 25 K feedback response is response to the 263.5 K reference signal: the sum of the 255 K emission temperature and the 8.5 K direct warming by greenhouse gases.
Why is this? Because feedback processes are inanimate. They cannot distinguish between one Kelvin and another. They cannot say to themselves, “I won’t respond to the first 255 K of today’s temperature, but I’ll respond excessively to the 8.5 K direct warming by greenhouse gases.”
The unit feedback response (per Kelvin of the reference signal) is equal for each Kelvin of that signal. Therefore, the feedback response attributable to the 255 K emission temperature is 24.2 K; the feedback response attributable to the 8.5 K direct warming by greenhouse gases is 0.8 K; total 25 K. Since only 0.1 K of the feedback response to direct warming by greenhouse gases is attributable to us, one would not expect all that much more than 0.1 K feedback response to warming by doubled CO2 compared with today.
>> I had merely made the mild observation
I call bullshit on that one, there was no observation like htat to make it was a rather unqualified ad hominem against me!
Speaking of unqualified, you merely repeating your statement, that the feedback should include the whole range from absolute zero, but not give any reason for it.
Using the unit Kelvin is not a justification why the whole range and not the deviation from he radiation equilibrium should be used.
Do you agree that it is quite rediculous to assume a feedback process which affects the solar radiation?
We do not assume a feedback process that affects the solar radiation. Like it or not, there is a substantial feedback response that the solar radiation affects. Laws of Nature has fatally misunderstood the direction of causation.
At any given moment the feedback processes then present respond to the entire reference temperature. For they are inanimate. They cannot, as climatologists do, decide that they will respond only to the reference sensitivities to greenhouse gases, but that they will magically not respond to the 30-times-larger emission temperature.
To inanimate feedback processes, a Kelvin is a Kelvin is a Kelvin, regardless of its origin.
“I had merely made the mild observation that Laws of Nature was not, perhaps, familiar with control theory.”
And how would you know m’lord – as you have nothing with which to compare – you are no expert.
Unless we take your word for it.
No, why would anyone buy from this snake-oil salesman unless desperate?
Any scientific point to make? Thought not. So don’t whine.
>>Any scientific point to make?
Well do you? Repeating yourself over and over does not get you anywhere.
You just missed another opportunity to explain why the solar contribution to the Earth´s surface warming should get the feedback factor multiplied to it like your article suggests.
After all this nonsense, there is still no point.
Asked and answered supra. Feedbacks are inanimate. They respond equally to each Kelvin of the entire reference temperature at any given moment, and thus proportionately to the magnitudes of each of the components in that reference temperature.
The reason for using the 255 K emission temperature is that it exceeds 0 K by 255 K.
Perhaps Laws of Nature would like to explain how it is that the inanimate feedback processes in today’s climate know that they must respond vigorously to the direct warming by greenhouse gases but not at all to emission temperature.
Coming up with a single number for ECS/TCR is questionable. It appears that water vapor feedback is temperature dependent.
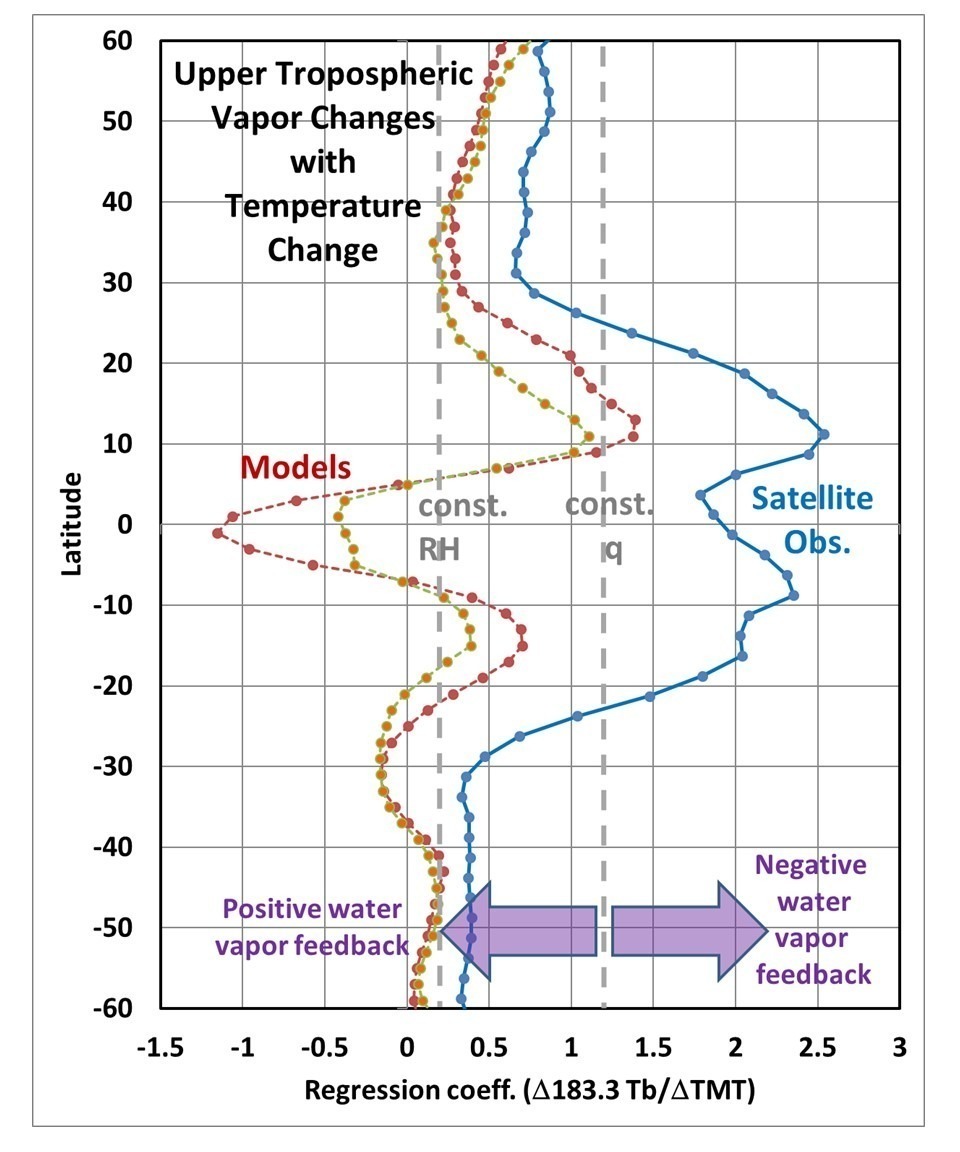
While this graph shows how the feedback varies with latitude, that is simply because the temperature varies with latitude. The same negative feedback no doubt occurs in summer even in the extratropics.
Note that the feedback in the graphic has nothing to do with CO2. That is yet another level of attribution. It simply shows water how vapor changes when the only real forcing is a temperature change.
It’s questionable of course but it doesn’t stop the IPCC and the entire climate field from quoting one.
My opinion: The whole problem that Lord Monckton describes correctly and comprehensively here can be explained even more simply. Temperature is an intensive property, a state description. Temperature acts as entity, acts as it is, in whole. Dividing an effect of a temperature into effects of different proportions of this temperature is physical crap. People die of fever because they die of the effects of 42°C on their body. He does not die from the consequences of 37°C plus the additional consequences of 5°C. The Lord likes to write that the climate fools have forgotten that the sun is shining. He’s correct. The fools ignore that temperature is an intensive property, a state description.
Actually, while the biochemistry has nothing in common to the radiative phenomena in the atmosphere, this seems an example of “feedback” processes getting triggered to bring the body back to equilibrium, the effort to recover from a disease is not related to the 37°C or 42°C, but just the 5°C.
Laws of Nature has completely missed the point. In any feedback-moderated dynamical system, such as the climate, any feedback processes that may be present at a given moment will, at that moment, respond to the entire reference signal, which, in climate at the present moment, is the sum of the 255 K emission temperature and the 8.5 K warming directly forced by natural (7.6 K) and anthropogenic (0.9 K) direct warming.
Therefore, at present, the feedback response to the 255 K emission temperature is 24.2 K, to the 7.6 K preindustrial warming 0.7 K, and to the anthropogenic warming 0.1 K.
It is of course possible to study the differential only: but, if one does so, one must at all times take account of the presence of the base signal – which, in climate is the 255 K emission temperature – a temperature 30 times greater than the 8.5 K direct warming by greenhouse gases.
“any feedback processes that may be present at a given moment will, at that moment, respond to the entire reference signal, which, in climate at the present moment, is the sum of the 255 K emission temperature”
as this temperature results almost exclusively from the incoming solar radiation, your feedback needs to alter the sun, otherwise your whole calculation gets obviously absurd.
May I suggest writing less about me and more about the facts?
Laws of Nature writes that, as the 255 K emission temperature “results almost exclusively from the incoming solar radiation”, the resulting feedback “needs to alter the Sun”.
OMG. LOL. Indeed, ROFLMAO. The feedbacks relevant to this discussion are temperature feedbacks. “Alter the Sun”, forsooth! The clue is in the name. Let us do it step by step.
Today, the Sun shines, and there are noncondensing greenhouse gases in the air. Before accounting for feedback response, the direct warming from the Sun is 255 K, and the direct warming by noncondensing greenhouse gases up to the present is about 8.5 K. The reference signal (i.e, the total temperature before adding any feedback response) is 263.5 K.
Now, that 263.5 K is more than enough to evaporate water. And it is in the evaporation of water that the chief feedback process is to be found. The water vapor is a greenhouse gas. By the Clausius-Clapeyron relation, the space occupied by the atmosphere may hold about 7% more water vapor per Kelvin of atmospheric temperature. Sure enough, in the near-surface boundary layer (though not higher up: there you will find one of the grosser physical errors in the models), the atmosphere does indeed hold more water vapor as it warms. The additional warming caused by the extra water vapor is the water-vapor feedback response.
Of course, there are various other feedbacks in play. But IPCC regards all of them except water vapor as approximately self-canceling at midrange. But all we need to know is that the total feedback response today is the 25 K difference between today’s 288.5 K global mean surface temperature and the 263.5 K reference signal.
Climatology imagines that the system-gain factor is the ratio of the 33.5 K total greenhouse effect to the 8.5 K emission temperature: i.e, about 4.
In reality, the system-gain factor is the ratio of today’s 288.5 K global mean surface temperature to the 263.5 K reference signal: i.e., less than 1.1. or, to put it another way, instead of 33.5 / 8.5, it is (255 + 33.5) / (255 + 8.5).
Climatology had indeed forgotten that the Sun is shining. Emission temperature calms down the system.
And Laws of Nature will notice that at no point in that calculation did we have to “alter the Sun”.
Firstly, this post seems to agree that a water vapor feedback process in a temperature range where there is no water evaporating makes no sense.
Yet that is exactly for a wide range of the numbers in your formula “(255 + 33.5) / (255 + 8.5)”!
What is missing in all your repititions is any argument why anyone should use such a formula given that equilibrium temperature is above 250K which you seem to acknowledge.
Does your feedback mechanism change the sun? No it doesnt!
Does it make thus any sense to multiply the feedback value over that part of the Earth temperature calculation? No it doesnt.
“OMG. LOL. Indeed, ROFLMAO.” seems to rather describe your wiggling in this thread repating yourself endlessly without any new arguments!
You are aware what Einstein said about repeating the same thing over and over again?
I think you simply repeated your aww “idea” about 10x between this article and your last, right?
I have patiently explained to Laws of Nature that the Sun is shining, that the fact of its shining has consequences in the fact of emission temperature and in the hitherto-ignored fact that emission temperature engenders its own substantial contribution to total feedback response, which climatology erroneously adds to, and miscounts as though it were part of, the actually minuscule feedback response to direct warming by greenhouse gases, and that none of these considerations in any way requires us to alter the Sun – which, in any event, we have no power to do.
>>have patiently explained to Laws of Nature that the Sun is shining
You have affirmed that, not explained, but it is a fog candle anyhow. Let´s agree the sun does it´s thing regardless what you write.
>> that emission temperature engenders its own substantial contribution to total feedback response
By which mechanism for the temperature range under 250K?
Surely not the water vapor climate scientists assume for their CO2 feedback.
>> climatology erroneously adds to
The climatology assumes a system is close to equilibrium, which you dont seem to dispute!?
In their view anthropogenic CO2 disturbs the system and this is therefore what you called “base signal” earlier (which is a term you made up and not found in signal theory).
Of course there are problems with that, mainly the assumption that anthropogenic CO2 is the only factor for the recent warming, but the signal theory is sound.
You can neither show a mechanism for the range you are using nor a justification why the sunshine as you call it should be multiplied with a feedback factor, the sunshine is pretty constant within reasonable bounds.
It does seem that Laws of nature is not merely misunderstanding the position, but wilfully misunderstanding it.
Our analysis is not concerned with what might have happened at any temperature other than a) the temperature in 1850; b) the temperature today; and c) what might happen at the temperature that would prevail after a direct further warming of about 1 K by doubled CO2 concentation compared with today.
Simplicitatis et brevitatis causa, let us look simply at the positiion today. The base signal is emission temperature. That is the temperature that woiuld prevail near the surface if there were no greenhouse gases in the air at all at the outset. The base signal, then, is 255 K.
There are two perturbation signals, 7.6 K direct warming by preindustrial noncondensing greenhouse gases and 0.9 K direct warming by anthrpogenic noncondensing greenhouse gases. The total reference signal today, then, is the sum of these three components: i.e., 263.5 K.
However, today’s surface temperature, which is close to equilibrium, is 288.5 K. The difference between the two values is 25 K. That is the total feedback response today.
Feedback processes are inanimate They cannot distinguish between a Kelvin that comes from emission temperature and a Kelvin that comes from warming by greenhouse gases. Therefore, today’s feedback responses are proportionate to the magnitudes of the components in today’s total reference temperature that engendered them.
255 K drives 24.2 K feedback response today; 7.6 K drives 0.7 K feedback response today; 0.9 K drives 0.1 K feedback response today.
None of these calculations depends, or in any way needs to depend, upon what might have happened at 0 Kelvin. That is simply an irrelevance.
If one wants to perform a differential calculation – such as working out what might happen if there were a further 1 K direct warming by doubled CO2, increasing the reference temperature to 264.5 K, one would still be required to take account of the entire reference temperature. But the feedback processes might produce slightly more feedback response – but probably not a lot more.
Since the anthropogenic feedback response is only 0.1 K to date, one might expect somewhere between 0.1 K and 0.2 K of additional feedback response to the 1 K direct warming by doubled CO2. But not much more than that.
Climatologists mistakenly define feedback as responding only to perturbations of emission temperature, and not also to emission temperature itself. That definition is inaccurate.
Likewise, they fail to take account of the feedback response to emission temperature, thereby in effect adding it to, and miscounting it as though it were part of, the actually small feedback response to direct warming by greenhouse gases.
“Dividing an effect of a temperature into effects of different proportions of this temperature is physical crap.”
So, again, who actually did that? Where and when?
Lord M spins these fables on the basis of his having read a Science paper by Lacis et al, 2010. But they don’t partition the temperature. They partition the forcing.
We are dealing with temperature feedbacks. Therefore, it is the temperatures that are relevant: the 255 K emission temperature (that value is explicitly mentioned in Lacis et al. op. cit.); the 33.5 K greenhouse effect (that value, or one very close to it, is also mentioned); and the directly-forced warmings by natural (7.6 K) and anthropogenic (0.9 K) greenhouse gases.
Climatology’s midrange current ECS of 3.9 K is consistent with the erroneous notion that all of the 25 K feedback response is attributable solely to the 8.5 K directly-forced greenhouse-gas warming: i.e., that the system-gain factor, the ratio of the entire 33.5 K greenhouse effect to the 8.5 K reference sensitivity to greenhouse-gas forcings, is about 100% / 25%, or 4. But it is actually (255 + 33.5) / (255 + 8), or less than 1.1.
“Therefore, it is the temperatures that are relevant”
So you make up something that Lacis is supposed to have said, because you think it is more relevant than what he did say. Lacis partitioned forcings, not temperature. And he was not calculating ECS.
Just for once, Mr Stokes should refrain from being snide. He is, perhaps, unfamiliar with climatology, and he may not realize that feedbacks are denominated in Watts per square meter per Kelvin of the reference temperature to which they respond, and that, therefore, it is better to do the calculation in Kelvin.
However, let us humor him by setting out the various radiative forcings. At emission temperature, the insolation is 1363.5 K and the albedo is 0.294. Therefore, the top-of-atmosphere radiative flux density (which would also be the surface flux density in the absence of greenhouse gases) is about 1363.5 (1 – 0.294) / 4, or 241 W/m^2. The forcing by preindustrial greenhouse gases is about 25.3 W/m^2, and the forcing by anthropogenic greenhouse gases is about 3.2 W/m^2.
Next, we need to know the present-day Planck sensitivity parameter given today’s 288.5 K global mean surface temperature, so that we can derive the radiative forcing corresponding to the 25 K total feedback response.
It is near enough equal to the reciprocal of the first derivative of the SB equation, namely 288.5 / [1363.5 (1 – 0.294)], or 0.3 Kelvin per Watt per square meter. Dividing 25 K by 0.3 K gives us the total present-day feedback forcing, which is about 83.3 Watts per square meter.
The total forcings that constitute the entire greenhouse effect expressed in Watts per square meter rather than in temperatures are thus 25.3 + 3.2 + 83.3, or 111.8 Watts per square meter. Of the total greenhouse effect, therefore, the feedback forcings constitute about 75%, just as Lacis said.
However, the system-gain factor they envision is well in excess of 3: for climatology’s predictions of global warming are consistent with the notion that the 25% of the greenhouse effect that represents direct warming by greenhouse gases drives the 75% that is feedback response.
“Just for once, Mr Stokes should refrain from being snide. “
LOL
You really are TOTALLY unself-aware.
Any scientific point to make? Thought not.
I am most grateful to Christoph Meyer for his kind support. The calming effect of taking proper account of the 255 K emission temperature makes it extremely unlikely that large warming will occur.
Dear Lord Monckton, the main problem of the climate fools with your table 2 is that these calculations, corrected for the emission temperature as an entity, are even closer to reality than their expensive computer models. It is impressive that you and your team have uncovered this mistake made by mainstream climatologists. Please stand firm. There are a lot of people out here who are excited about your commitment. And a correct physical calculation always prevails at some point. br, cerm
Many thanks to Christopher Meyer for his kind comments. We are persisting, and are, we hope, getting nearer to publication in a learned journal.
The problem starts way earlier than just with “feedbacks”. Also Prof. Lindzen is not perfectly right with the 271K no feedback surface temperature. There is a presentation where he shows how he gets to that number, but he obviously got the solar radius wrong..
https://www.youtube.com/watch?v=7jOD4CK8MSM&t=295s
(There he claims 272K, with solar radius = 659,900km, instead of 696,300km)
Let me show something way more revealing and simple, which is the hemispheric relfectivity of water:
Note: when a satellite looks straight down, it will only measure emissions to surface normal, represented by the blue line. Also it will be restricted to the atmospheric window at around 10µm. There the deviation from 0 is minimal, and accordingly, as emissivity = 1 – reflectivity, emissivity is very close to 1. That is why until now, “climate science” believes water was almost a perfect emitter.
In reality however spectral hemispheric emissivity of water is only 0.91, while spectral (hemispheric) absorptivity is 0.934, that is even higher. With this knowledge we can perfection what Prof. Lindzen attempted, at least with regard to the water surface of Earth. Assuming 342W/m2 of insolation, water would take on a temperature of..
((0.934/0.91)*342/5.67e-8)^0.25 = 280.5K
Again, that is only true for water. Yet it is true the atmosphere only adds about 8K to the surface temperature.
@E. Schaffer
Yes. The energy balance has to separated into an average 12 hour convective cycle and an average 24 hour LWIR emission cycle. The 12 hour averages for the solar flux are twice the static IPCC averages, i.e half of the the real 342W/m2.
Planck radiation is ‘nested’ like Russian dolls. How did you manage to separate them with your graph?
???
There is a scaling error in your graph. You should also point out that the yellow graph is incoming from the sun and the red is outgoing from the earth.
No, there is not. You probably think so, because you would expect a peak at around 10µm @288K. The problem is, this is a logarithmic scale and you have addept the curve to represent a proper distribution. It is the same issue you find if a wavenumber is used as a scale. In that case the planck curve will peak at around wavenumber 600, or 16.6µm.
Originally I did not adjust for the logarithmic scale and found it looked pretty odd, with the chart suggesting only minimal emissions in the far-IR.
Oh, and btw. it is all about illustrating how the respective reflectance must be weighted to calculate an according average.
Can I just say, the idea that the radiative balance of the Earth defines the global air temperature is pretty much lunacy. I realize the equilibrium has to be attained but the idea that a planet which is 70% sea water has an average air temperature that responds quickly to an increase in CO2 is silly.
Captain Climate is correct: the vast heat capacity of the ocean acts as a giant heat sink which tends to keep temperature near-unchanging. That is why it is at least statable that much of the warming of recent decades comes from below, not from above: i.e., it comes from magmatic intrusion along the mid-ocean divergence ridges, particularly in the el Nino regions 1-3.
The entire concept of radiative forcing is fraught with problems. Nothing is ever considered but the raw watts/m2. All energy is treated equal. But is it? Are SW solar photons the equivalent of LW CO2 photons? The former can penetrate deep into the oceans while the latter are absorbed right at the skin.
It’s like saying being hit by a 1000 nerf darts will kill you because they impart the same total energy as a single bullet.
There’s another way to look at the Earth that eliminates this problem. Include the skin of the surface as part of the atmosphere. The subsurface Earth then becomes the true measure of warming. When you do this thermodynamic separation you end up with a quite different result. The 3.5 w/m2 mentioned in this article goes away almost entirely. There’s almost no forcing left at all.
Yes. Other than water (which can’t really be ignored), the atmosphere is transparent to incoming radiation from the sun. That means the earth’s skin absorbs most of the energy and creates the outgoing radiation and conduction. It should be considered the “hot body” while the atmosphere is an insulating body between the skin and earth.
Why can water be ignored? Water has 4.2X the specific heat of air. Even if the top of the atmosphere is at equilibrium, a sudden exchange of heat from ocean to air will raise air temperature, without any change in what is incoming.
Just a question: K usually stands for degrees Kelvin, which is the temperature range manifested by a black body as its radiative temperature increases from 0K up to 27,000K. It was used in color photography to designate which film type was for daylight and which one was for artificial light, and is still referred to as color temperature. Filters were, over time, designed specifically to adjust film color temperature so that it wasn’t necessary to switch cameras or film, and then film emulsions were adjusted to do the same thing. This is still in use now in digital photography and in LED lighting manufacture.
Now, how do I know this? I spent 15 years doing photography, including two hitches in the Navy as a Photographer’s Mate 2nd class and it was on the test, which I passed on my first try in my 2nd year of AD. And I still spend a good portion of my time with a camera.
So is this use of “K” a reference to actual temperature in degrees Kelvin, or is it a reference to something else? Just asking, because I’m seeing it more and more and if it has to do with solar color temperature, which IS used in astronomy, partly to define the “type” of star being described, then that is a rather peculiar use of it. And a grand solar minimum is not going to change the Sun’s color temperature.
The Sun’s radiative temperature is about 5780K. The color temperature of sunlight above the atmosphere is 5900K. It is a very common yellow dwarf star. For comparison, Alpha Centauri’s color temperature is 5260K. The color temperature of Betelgeuse in Orion is 3500K.
Therefore, using “K” in regard to emissions temperature may have validity not explained here, but if it’s being used improperly its seems to be an attempt to throw off reality.
I’m just asking., It is an odd way to use something that has nothing to do with ambient temperatures.
That’s a good way to panic the uninformed.
https://www.bipm.org/documents/20126/41489682/SI-App2-kelvin.pdf/cd36cb68-3f00-05fd-339e-452df0b6215e
The kelvin is the SI temperature measurement in units of degrees C from absolute zero. Proper usage doesn’t say “degrees”, but just kelvins (K).
Named in honor of Lord Kelvin, who proposed it in 1848:
https://web.archive.org/web/20080201095927/http://zapatopi.net/kelvin/papers/on_an_absolute_thermometric_scale.html
In addition to John Tillman’s characteristically learned answer on the question of the definition of Kelvin, the measure of temperature in degrees absolute, I should add something about its relevance in discussing climate sensitivity.
To establish emission temperature, one uses the Stefan-Boltzmann equation, which states that radiative flux density at the emitting surface of a planetary body is equal to the product of the emissivity of that surface, the Stefan-Boltzmann constant and the fourth power of the temperature at that surface, measured in Kelvin.
To use Celsius degrees in the Stefan-Boltzmann equation, as one or two misguided climate scientists have done in the past, is to introduce a large error.
Since we are talking of the relative magnitudes of the components in present-day temperature, the use of Celsius degrees rather than degrees absolute, or Kelvin, would introduce another large error.
“is to introduce a large error” — a bit understated, it is a huge error.
Another problem: assuming irradiance (W/m2 or J/s/m2) equal energy (J). Irradiance falls as the inverse square of the distance from the source. The distance from the top of the atmosphere to the surface is much smaller than the distance from the sun to the earth so that irradiance can be considered constant.
However, other sources cannot be so considered, especially scattering, molecular radiation, and non-specular reflection. These are diffuse with light moving in all directions. Change the distance from a diffuse source and the irradiance (W/m2) changes a lot.
““is to introduce a large error” — a bit understated, it is a huge error.”
And as usual, you can’t get any details of who is supposed to have made it, or where. And no-one here is sceptical, because they like the sound of it.
Asked and answered upthread.
I don’t believe it is. Your assertion was
“To use Celsius degrees in the Stefan-Boltzmann equation, as one or two misguided climate scientists have done in the past, is to introduce a large error.”
Names please. Who did that? And where and when?
The usual make-believe. No facts at all.
Don’t whine. I’ve spared their blushes by not naming them. I prefer to keep it that way. Unlike the climate Communists, I’m not vindictive.
Yes, keep it fact-free
No, keep it to the point. The fact that one or two climate scientists have made the mistake of trying to put Celsius rather than Kelvin into the SB equation is peripheral to our case, so I see no need to name and shame those who have made that unfortunate error.
Monckton:
Are you really expecting that your blustering and disparaging of critics is likely to get you anywhere?
There is a noted absence of echoes from the chamber to your obfuscating verbiage.
Much more than is usual here.
Or is it just that you enjoy putting people down?
Persuasion by engagement is what make science.
Not lies and bald refusals and denials
But as we’ve established you are totally non self-aware.
And the relevant “social training” you say you have was severely lacking where people skills are concerned.
Mr Banton is, as usual, strikingly off the point. I had just replied to Mr Stokes that I was not prepared to name and shame those who had made an error peripheral to the present discussion and not even mentioned either in the head posting or in our paper, for they had made an error in good faith and I did not propose to do anything to harm their reputations.
Yet Mr Banton comes back and whines that I am “disparaging” people.
To those who participate civilly in these exchanges, I reply civilly. To those who, like Mr Banton, cannot resist playing the usual climate-Communist game of organized, persistent, petty reputational assault, I give as good as I get.
And o, how the climate Communists whine when they get – just now and again – a taste of their own unpleasant medicine.
There have, in fact, been several people here who have contributed sensibly, rationally and constructively to this thread. Mr Banton, alas, is not one of them. In fact, he has behaved so badly that he has been called out and warned by a moderator. Perhaps he should take heed, and confine all future remarks here to matters ad rem and not, as is his invariable and repellent current custom, ad hominem.
Keep it up. The “cancel culture” needs to be confronted at every turn and canceled themselves.
You are obviously a member of the cancel culture. Names, Names, Names! Let’s cancel the boobs that made a error! We simply can’t have those people making public statements anymore. They need to be shamed and removed from the public discourse.
Quit whining about stuff that doesn’t matter.
Bravissimo, Jim!
The old film boxes had a degree symbol after the Kelvin number. That’s an old habit with me, however bad it may be.
Geezo Pete, now I have to ask my sister to get a textbook on this at the university bookstore and send it to me. (Sara goes away, mumbling under her breath.)
All right, that all makes sense. Thanks very much to all of you for the feedback.
I like Sara’s pun.
Sorry, I can’t help it. It’s just too tempting…. 🙂
Lord Monckton,
I wish you all the best with your control system approach to constraining the value of the Earth’s climate sensitivity; it has the ring of truth to me as an electrical engineer. Your approach has much in common with the analysis of Dr. Roy Spencer in his book “The Great Global Warming Blunder”, Encounter Books, paperback edition 2012. In chapter 5 he analyses how the climate Establishment has been fooled into deducing a high feedback sensitivity to CO2. Spencer also observes that despite publishing his results in the scientific literature the Establishment has ignored his findings, which is entirely consistent with the political ends of the IPCC…
In fact, Spencer recalls at pages xix and 122 how Dr. Robert Watson, later of the IPCC, had told Spencer in the early 1990s that, following his (Watson’s) success with reducing ozone-depleting substances via the Montreal Protocol, his next goal would be to regulate humanity’s production of CO2. “There was no mention of investigating the science behind the claim that global warming was manmade – only a specific policy outcome that the IPCC was going to support.”
Thus we should not be surprised that the IPCC and its fellow travellers have not improved their ECS et al. estimates over the decades since to have done so would have required them to adopt the traditional scientific method which requires failed hypotheses to be rejected or modified when tested against Nature strictures – for Nature knowns no consensus; it is the sole arbiter.
Traditional science is ultimately self-correcting while post-normal science (as set out in, for example, Mike Hulme’s book, “Why We Disagree About Climate Change”, Cambridge, 2009) can bring all sorts of politicized mayhem. So there may yet be a long path to tread, but I wish you all the best with your endeavours. You will win out in the end, but not, I fear, before yet more damage has been done to the West in particular.
Regards,
John.
If you’re interested in Dr. Spencer’s view, you many want to read http://www.drroyspencer.com/2018/03/climate-f-words/.
Poor, crabbit, twisted, hate-filled Mr Born is beginning to realize that the debate – and our research – has moved on since several years ago. Dr Spencer had at first had two objections to our result. First, he had considered that we had assumed invariance of unit feedback response with surface temperature. However, our analysis using the energy-balance method (Gregory 2004, Lewis & Curry 2014) shows that what Mr Born calls the “local-slope” equilibrium sensitivity for 1850-2020 is near-identical to what he calls the “average-slope” equilibrium sensitivity derived by correcting climatology’s crass error.
However, Dr Spencer has subsequently told me that he now accepts that his objection on the ground that we had not accounted for possible variance of the unit feedback response with temperature had in fact been fully and satisfactorily addressed.
His second objection was that the models do not directly incorporate feedback formulism: feedback response is an emergent property following the solution of the Navier-Stokes equations in computational fluid dynamics across a succession of time-steps and in each of one or two million atmospheric cells each 100 x 100 x 1 km.
However, we are entirely unconcerned with the internals of the models (an approach which most climatologists find sacrilegious). For our correction of the apportionment of the total greenhouse effect is an external yardstick by which the equilibrium sensitivities predicted by the models are shown to be impossibly excessive. Dr Spencer now understands this, and accepts that we do not in any way suggest that the models incorporate feedback formulism directly.
Finally, though Dr Spencer is now satisfied on his original two points of objection, he remains as doubtful as all climatologists are about whether the Sun is capable of evaporating water and hence of triggering the water-vapor and related feedbacks.
However, on this point even Mr Born, reluctant though he is to accept the truth, has grudgingly had to admit that those who do not believe the Sun can evaporate water vapor and that, therefore, the very great majority of the entire 25 K feedback response in the climate is attributable to the emission temperature that would prevail without any greenhouse gases in the air at the outset, and that, therefore, climatology’s conclusion that the system-gain factor 4 is the ratio of the 33.5 K total greenhouse effect to the 8.5 K direct warming by greenhouse gases is flat-out wrong.
Mr Born, in his vicious and unprincipled determination to prove us wrong regardless of the truth, has failed to keep pace with events. His interventions are simply out of date. He is wasting his time – but he does serve as an interesting instance of the sullen, cornered-rat intransigence of the climate Communist whose belief system is collapsing about his ears.
Funny how none of the heavy hitters whose names Lord Monckton likes to drop ever makes his endorsement public. Could the real truth actually be that several have privately tried to enlighten him and found the attempt futile? I can’t be sure, of course, but to me it appears that most of them think he’s off the rails.
Please, WUWT denizens, don’t waste your time on Lord Monckton’s innumeracy. Direct your attention instead to, say, Steven E. Koonin’s latest book.
https://naptownnumbers.substack.com/p/sen-braun-book-part-1
Poor Mr Born. Let us pray for him. We do not seek “endorsements”. We quietly continue our researches, and we hope that in due course they will be published for all to see.
Mr Born continues, most unwisely, to attempt to criticize a a paper that he has not seen. And he now, still more unwisely, says that some unspecified “heavy hitters” whom I have mentioned have not made their “endorsement” public.
One understands that his unreasoning hatred leads him to make stuff up. But it would be better if he would realize that he is a long way out of his depth here, and swimming alone, whereas I have a substantial team of eminent scientists behind me.
If our result were indeed as absurd as he is increasingly desperate to suggest, then it would not have been in the hands of the editor of a leading learned journal for more than seven months. It would have been thrown back at us long ago. It has not been. Mr Born, therefore, if he does not wish to look even sillier and even more malicious than he does now, may wish either to produce some proper scientific arguments or take refuge in holy silence.
“Could the real truth actually be that several have privately tried to enlighten him and found the attempt futile? I can’t be sure, of course, but to me it appears that most of them think he’s off the rails.”
Sounds about right Joe.
Unless you give him hugs ‘n’ kisses, then m’lord doesn’t want to know.
The absolute height of scientific discourse – to piss-off anyone who has the temerity to disagree with you – because of course you must be ….
”… steeped in Communism, resorts as ever to mere yah-boo, repeating the reputational assaults of the pipsqueak Bickmore and the sneering Hadfield, neither of whom is fit to lick my snakeskin cowboy boots.”
As though, automatically any science other than his own version is instantly dismissed as coming from lesser Humans.
What a nice aristocratic gentleman.
Oh, and I forgot – an expert in the classics and with a degree in journalism…..
but not science.
well I never
who’d have thunk it
LOL
And, as so often with the climate Communists, an argumentum ad hominem rather than ad rem. Banton, like the small number of other trolls here who are handsomely paid to disrupt these threads and are beginning to realize they aren’t going to get paid for that for very much longer, keeps on acting and driveling on the assumption that our result is my result and that, therefore, because I do not have a piece of paper to say I have received appropriate Socialist training in the relevant scientific disciplines, our result must be incorrect.
I have a distinguished team behind me, and between them they hold the relevant pieces of paper.
So, let puir wee Banton blub. Pass him a nice, soft hanky, someone, and put him on the list for a violin to accompany his whining.
Come on, mate, raise your game! You can surely do better than fall back on logical fallacies 2400 years old?
More yah-boo from the terrified, cringing Banton. No discernible scientific contribution. O how the climate Communist wail when one gives them a taste of their own reputational-assault medicine.
May I refer you to my original contribution m’lord.
The one that you so wilfully ignore in or to come back here and say ….”No discernible scientific contribution”
Couldn’t make it up. The snow is black Mr Banton – FFS
Monckton:

Fig 4 from Wu,Hu et al ….
“Mr Stokes is, as usual, wrong.”
No he isn’t.
You again double down on your snake-oil selling.
Fig 4 above that Nick Stokes posted up (and you didn’t in this article or the one in June – I wonder why?) and which verifies clearly what Nick is stating on behalf of Wu, Hu et al.
The dotted curves at the botton, partitioning CO2, PDV and AMV – the “changes” (AKA variations) result over the period to a mean Zero sum.
See the RH scale of INDIVIDUAL CONTRIBUTION Deg C to the overall warming.
What does it show on the extreme right?
Do you see they are at ~ 0.0.
Where is the CO2 contribution at extreme right?: ~0.75C
And what does that mean?
That the variations in contributions through the whole time period are ENTIRELY made up of those of CO2.
If the period had ended in 1940 then non-CO2 drivers would have contributed ~0.65C.
But it doesn’t.
So what Wu. Hu et al and Nick Stokes is saying is that the CHANGES through the period can be partitioned into 30% to AMV/PDV and 70% to CO2
But WARMING at the end of the period is 100% due to CO2.
Cyclic PDV/AMV variations have zero sum.
From Wu, Hu et al …..
https://www.nature.com/articles/s41612-019-0075-7
“both AMV and PDV play a significant role in modulating global mean and regional SAT changes in the past a century-and-a-half.”
(What does “modulating” mean?)
“Overall, the AMV contributes significantly to the global mean SAT TRANSIENT CHANGES on multidecadal timescale, however, the contributions of PDV and AMV to global mean SAT have similar magnitudes on decadal timescales with the PDV leading AMV in most parts of the 20th century. Moreover, when PDV and AMV are in-phase, the contribution of NATURAL CLIMATE VARIABILITY to global and regional climate can be significantly larger than that from GHGs, but an out-of-phase change of PDV and AMV could minimize their contribution to global and regional climate. As the GHGs increase further, our study shows a declined influence of the PDV and AMV to global and regional climate relative to that of GHGs.
(my caps)
(What does “transient changes” mean?)
(What does “natural climate variability mean”?).
Now a repeat of your snake-oil selling spiel is not sufficient – except to the non-sceptical “sceptics” here eager to purchase a bottle.
Answer my questions please.
Failing that just post some ad hom of me that seems to suffice for you when you can’t wriggle any further.
Post it 5 or 6 more times, please…
Mr Banton may care to look at Table 2 of Wu et al, where the contributions to warming by greenhouse gases and the naturally-driven residuals are separately quantified, for various periods.
In any event, Wu et al. is about to be superseded by a paper looking at the role of solar variability in more detail, and confining the temperature analysis to stations uncontaminated by the urban heat-island effect. That paper concludes that only half of the warming of recent decades was anthropogenic.
We are imminently awaiting the publication of that paper (which has already been accepted), whereupon we shall update our own research accordingly.
MoB said the same thing regarding Wu et al. 2019 in a response to me down below. I pointed out that MoB misinterpreted the publication. And now I’m reading through the comments and I noticed that I’m not the only one who noticed the mistake. Apparently you and Nick beat me to the punch. That publication definitely does not say that the anthropogenic contribution is 70%. I will say that in MoB’s defense that the publication is pretty thick and that a lot of people probably gloss over it and only look at the figures/tables without understanding what it actually means. Though, the counter argument to that is that figure 4 makes it abundantly clear that the cumulative natural contribution is close to 0% so I don’t know.
As far as I can make it out, for I guess that the drafting author’s first language was not English, the paper is considering two things: one, dealt with in Fig. 4, is temperature variability, and the other, dealt with in Table 2, is temperature change.
Table 2 shows the CO2-equivalent component, and a residual, as well as contributions from Pacific and Atlantic decadal variabilities.
And the conclusion plainly states that 70% of the global mean surface air temperature changes, not just variabilities, is anthropogenic.
I shall have to make further enquiries.
Table 2 says the natural contribution is -4% leaving the possibility that the anthropogenic contribution could be as high as 104%.
As I have said, I am not sure it is appropriate to add the period slopes. I shall make further enquiries. In any event, the point is moot, for a new paper with more up-to-date information, putting the anthropogenic contribution at more like 50%, is to be published shortly.
Table 2 says the same thing as Fig 4. In the third column, it breaks the trend into various time periods. All the components are positive. Warming all the way.
In cols 5-6 it does the same with AMV and PDV components. They are of varying sign. They are in fact just linearised chunks of the corresponding curve in Fig 4, They provide change, but with the varying sign, no net warming.
What, then, are the rather large “residuals”? Though the paper says that some part of the residuals is CO2-equivalent warming, most of the residuals seem not to be.
And the conclusion of the paper does not say that 30% of the variability in the climate is natural; it says that 30% of the changes in global mean surface temperature are natural. Temperature change and temperature variability are clean different things.
Just seen this….
Monckton: people who expose frauds and liars are most certainly welcome to “lick my cowboy boots”.
That you are that, and then say this is just further confirmation for the devotees here of your character.
For those that dare challenge their confirmation bias, may I present the debunking of Monckton by Peter Hadfield (aka Potholer54).
This by direct referral to the papers he lies about, as he lies about them …..
https://www.youtube.com/watch?v=PTY3FnsFZ7Q
https://www.youtube.com/watch?v=C3giRaGNTMA
Here is a graph of the sun’s radiation. Please note how much of the sun’s energy that H2O absorbs. It is obvious that the sun can evaporate water into water vapor.
I am most grateful to Mr Cullen for his kind comments. We shall continue to refine, present and discuss our research until either it is published and made formally available thereby to the wider scientific community or it is refuted by a legitimate counter-argument. The truth will prevail.
Climate Communism has made a strategic error by betting the farm on the ludicrous notion of large and dangerous anthropogenic global warming, when it did not know what it was talking about. It is now about to be exposed. How long it will take from the world to wake up from the propaganda nonsenses is not clear, but, in the end, everyone will laugh at the climate Communists for the sheer absurdity and fatuity of their pseudo-science.
Christopher,
Why do you not include water vapor in your analysis? I know that the alarmists dismiss its importance with the rationalization that it precipitates out, but it is continually being replenished by by evaporation and transpiration, thus maintaining a presence in the air.
The head posting explains that either the Sun can evaporate water or it cannot. We say it can. At midrange, all feedbacks other than the water-vapor feedback self-cancel (IPCC 2013, p. 813). Therefore, in net terms all of the 25 K total feedback response in the climate system is water-vapor feedback.
Our analysis shows that 24.2 K of that 25 K feedback response arises from the 255 K emission temperature, 0.7 K arises from direct warming forced by preindustrial noncondensing greenhouse gases, and only 0.1 K arises from direct warming by anthropogenic noncondensing greenhouse gases.
Accordingly, the influence of water-vapor feedback is central to our analysis.
I was initially puzzled by what appeared to be an omission of water vapor.
However (speaking casually), while many discussions of global warming talk about delta CO2 leading to delta T, leading to delta water vapor (because warmer air can hold more water vapor), which leads to an additional increase in temperature. This knock on effect is referred to as feedback, but it’s really more of a delta feedback. Lord Moncton prefers to treat all of water vapor as part of the feedback which I think makes a lot of sense.
Mr Philbrick is correct. In fact, climatology draws a clear distinction between the condensing greenhouse gas, water vapor, and the noncondensing greenhouse gases. Changes in the concentration of the latter are direct forcings; changes in the burden of the former are water-vapor feedback.
I like Willis Eschenbach’s line. We should be studying the remarkable fact that the climate seems to tend towards equilibrium. Why? More research is needed, you gubmint scientists.
Back in the day, on very small computers, I used to create computer models to help with computer control systems. The computer models were always advisory. Because, as Herod said to Claudius in <i>I, Claudius</i>: “trust no one.” Not even computer models.
Lord Monckton,
As usual I really enjoy your articles, they are generally well thought out and quite readable. I just wish some of the Universities studying climate would take this seriously and either support or refute your hypothesis in the usual scientific manner.
I have a couple of comments on Climate Science: the starting point of 240 to 270 K emission point is a ridiculous range to have to base a projection into the future on. If we can’t even get more accurate with our starting points, what good is the prediction forward. One has to assume the end-point will have at least as much error as the starting point in it…so 12% to 13%? And if we were to use a iterative model to produce the prediction then the only given is that the error grows on every iteration. How can anyone not see this?
“We have also allowed for a 10% uncertainty…”
There is one large uncertainty after another – why is anyone trying to predict a future state when there are multiple 10%-Plus uncertainties involved? It seems trying to reduce these uncertainties would be more productive and important to the Climate Science community. They seem more interested in getting the answer they expect and desire then in resolving the uncertainties.
Thanks for this article. I hope it gets to the right people.
I am most grateful to Robert of Texas for his kind, constructive and interesting comment. As to the uncertainties, science is very seldom capable of being exact. How long is a piece of string, for instance? That depends on whether the string is taut or slack, wet or dry, and whether the yardstick is accurate, and all manner of other chaoticities and stochasticities.
Therefore, science is all about the constraint of uncertainties. What is surely striking about our result is that it does not matter whether emission temperature is 240 K or 270 K or anything in between, and it does not matter whether the greenhouse-gas forcings are 10% above or below the midrange or anywhere in between. Precisely because the 255 K (or thereby) emission temperature is 30 times larger than the 8.5 K direct warming by greenhouse gases, equilibrium sensitivity as derived by the corrected apportionment of the total greenhouse effect is near-totally insensitive to these uncertainties. The answer is 1.1-1.2 K.
Similarly, when we calculated ECS by an entirely distinct method – the energy-budget method – we allowed for uncertainties in the five parameters from which it is calculated, and found ECS was 1.1 [0.8,1.4] K. Here, the interval is a little larger than before because there are more variables and more uncertainties. But the entire interval is below the lower bound of all the various official predictions of global warming.
In a scientific paper such as that which we have prepared and is now under review, it is always desirable to take proper account of the underlying uncertainties in the data. Some of those uncertainties cannot themselves be constrained. For instance, emission temperature cannot be measured directly, because there are greenhouse gases in the air. So scientists do their best to make a stab at calculating it, using the Stefan-Boltzmann equation, and the solar irradiance, and the planetary albedo, and the emissivity. All of these quantities are subject to considerable uncertainty.
The bottom line is that, even if one takes proper account of the data uncertainties, it is clear that future global warming will be, as it has been in the past 30 years, about a third to a quarter of climatologists’ midrange predictions. And that’s the main point.
I am always amazed at how many people, scientists included, think that the error of the sample mean provides an uncertainty close to zero when averaging measurements. They don’t have any metrology training yet feel they are experts at assessing uncertainties.
Mr Gorman is right. What is worse, climate scientists have no training in control theory, no training in statistics (think hokey-stick) and, worst of all, no training in logic.
Therefore, the unit feedback response is not 25 / 8.5, or ~3, as climate scientists imagine. It is 25 / (255 + 8.5), or less than 0.1. Their implicit midrange unit feedback response is overstated by a factor 30.
==============
correct. This is the meat of the problem. The feedback on a steering wheel it not calculated relative to its current position. It is relative to the neutral (0) position.
However, for the same reason that humans are poor at proofreading, it is very difficult for an established climate scientist to undo years of training and recognize a basic flaw in theory.
My personal experience with this was as captain on 40 foot sailboat across the Pacific. The rudder had a trim tab, which could be used to steer the much larger and heavier rudder, which would then steer the boat.

Above is a picture of the mechanical feedback device. A couple of crossed stainless wire cables forming an “X”. The gain was determined by the relative size of the X facing fore and aft. The fore end of the X was attached to a small auxiliary tiller. The aft end was attached to the trim tab shaft.
You can see a very small autopilot ram attached to the auxiliary tiller. This low power device routinely steered the 28,500 pound sailboat in seas of 10 feet and more.
ps: The steering device above relied on strong negative feedback to maintain a steady course for the boat.
I have about 25 thousand miles offshore sailing experience with negative, positive and neutral feedback steering systems. With negative steering feedback (a well balanced yacht), once you lock the steering into position, the boat will maintain course on its own. Even when pushed off course by the wind and waves, a well balanced yacht will return to course.
A well balanced yacht (negative feedback steering) behaves much like the temperature of the earth. It maintains a steady (average) course with small deviations from the course.
With neutral steering steering, the boat will slowly drift off course and you will need to make small adjustments from time to time. Otherwise the boat will eventually jibe of go into irons. Both these conditions represent a real danger to a boat and the crew if they are unexpected.
A neutral feedback steering yacht does not behave like the temperature of the earth, because the yacht will slowly drift off course and has no tendency to return to course. The yacht has no sense of “average” course, It is suitable for a racing yacht because it can minimize drag, but needs constant attention.
A boat with positive steering feedback is a danger to itself and the crew. The boat will have definite tipping points. It is like trying to balance standing upon a balance ball. Or like trying to ride a unicycle or fly a helicopter. The further the boat moves from its course, the more the boat will accelerate away from its course. You might say that the boat knows the “average” course and does its level best to avoid sailing that course. It is happy to go anywhere except where it is pointed.
A positive feedback steering yacht does not behave like the temperature of the in earth in that it tries very energetically to avoid the average.
Ferd Berple’s analogy is very good. It makes the point splendidly. And he is absolutely right that climatologists – on both sides of the divide, one might add – are most reluctant to face the fact that they have simply misunderstood the feedback theory that they were taught by other climatologists who had not understood what they had borrowed from control theory.
Interestingly, in our continuing researches we have come across what our professor of control theory is reasonably sure is the reason why climatologists came to make their silly mistake.
The original form of the standard feedback amplifier, comprising a summative input node, a G gain block, an H feedback block and an output node, is needlessly complex. It is far simpler to remove the gain block altogether and replace it with an additional input to the summative input node to represent the perturbation signal. Thus, the base signal and the perturbation signal both enter the input node, where they are summed and then passed round the loop to the feedback block. The mathematics of this layout, which is functionally equivalent to the original G H layout, is far simpler, and easier to understand. One get exactly the same output for given values of the base signal, the perturbation signal and the H feedback fraction (the closed-loop gain factor) as one gets in the traditional layout. But it is at once visible that there are two inputs to the loop – not only the perturbation signal but also the base signal. And one only has to take one look at the simplified block diagram, with those two inputs coming in, to realize that the feedback block must necessarily modify not only the perturbation signal but also the base signal.
Regarding “Climatologists universally but erroneously assume that all of the 25 K feedback response to date must be feedback response to the 8.5 K direct warming (apparently implying from 255 K) by natural and anthropogenic greenhouse gases”: Can you cite a source for this? It is well known among climatologists that a significant part of that 25 K is from the portion of water vapor that would exist if global mean surface temperature was 255 K. (The effect is nonlinear in a concave downward effect, as is the case with greenhouse gases in general, so the water vapor effect at 255 K is greater than would be the case if the effect is decreased linearly proportionally to the amount of water vapor as global surface temperature is decreased from 288 to 255 K, and this is well known among climatologists and climate modelers.)
Similarly, I have seen erroneous analysis by Christopher Monckton and repeated in the leadup to Table 2, where a feedback factor is derived on basis of 25 K of the warming from zero to 288 K (or the like) being from small positive feedback to the large temperature change from absolute zero. The feedback is confined to the temperature range where increasing temperature causes significant increase of GHGs, so the temperature range that is too cold for significant atmospheric presence of CO2 in the atmosphere should be excluded from the temperature range in this calculation.
Even then, the calculation would still be oversimplified by considering the surface albedo feedback being constant over the remaining and still wide temperature range; that feedback is greatest at the global mean surface temperature that maximizes variability of reflection of sunlight by variation of snow and ice cover, which is the roughly low 280s K (global mean surface temperature) when Pleistocene ice sheets over North America advanced and retreated.
The excessive climate sensitivity in most climate models is for unrelated reasons, especially the ignoring of multidecadal oscillations having been in an upswing during the last 30 years of the hindcast periods of most climate models, the hindcast period for which climate models are often tuned to hindcast best.
Mr Klipstein is confused. The analysis in the head posting simply concerns the present. Today’s total greenhouse effect is 33.5 K. Of this, 25 K is feedback response. Climatology’s error is to make predictions of global warming consistent with the assumption that all of the 25 K feedback response is responding to the 8.5 K direct warming by natural and anthropogenic greenhouse gases.
If Mr Klipstein will read Lacis et al. (2010), he will find an explicit statement that because 75% of the entire greenhouse effect is feedback response to the other 25%, the system-gain factor exceeds 3.
Oh, and if Mr Klipstein can find a single paper in all of climatology that makes explicit quantitative allowance for the feedback response to emission temperature, and consequently reduces the feedback response allocated to greenhouse gases, I should be most grateful if he would draw my attention to it.
We have found dozens of papers that talk of feedback as responding only to perturbations or changes in temperature, but not one that talks of feedbacks as responding to the 30-times-larger emission temperature. It may be that we have not read widely enough, and we are willing to be corrected on this as on any aspect of our research that may be wrong or incomplete.
As for feedback to the 30-times larger emission temperature: That means calculating feedback as if it is constant over the temperature range from absolute zero, and ignoring the fact the first 100 or so degrees K of warming from absolute zero would be accompanied by lack of feedback and nearly all of the feedback is in response to the part of the warming that is warming from 100 K. At 100 K and colder, there won’t be much gaseous CO2 or any significant water vapor.
Calculating feedback over a small temperature change is a “small signal” calculation, and this varies with temperature and other factors. I have yet to see a paper describing how this varies with temperature, beyond statements that the surface albedo feedback is a factor when Earth is warmer than “snowball Earth” and cooler than “ice-free Earth”. There is the matter that calculation of a feedback factor on basis of temperature change from absolute zero to a modern or recent global temperature condition is a “large signal” calculation that ignores system gain varying with temperature, including feedback being negligible to temperature variation in the first 100K or so above absolute zero.
The 25K feedback (including water vapor feedback) alongside the claim of non-feedback warming by anthropogenic and natural (much of which is temperature-dependent) emissions of 8.5K only yields about 75% of this warming being from feedback if there is an assumption that none of these greenhouse gases exist at global temperature of 254.5 K. Cooling the world to 254.5 K would not condense any CO2 (although the oceans would absorb enough to account for a few degrees of cooling but still leave enough to have considerable warming) and there would still be enough water vapor to accomplish significant warming.
As for Lacis et al. 2010: That paper merely claims that “condensing” greenhouse gases (water vapor) have about 75% of the total greenhouse gas effect, and “non-condensing” greenhouse gases (mostly CO2, also including methane) have about 25% of the total greenhouse gas effect. But because there is enough water vapor to have significant GHG effect if global mean surface temperature is 254-255 K (please keep in mind that GHGs in general have effects being nonlinear in a concave-downward manner), a substantial part of that 25 K 75% of the condensing-GHG part of GHG warming would still exist at global mean temperature of 254-255 K, so it takes temperature change (including what is caused by feedbacks) of a lot more than 33.5 K to accomplish feedbacks (from condensing GHGs) amounting to 25 K. However (as I already said), the required temperature change is a lot smaller than warmup from absolute zero.
I must respectfully disagree with Mr Klipstein on two points. First, if one considers the state of the climate at a single particular moment – let us take today as an example – then apportioning the 25 K total feedback response up to that moment proportionately between the 255 K emission temperature, the 7.6 K direct warming by preindustrial noncondensing greenhouse gases and the 0.9 K direct warming by anthropogenic greenhouse gases is not a calculation performed based on absolute zero, except in the trivial sense that 255 K exceeds 0 K by 255 K.
Feedback processes in the climate are inanimate. At any given moment, they cannot distinguish between 1 K of emission temperature and 1 K of direct warming by greenhouse gases. To them, a Kelvin is a Kelvin is a Kelvin. Therefore, the unit feedback response applicable at that particular moment applies equally to each Kelvin of the entire reference temperature obtaining at that moment.
Note that this proportional apportionment at a given moment does not in any way either assume or imply invariance of unit feedback response with temperature. We can work out today’s feedback responses quite accurately because we know what emission temperature is, we know what the direct warmings by natural and anthropogenic greenhouse gases are, and we know what the total feedback response to date is, because we know today’s temperature.
The total anthropogenic feedback response to date is just 0.1 K. There is no good reason to suppose that that will jump by a further 2.7 K in response to just 1 K of direct warming by doubled CO2 compared with today’s concentration.
Secondly, I fear that Mr Klipstein has misunderstood Lacis et al. They make it quite clear that they consider the 75% of the total greenhouse effect that is represented by feedback response to have been driven by the 25% of the total greenhouse effect that is direct warming by greenhouse gases. That is why they later cite Hansen (1984) with approval, citing the very passage where he makes the error quantitatively explicit.
Your mentioning of P. Frank´s paper is very interesting!
I just stumbled over a discussion between him and R. Spencer at Spencer´s blog from 2019
And I believe both of them
IMHO this is the reason why climate models are used in the first place, to speculate and look for effects inside the uncertainty envelope.
I am unclear about how this is plays out mathematically and would appreciate your opinion on that.
Is it just that the model initialization sets certain parameters (like the cloud cover/cloud effect) and thus by picking one set of values it becomes uncertain and unkown if that model represents Earth anymore or is there more to it?
Laws of Nature says both Pat Frank and Roy Spencer are correct. As he states their positions, that is true. Yes, propagated uncertainty in just one of the myriad uncertain measurements that are the models’ initial conditions is enough to generate an uncertainty envelope so large that all the models’ predictions are statistically proven to be no better than guesswork. Pat Frank is right about that.
And Roy Spencer is right that the models can detect the CO2 signal.
However – and this is Pat’s point – they cannot reliably quantify that signal’s effect and hence produce accurate global-warming predictions. That is why, though the models have many uses, they are entirely valueless when it comes to making predictions of how much warming we may cause.
That is why one of the earliest methods of estimating equilibrium sensitivities outside the models was apportionment of the total greenhouse effect (see e.g. IPCC 1990). But, though that method is a very good method, and gives well constrained estimates of equilibrium sensitivity if it is implemented correctly, climate science has always implemented it incorrectly, in that climate scientists cannot be brought to understand that at any moment the feedback processes subsisting in the climate at that moment will necessarily respond to the entire reference signal (the 255 K emission temperature plus the 8.5 K direct greenhouse-gas warming), and not merely to the 8.5 K on its own.
Well thank you for your pleasant answer!
“they are entirely valueless when it comes to making predictions of how much warming we may cause.”
Well I would like to add that the models make predictions, but the system they make predictions for is not our planet anymore (Or more precise, it might be, but there is no way to know if it is)
Aww.. “reference signal (the 255 K emission temperature plus the 8.5 K direct greenhouse-gas warming)”
Well since most of the 255K is caused by solar radiation, clearly you propose a feedback which changes the sun!
Do you think it is aww “strange” to repeat the same statement over and over again and ignroe critique on it? Do you think the critique might just go away if you repeat yourself often enough?
Do you agree that the solar radiation is the dominiating “base signal” causing the difference of Earth´s temperature from absolute zero?
Laws of Nature is clearly having more than a little difficulty in understanding the detailed answers I have provided. So let me keep this one short. The Sun and the greenhouse gases warm the ocean. Water evaporates and, because the atmosphere is warmer, it can hold more water vapor as it warms. That is the water vapor feedback, which causes a small additional warming called a feedback response. There is absolutely no requirement in that schema for the Sun to be altered in any way.
If Laws of Nature were to read any control-theory textbook, he would see that if one were to measure the input line whether or not the loop was closed the signal would remain the same either way. So there is no requirement to alter the Sun to achieve our result, as I thought I had comprehensively explained in my earlier reply.
Nana, easy on the ad hominem, they are always a clear indication that you are wrong.
Does the signal in your feedback loop include the sun´s contribution or not? Your words say the sun does not change, your math includes it, your article is thus flawed.
There was no ad hominem. I had pointed out – correctly, as it turns out – that Laws of Nature was having difficulty in understanding what I had written. I did not say Laws of Nature was stupid, uneducated or wilfully wrong, for that, in the circumstances, would have been an argumentum ad hominem.
The difficulty in understanding may have been attributable to a lack of clarity on my part. Therefore, I tried a different and shorter explanation, but that has not worked either.
One the whole, I try to reserve ad hominem comments for those who have directed them at me, so that they get some idea of what it feels like for those of us who dare to question the cloying orthodoxy of climate Communism to be subjected to lavishly-funded, organized, continuous reputational assault. I give as good as I get.
With that out of the way, let me try again to explain the relevant control theory.
Let us agree that the Sun is shining and that, therefore, even if there were no greenhouse gases in the air there would be a surface temperature. It is generally agreed in climatology that that surface temperature is 255 K. It is probably higher than that, but, as the head posting shows, it doesn’t make a lot of difference whether the emission temperature is a few percentage points up or down on 255 K.
Let us also agree that nothing we do down here will have any measurable influence on the Sun, for it is big and far away and we are small.
The question is whether the Sun can evaporate water without the evaporation of water affecting the Sun.
The answer is Yes.
But the evaporation of water is the most important feedback – indeed, at midrange, IPCC considers all other feedbacks to be broadly self-canceling.
Therefore, the mere fact of emission temperature causes temperature on Earth to rise, because of the water vapor feedback.
Now consider the present. There are three direct contributions to the temperature that would prevail on Earth today if there were no temperature feedbacks operating and there were, therefore, no feedback response.
These contributions are (1) the 255 K emission temperature; (2) the 7.6 K direct warming by, or reference sensitivity to, naturally-occurring, noncondensing greenhouse gases; (3) the 0.9 K reference sensitivity to anthropogenic greenhouse gases.
Let us agree that feedback processes are inanimate. At any given moment, they will respond equally to each Kelvin of the reference temperature, regardless of whether that Kelvin came from the Sun, from natural or from anthropogenic greenhouse gases.
Therefore, the magnitude of the feedback response to each component in the reference temperature will be proportional to the magnitude of that component.
Therefore, the feedback responses to the three components in today’s reference temperature are 24.2 K to 255 K, 0.7 K to 7.6 K, and 0.1 K to 0.9 K: total 25 K to the entire 263.5 K reference temperature.
As you can see, the feedback response engendered by the entire anthropogenic influence on climate since 1850 is only 0.1 K. So a doubling of CO2 compared to today, which would add 1.06 K to today’s reference signal, would not be likely to add more than 0.1-0.2 K of additional feedback response to that signal.
None of this in any way requires that we should alter the Sun.
It is the other way about. The Sun, by the large emission temperature, is the largest driver of the evaporation of water that is the chief cause of feedback response in the climate.
“If Laws of Nature were to read any control-theory textbook, he would see that if one were to measure the input line whether or not the loop was closed the signal would remain the same either way. So there is no requirement to alter the Sun to achieve our result, as I thought I had comprehensively explained in my earlier reply.”
M’lord.
That is not what more (in your words) “distinguished” experts in the field of control theory say.
You are not an expert.
Despite your compulsive self aggrandisement.
And just when were you, err, Margaret Thatcher’s science consultant exactly?
(Your ankle biting is boring, suggest you focus on what you agree or disagree in what he writes about instead) SUNMOD
I am grateful to Sunsettomy for reining in Mr Banton a little.
I am not aware of any control-theory expert who would dream of stating that a given base signal would change before it entered the feedback loop merely because the loop was closed rather than open. The output signal would of course change, but the input signal – in the climate, the 255 K emission temperature – would not change at all. We have no power to cause any detectable change in the Sun by our tiny alteration of the Earth’s atmospheric composition.
What I have just said is not only self-evident in the governing equations of the feedback amplifier in control theory, but was also confirmed both on our own test apparatus and by a second apparatus constructed to our control theorists’ design and operated by a national laboratory.
That is called “research”.
If Mr Banton knows of any control theorist who thinks that a base signal is altered before it enters the feedback loop by whether or not the feedback loop is closed, perhaps he would provide a reference and a quotation.
As to self-aggrandisement, I was indeed a policy adviser to Margaret Thatcher at 10 Downing Street from 1982-1986, and my advice included advice on several scientific topics. For instance, I devised an index-linked mortgage that removed the inflationary front-loading of repayments that made house-buying unaffordable for low-income families; I halted a major fraud in the Ministry of Defence; and, in numerous other ways, provided advice on scientific questions.
“(Your ankle biting is boring, suggest you focus on what you agree or disagree in what he writes about instead) SUNMOD”
I would agree with you.
But have you asked m’lord to grow some integrity?
And stop lying about the science and refusing to admit the blindingly obvious.
His obfuscating nastiness was all I wanted to expose anyway.
And he has done that in spades.
Seems not. (why?)
So there we go with bad behaviour being rewarded.
But he has been the recipient of that all his entitled life.
You know…
This place really aught to realise where it is its own worst enemy.
BTW: we dont agree on anything.
And FYI
Blog rules :
I wasn’t the only one he ad hom’d
He never comes here to learn. He only pisses off any and all who have the temerity to challenge his superiority.
And this place repeatedly allows it.
Does this mean you are letting the door hit you on your way out?
For those that believe climate science is correct about feedback, here is a simple test. Drive to a large empty parking lot. Put the car in reverse. You now have a positive feedback machine similar to what climate science says our climate must be.
Assume the correct driving position, one hand on the wheel, head facing backwards. If you drive on the left, your right hand is on the wheel. Maybe the Brits have some method to their madness after all.
Now, with the wheel in the 12 o’clock position accelerate to a constant 30 mph in reverse.
Wiggle the wheel to the 11 o’clock and 1 o’clock positions.
This is your change in forcings. Memorize the feedback that results.
Now repeat the experiment, but start with the wheel in 9 o’clock position. Accelerate to a constant 30 mph and wiggle the wheel between the 8 o’clock and 10 o’clock positions.
In both cases the forcings were identical. A 30 degree change in the wheel position right or left. However, unless the steering in your car is broken, you will have experienced very different feedbacks.
Anyone can replicate this result. It shows that feedback is not a function of the change in forcings.
In effect, climate science ignores the sun as a forcing. It assumes that the steering wheel go to the 9 oclock position from the 12 oclock position without any forcings. That you can understand thd feedbacks without understanding what happened when the wheel was at the 12 oclock position.
But in effect, by only studying feedback from the 9 oclock position climate science only has a single data point. An infinite number of straight lines will satisfy. Thus you cannot constain ECS.
By adding the 12 oclock position you now have 2 data points. Only 1 linear equafion will satisfy this. You can thus constrain ECS.
Ferd’s analogy is excellent. Now, how do we explain all this to climate scientists who really, really don’t want the humiliation of admitting that what they told us was the settledest of settled science was simply a gross and catastrophic error of physics?
The warming of the earth by the sun in the absence of GHG doesnt just affect water vapor. It also affects the lapse rate.
It is assumed that without ghg there would be no convection because the atmisphere would all be the same temperature.
But this fails to account for orbital mechanics. The heating of the earths atmosphere is not uniform. This causes the troposphere to extend higher at the equator and on the sunlit side than at the poles and on the night side.
We have above our heads an ocean of air. And like the ocean it wants to seek the lowest level. This sets up a high level flow of air from the equator towards the poles, from the day side towards the night.
At the same time, because there is no lapse rate, the air at altitude has greater energy than the air at the surface. While kinetic energy is the same for both, potential energy is not.
As this higher energy air moves towards the poles and eventually the surface, this potential energy must be converted to kinetic energy. This has the net effect of warming the poles above the calculated black body temperature.
While at the same time the heated air rising at the tropics as a result of differential heating must aquire potential energy as it rises. This causes cooling of the upper atmosphere at the dayside on the equator.
Thus, in the absence of GHG we still have convection and a lapse rate due to differential heating of the atmosphere due to orbital mecganics.
This lapse rate warms the surface above blackbody towards the poles and cools the atmosphere below black body toward the equator.
The driver for this process is solat energy and the earths orbit. Energy is conserved. Energy from the upper atmosphere is transfered to the surface, but total energy is unchanged. This effect occurs because convection is more efficient than conduction. Conduction tries to remove the lapse rate but convection seeks to create it.
In effect, without GHG the atmosphere is a giant solar powered heat pump, with gravity creating the difference in pressure between the hot sidd (surface) and the cold (altitude) side.
That is why the lapse rate contains no terms for radiation. The lapse rate is a product of air and gravity, moderated by the condensation of water vapor.
Even if all water on the planet was frozen, so long as we had air and sunlight and differential heating we would have a lapse rate. The net effect would be to warm the surface and the lower atmosphere above black body and cool the atmosphere at altitude below black body.
Ferd Berple is correct that there would be a lapse-rate feedback response as well as a water-vapor feedback response to emission temperature, even in the absence of noncondensing greenhouse gases. However, our result does not depend on what might have happened at emission temperature. At any given moment – including the present – feedback processes respond to the entire reference signal: i.e., to the 263.5 K sum of the 255 K emission temperature and the 8.5 K direct warming by noncondensing greenhouse gases.
What is more, at any particular moment – including the present – feedback processes respond equally to each Kelvin of the entire reference temperature, and, therefore, they respond proportionately to each component in the reference signal.
Thus, the present-day feedback responses are as follows: 24.2 K to the 255 K emission temperature, 0.7 K to the 7.6 K direct warming by preindustrial greenhouse gases, and just 0.1 K to the 0.9 K direct warming by anthropogenic greenhouse gases from 1850-2020. Total feedback response is 25 K to 263.5 K; and, in each instance, the unit feedback response is identical.
Since the 0.9 K direct warming by anthropogenic greenhouse gases to date has driven only 0.1 K feedback response, the 1.05 K direct warming by doubled CO2 compared with the present is not likely to drive much more than 0.1 K feedback response. Therefore, ECS is unlikely to exceed 1.1-1.2 K.
Radiation theory is wrong tool to explain surface temperatures.
https://reality348.wordpress.com/2021/07/09/all-ye-promoters-of-erratic-sources-of-energy-come-now-repent-and-be-forgiven/