Guest Post by Willis Eschenbach
Well, it seems like climate alarmists have noticed that all their hysterical screeching about carbon dioxide (CO2) isn’t having the desired effect. So they’re turning to a new villain, methane (CH4). Here’s Nature, which used to be a serious scientific journal, moaning that methane is “soaring” to new heights.

Figure 1. Page from Nature magazine, original here.
Now, anyone who knows me knows what I did after seeing that—I went and got the data to see what’s going on. We have data from a couple of sources—modern measurements, and ice cores. The Nature article only showed the change since 1984, but I always start with a long overview to give context to the data. Here’s the change in atmospheric methane since 1750.

Figure 2. Changes in airborne methane since 1750. Ice core data to 1980, modern measurements from 1984 onwards
Now, there are a couple of puzzles in this data. First, nobody knows the cause for the slowdown in methane rise that started about 1985 and ended around 2005.
Next, nobody knows why the rise started again. From the Nature article:
The growth of methane emissions slowed around the turn of the millennium, but began a rapid and mysterious uptick around 2007. The spike has caused many researchers to worry that global warming is creating a feedback mechanism that will cause ever more methane to be released, making it even harder to rein in rising temperatures.
“Methane levels are growing dangerously fast,” says Euan Nisbet, an Earth scientist at Royal Holloway, University of London, in Egham, UK. The emissions, which seem to have accelerated in the past few years, are a major threat to the world’s goal of limiting global warming to 1.5–2 °C over pre-industrial temperatures, he says.
YIKES!! WORRIED RESEARCHERS! LEVELS GROWING DANGEROUSLY FAST! FEEDBACK MECHANISM!
(In passing, can I say how bored I am by scientists and researchers who are “worried”? Near as I can tell, these guys sit up nights looking for things to be worried about, and when they seize on something, they try to convince us that we all should be worried about it too … but I digress.)
In any case, just how fast are the methane levels rising? To investigate that, here’s a graph of the five-year “trailing trend”. This is the trend of the change over the five years previous to each year of record.

Figure 3. Changes in the five-year trailing trends of the rise in atmospheric methane.
Call me crazy, but I’m not seeing what the “worried researcher” described as methane levels “growing dangerously fast” … they’re only growing a third as fast as they were in 1985.
My conclusion?
I’m not going to be concerned until such time as the trend starts getting up somewhere around the 1985 levels.
My best to everyone, whether you’re worried or not …
w.
MY USUAL: When you comment PLEASE quote the exact words you are discussing. I can defend my own words and I’m happy to do so. But I can’t defend your interpretation of my words.
DATA:
I would assess the impact of the fall of USSR for decline, and NG displacing coal in US for increase starting around 2005 (EIA).
While at Shell Oil I recall hearing how both Shell and Chevron discovered considerable NG leaks in USSR infrastructure as they went in after the fall of the Soviets. 5-10% losses compared to .05% in much of the developed world??
Only one question needs to be asked:
Business as usual, how much is methane on track to increase global temperature by 2100?
If any one says that it’s more a few one hundredths of a degree Celsius they need to show their work.
More data to take on the unicorn balloons and echo-chamber voices.
Attached is a slide for SURFRAD data at Table Mountain, Boulder, CO 6/18/21. There are 1,440 1-minute data points.
Column 13 is downwelling solar insolation, “dw_solar real” or the 160 on the K-T diagram.
Column 14 is upwelling insolation, “uw_solar real” or the 63 on the K-T diagram.
Column 25 is the difference between the two or what I have demonstrated is the non-radiation, kinetic energy, heat transfer processes and NOT “back” radiation.
Column 17 is the downwelling IR, dw_ir or the 333 on the K-T diagram.
It’s not real.
Column 20 is the upwelling IR, uw_ir, or the 396 in the K-T diagram. This is the theoretical, S-B BB result for the GROUND temperature not the 10 m “surface” air temperature. In this case, Column 14/column 20 is the emissivity. Just as with the K-T et. al. balances applying this emissivity to the raw uw_ir measurement makes the uw/dw_ir loop disappear while the balance remains.
It, too, is not real.
A plot of the ground versus 10 m air temps is revealing.
During the night the 10 m temp is slightly higher than the actual ground temperature.
As day breaks the ground temperature rises much faster than the 10 m temp and during much of the day is much higher than the 10 m temp.
The ground is a heat sink that absorbs energy during the day and releases it during the night.
When the correct emissivity is applied there is no GHG energy loop.
Correct. If there was a GHE that had any impact on the surface temperature then it would be possible to get open ocean surface temperature higher than 30C and lower than -1.8C. Those limits are controlled by ice on ocean surface and the persistence of ice in the atmosphere.
What ever people choose to believe about a “Greenhouse Effect” it has no influence on Earth’s energy balance.
If “back” radiation were real there would be refrigerators w/o power cords.
I have not seen any.
You?
Nick Schroeder February 9, 2022 12:00 pm
I fear you are misrepresenting both the Table Mountain data and the K-T diagram.
The K/T diagram is a global 24/7 average.
The Table Mountain data you’ve shown is for one location for a few minutes in one late summer afternoon around 5 PM.
There is NO reason to think those would be even remotely similar.
Next, here’s the K-T diagram:
As you will note, upwelling solar on the K-T diagram is 23 W/m2, NOT 63 W/m2 as you claim.
Next, column 25 is the net solar absorbed (incident solar from col. 13 minus reflected solar from column 14). It has nothing to do with downwelling thermal radiation (aka “back radiation”).
Finally, column 17 is the downwelling thermal radiation (aka “back radiation”). Of course, like the others, it is different from the amount given in the K-T diagram, for the reason given above.
w.
161 makes it to the surface, per LoT 1 161 is ALL that can leave. 1 is left behind. 160-17-80=63
Really, real reality.
396 – (40+23) = 333 is 100% imaginary.
Don’t know which version K-T this is.
The 374/22 should be 333/40/23.
The numbers are different because the K-T model divides all by 4 to average the discular over the spherical TOA. A rather dumb thang to.
SURFRAD uses actual measurements.
Both use the same general and erroneous concept.
That is only part of the reason for the difference. The other one, which it seems you still haven’t grasped, is that one is a measurement at a single time at a single location, and the other is a long-term global average.
And your claim that there is no downwelling longwave radiation is falsified by the very dataset you have posted up. It gives the ACTUAL MEASURED DOWNWELLING LONGWAVE RADIATION.
You know the radiation in question. It’s the radiation you foolishly but persistently, in the face of a mountain of evidence including YOUR OWN TABLE MOUNTAIN DATASET, claim doesn’t exist. It’s shown right there in column 17.
But sure, go ahead and ignore scientists all over the world measuring downwelling longwave radiation every day.
And then ignore dozens and dozens of automated measurements like those of Table Mountain and all the other SURFRAD stations, along with instruments on things like the TAO moored buoy arrays. Every day, all of them are MEASURING the downwelling radiation you claim is imaginary …
And of course, ignore the Stefan-Boltzmann equation that allows us to determine how much radiation something at a certain temperature gives off.
And while you’re at it, ignore the long-accepted fact that with the exception of monatomic gases, all substances can both absorb and radiate longwave thermal energy … and that AS MEASURED IN LABS ALL OVER THE PLANET, the so-called “greenhouse gases” are excellent absorbers and radiators of longwave energy.
I gotta say, though … that level of denial of obvious easily verifiable reality is actually impressive. I know I couldn’t pull it off.
w.
“…is that one is a measurement at a single time at a single location, and the other is a long-term global average.”
No, one is a model and the other actual data.
If the upwelling is imaginary (It is.) then the downwelling must also be imaginary. I can tweak an IR instrument w emissivity to display anything I want.
“…ignore the Stefan-Boltzmann equation…”
While you ignore the evidence for emissivity which is part of that equation.
BTW do you have a link for that graphic?
I give up, Nick. As the old saying has it, “You can lead a horse to water, but you can’t make him learn the backstroke” …
You’ll have to take this up with someone else. I can’t deal with your level of blind denial.
Best regards, and don’t go away mad.
Just go away. Not interested.
w.
I know, it is to no avail to the adepts of the no-back-radiation-theory, but back-radiation is really measured at a lot of places and is around 300 W/m2, as good as ground radiation is measured and higher than the back-radiation:
https://scienceofdoom.com/2010/07/17/the-amazing-case-of-back-radiation/
If you think that they all used some imaginary equipment, then I think you should change your opinion…
Moreover, two stations have measured back radiation in extreme fine detail with spectral analyses, which did give them even the small changes of CO2 back radiation over the seasons in the period 2000-2010:
https://newscenter.lbl.gov/2015/02/25/co2-greenhouse-effect-increase/
Or in detail:
https://escholarship.org/content/qt3428v1r6/qt3428v1r6.pdf
You can’t tweak spectral analyses that easy…
Every time I see these graphs I wonder how the near surface temperature can ever be lower then the actual surface temperature.
There is the1.5 m (USCRN) or 10 m (SURFRAD) surface temperature and the real actual ground temperature (some USCRN sites).
They are all different because the sun heats the ground during the day above the air temperature and at night cold air settles in and the air temp can be higher than the ground.
aka weather.
The methane is due to the increase in the number of people eating vegan and vegetarian diets. It is all those beans and pulses wot dun it.
Meat eaters rise up
No idea what it’s like elsewhere in the World, but here in the UK, my experience of vegetarians & vegans is that they are constantly telling me how bad meat eating is, & alleging how bad it is for the planet. However, I never try to impose my views upon them, ever, & I defend their right to their views, right or wrong!!! I seem to recall reading an article online some years back about how if everyone on the planet went vegetarian & or vegan, say goodbye to the worlds rain-forests & jungles, as the land would have to be turned over for agricultural production to feed 7 billion Human beings!!!
“In passing, can I say how bored I am by scientists and researchers who are “worried…”
I see this in marine biological papers quite often, some from those educated over two generations ago. I don’t collect words like “Unfortunately” and others that give away their advocacy, and a “need to increase funding” is not rare as in one I just read this AM. It’s a good education in linguistics, hard to hide motivations. Part of it is including management solutions with the science– It’s bad but we can fix it sort of thing. It always seems to be associated with a slant (bias) in their research which unfortunately can cover their valuable part, if any, but does occur.
Amazing what you can do when graphing “data” to provide “concern.”
When a Long period is used for “smoothing” data . not only is the “Data” smoothed the inflection points of the data being graphed are shifted so that it is no longer in phase with the actual event. If you then take another set of “data” and shift it by a different time period you can create the false impression that Data “A” is Leading, Lagging or even Synchronized with Data “B.” Basically you have taken the data and put it through a “Filter” to achieve your desired result to sell your rotten tomatoes. Especially dangerous when one of these datasets has an inherent, dominant, bias increasing (or decreasing) the values in the dataset over a long period. Like the inherent increase in Global Temperature of the Earth upon exiting an Ice Age.
I’m just being silly here 🙂
Has anyone performed a global analysis of the total leakage of Methane in mines and Volcano emissions, including underwater, and the relationship to the fluctuation due to gravitational pull on the Earth from the planets in our solar system? Wasn’t there an “Alignment” of the planets back around 2000?
Democrats better devise some method of keeping the economy alive when several million Truckers go on a general strike and park their rigs on the DC Beltway and all around town…with a few hundred thousand pick-up trucks (with provisions for a few months) in the mix.
Why would Truckers do that? I suspect $6 to $7 diesel fuel might suffice… and that’s a certainty if investment funds for developing domestic oil reserves don’t materialize pretty soon.
gee, 1,900 parts per billion? same as 19,000 parts per trillion- sound scarier
Actually, thats 1,900,000 parts per trillion …
w.
Holy shit!!!
Methane has a lower explosive limit of 5% in air. Until any location gets to that level, methane is zero risk.
It would make sense to collect it from productive sources and burn it in a controlled manner. That happens in old tips around Australia and gas drainage systems in coal mines.
Every sewage treatment plant in world produces methane in their digesters. They usually flare it off, with some losses.
In the UK they collect it and use it to power sewage plant and water pumping.
In fact they generate it from sewage.
https://www.powersystemsuk.co.uk/anaerobic-digestion/thames-water-has-gone-out-to-tender-for-lots-covering-biogas-and-biomethane
Speaking of methane produces……..
Yes, that’s what I said.
It could also be used to create distilled water to be sold as a by-product, or added to the outflow to dilute undesirable leftover contaminants.
The Nature article was based on NOAA data. What Nature did not say is that in that NOAA date the composition of CH₄ is expressed on a dry air basis. Without the presence of water (usually expressed in percentages—parts per hundred) changes in CH₄ (expressed in parts per billion) might look significant. When the presence of water is included any changes in methane are lost in the noise of the measurements!
Ice is an unstable, plastic rock. The graph from 1750 to 1980 may show that methane in ice deteriorates at a steady rate and not the methane level at the time the ice formed.
Brian, that doesn’t seem to be the case … the ice core methane level from 0 AD to 1750 AD is basically flat.
w.
Could that be caused by bacteria?
There are some extremophiles in ice which (hardly) survive the cold temperatures (-20 to -40 C) of Antarctica, but that mainly is restricted to dust inclusions and restricted to DNA repair to survive for hundred thousands of years…
See: https://www.pnas.org/content/pnas/101/13/4631.full.pdf
Chapter K is about the Vostok ice core at -40 C.
For CO2 that gives less than 1 ppmv difference.
How much that influences CH4 is unknown.
For glacier ice, the temperatures are much higher and bacteria can produce a lot of CO2 and CH4, as in the same chapter is indicated…
From the article: “Here’s Nature, which used to be a serious scientific journal”
Used to be. Not any more. They have been totally corrupted by the Human-caused Climate Change scam.
My guess is that the decline in the amount of methane is about the time that natural gas became valuable as a commodity and started to be injected to support increased oil production or sold outright as its own commodity. Up until then (if the reservoir relied on solution gas as a drive mechanism) it was routinely flared at the wellhead. Just a thought.
Does it correlate with volcanlc activity?
Despite lots of folks looking, nobody to date has found a reason for either the flattening or the recent increase in methane.
w.
Rising tide of communism?
Willis,
“Despite lots of folks looking, nobody to date has found a reason for either the flattening or the recent increase in methane.”
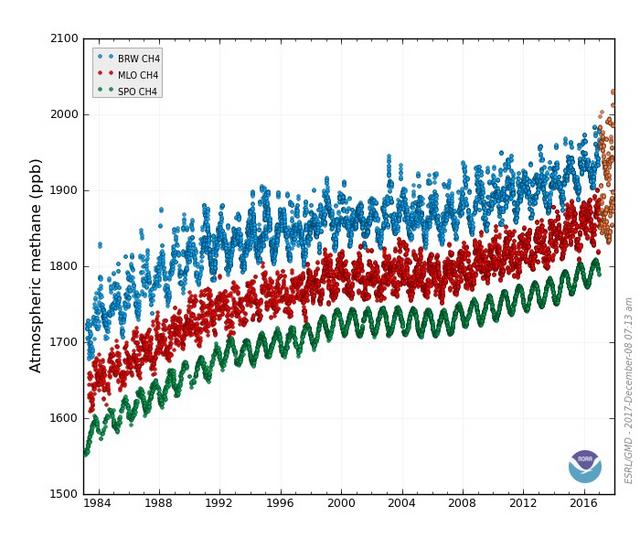
As usual, you go straight to the key issue! The absence of a reasonable hypothesis for the major changes in growth rate of atmospheric methane is indeed a critical limitation of current scientific knowledge. There a couple of interesting (to me, at least) characteristics of atmospheric methane growth. Firstly, the data show that the level of atmospheric methane at any particular time increases globally from south to north. This has been known for a long time and it does not appear to be an issue of calibration errors between observatories (see, for example: https://gml.noaa.gov/publications/showpub.php?pubid=5226). Here are the NOAA data from Barrow, Alaska (BRW), Mauna Loa (MLO) and the South Pole (SPO):
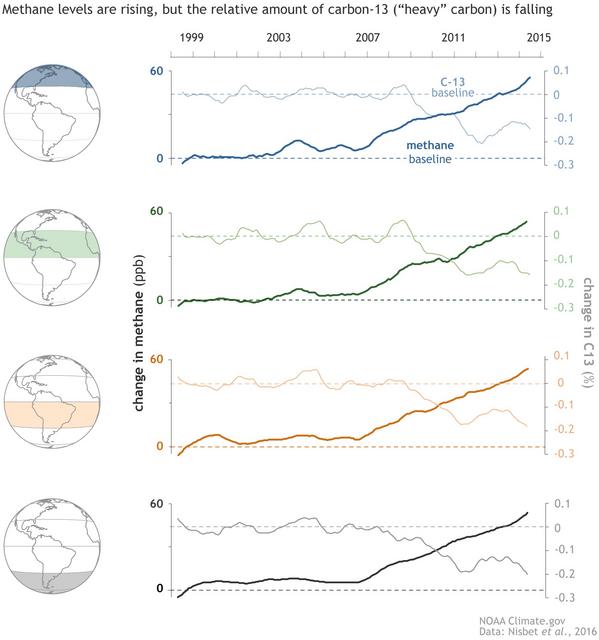
The seasonal cycle is larger further north, as it is with CO2, but so are the mean values; in addition, the offsets are maintained as the growth rate changes. This latitudinal consistency in growth rate is even clearer on this other NOAA plot using a common baseline for methane content:
There is very little growth of atmospheric methane from the late 1990s until late-2006 at which time there is a major increase in rate of growth. This change appears to be virtually synchronous globally, despite the existence of the latitudinal offsets. The question is then: how does an increase in atmospheric methane occur at virtually the same time at the South Pole as it does in Alaska, unless the primary source of the increase is essentially global in nature and there is a different physical process controlling the latitudinal gradient in values?
The other point shown on the above figure is the change in the 13C/12C ratio (δ13C) of atmospheric methane. The incremental methane since 2007 clearly has a net δ13C that is lower (more negative) on average than the pre-2007 atmospheric methane content. This has long been an annoyance to those wishing to blame fossil fuels for the increase in atmospheric methane, since lower δ13C values are much more likely to arise from biogenic sources than from fossil fuels. Indeed, a recent NOAA study strongly supports this view:
https://research.noaa.gov/article/ArtMID/587/ArticleID/2769/New-analysis-shows-microbial-sources-fueling-rise-of-atmospheric-methane
(h/t to “Scissor” who commented on Kip Hansen’s WUWT post on methane yesterday)
Whatever the source is for the recent (post 2007) increase in atmospheric methane, how could global warming be the cause when there was a slowdown in growth during the 1990s and essentially no growth from the late 1990s until 2007? There seems to be a logic flaw in there somewhere!
Jim, there doesn’t need to be global sources of methane, as there is about a 10% per year mix of air between NH and SH via the ITCZ.
Thus even if the main sources of CO2 and CH4 are for 90% in the NH, they are mixed all over the globe, with a 6 months delay between ground stations (like Barrow) and Mauna Loa and up to 2 years between Barrow and the South Pole.
CH4 during the warmer previous interglacial (the Eemian) was around 700 ppbv, including a lot of melted permafrost. The level over the Holocene also was around 650-700 ppbv up to about 1750 and increasing since then. The increase may be from coal mining, natural gas exploration and leaks, rice and cattle…
These are all increasing over time, but nobody knows the ratio between these sources…
Ferdinand,
Please show me the data that contradicts the NOAA plots that I showed above, and which supports your view that there is a 2 year delay between Barrow and South Pole methane data. Perhaps I need new glasses, but I see Barrow at 1900 ppb in 2012 whereas as the South Pole is still at 1800 ppb in 2017 (five years later).
Jim,
The lags are for CO2 and implicitly also for CH4, but CO2 is not destroyed in the atmosphere, while CH4 reacts with OH radicals, ozone and other oxidants and is slowly destroyed between the main sources in the NH at ground level and MLO at 3400 meter and the south pole at 2300 m and behind the ITCZ barrier…
The rise and fall of methane levels seems to follow a tight correlation with the dimensions of the over-stuffed bowels of climate bureaucrats. Who would have thought it.
“In passing, can I say how bored I am by scientists and researchers who are “worried”?”
That may be a little harsh. Worrying works. 97% of the stuff I worry about never happens.
And for the same reason that blowing a whistle keeps the pink elephants away.
There was a time, not so long ago, that the model for the ideal scientist was one who was a disinterested, or dispassionate observer. In other words, objective. I’m afraid that what now passes for a scientist is someone who has a concern and goes out looking for evidence to support their concern.
Lordy, we have temperatures not getting anywhere close to the forecast rises based on CO2 alone.
Now we have methane to contend with as well?!?!
Anyone checked the populations of methanogenic archaea? Or if there’s some factor impeding its oxidation, and so extending its half-life of 9.1 years?
In passing, can I say how bored I am by scientists and researchers who are “worried”?
Worry has been weaponized.
A nuanced from of weaponized victimhood.
Beware those furrowed foreheads!
The CH4 levels in the atmosphere could be reduced by 11% overnight be exterminating all termites which harbour methane excreting bacteria in their gut. Well, it makes as much sense as most climate science.
JF
BTW, global warming is partly caused by oil spills smoothing water surfaces – various mechanisms. Another part cause is nitrate/phosphate/silica pollution feeding oleaginous plankton which also contribute to smoothing. See also the Permian/Triassic extinction. Article sitting in CR’s in tray.
“The spike has caused many researchers to worry that global warming is creating a feedback mechanism that will cause ever more methane to be released!”
Yet again a non-scientific biased cause and effect “confusion”
First it was average global temperatures caused by CO2 increases.This was measurable and therefore verifiable. Historic records showed Increased temperatures before CO2 increases and temperature rises without CO2 changes. Data didn’t support this so they changed to Climate Change – something that is far less quantifiable and therefore challengeable and has always happened regardless of CO2 levels.
Now its methane, as CO2 hat let the alarmists down! What’s next!
CO2 is nothing to worry about, and methane is less than nothing to worry about. That trend graph is mystifying though. The spike upward from about 1950 to 1980 and then the crash from 1980 to about 2010 is weird.
But yeah, the Alarmunists need methane to help pad their anti-carbon anti-West and anti-democracy portfolio. Maybe they can keep the whole scam going for a few more years. The prisons will still be there.