Independent reference system shows airport station reporting temperatures up to 3°F warmer than nearby properly sited station. Official recorded temperatures at Reno-Tahoe International Airport are inaccurately too high due to the urban heat island effect.
SCHAUMBURG, IL (March 10, 2026) – A new analysis by The Heartland Institute finds that the official temperature station at Reno-Tahoe International Airport consistently records warmer temperatures than a nearby properly sited reference station, demonstrating how station placement and local surroundings can introduce measurable bias into surface temperature records.
This is particularly important because Reno is often cited as “the fastest warming city in the United States,” with the blame being placed squarely on climate change. The official National Oceanic and Atmospheric Administration (NOAA) station in Reno for climate observations is called an Automated Surface Observing System (ASOS) station, and is located between runways at the airport.
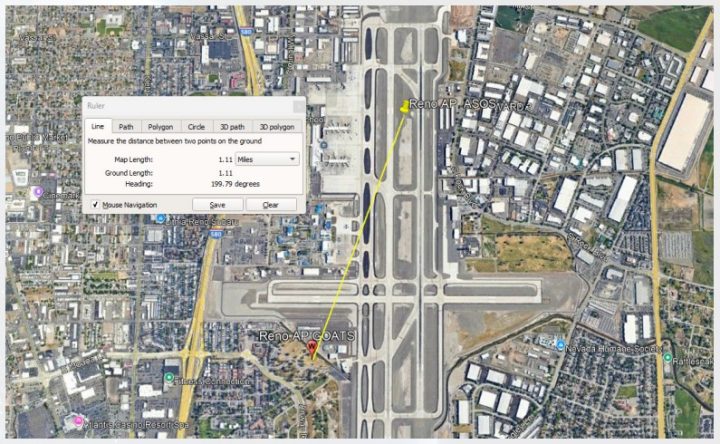
The report, Global Open Atmospheric Temperature System (GOATS): What Was Accomplished in Reno, [add hotlink to document] presents the results of a two-year side-by-side comparison between the airport’s ASOS station and an independently operated state-of-the art reference station designed to meet strict siting standards.
The comparison shows that the airport ASOS station – surrounded by pavement, runways, and infrastructure – measured significantly warmer temperatures than the GOATS station located just 1.1 miles away on a properly sited grassy area free from nearby heat-retaining surfaces.
“These measurements demonstrate that station placement alone can introduce a meaningful warm bias into reported temperature data,” said Anthony Watts, senior fellow for environment and climate at The Heartland Institute and creator of the Global Open Atmospheric Temperature System (GOATS). “When thermometers are placed near heat-retaining surfaces such as asphalt and buildings, they measure the temperature of that environment—not necessarily the broader atmosphere.”
Two Years of Parallel Measurements
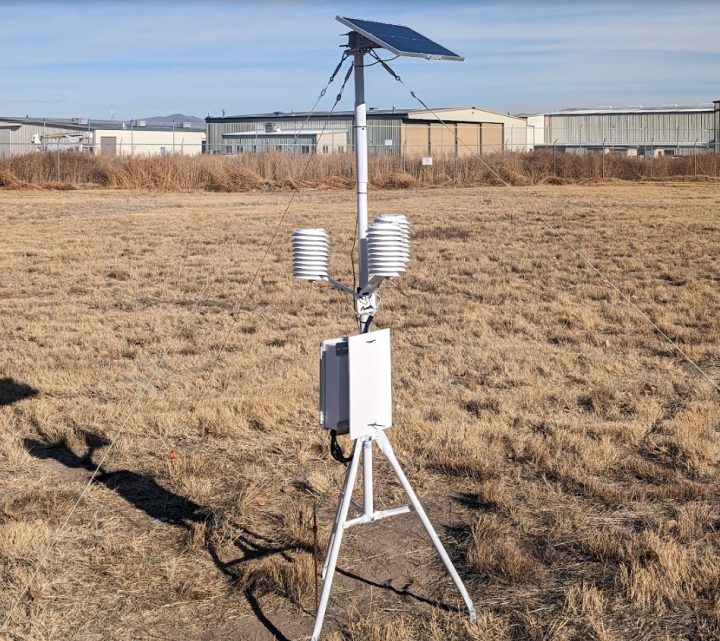
The GOATS reference station was installed in December 2023 near Reno-Tahoe International Airport, with the permission of the airport authority, and collected nearly two full years of measurements in parallel with the official airport station.
Researchers compared daily high (Tmax), daily low (Tmin), and daily average (Tavg) temperatures across 2024 and 2025. The results showed a consistent pattern: The official airport station reported warmer temperatures on the vast majority of days.
Average temperature differences between the official ASOS station and the GOATS station were as follows:
2024
- Daytime highs: +1.35°F
- Nighttime lows: +2.91°F
- Daily average: +2.13°F
2025
- Daytime highs: +0.64°F
- Nighttime lows: +2.20°F
- Daily average: +1.42°F
The airport station reported warmer nighttime temperatures on more than 90 percent of nights during both years of measurement.
Nighttime Temperatures Show the Largest Difference
Researchers found the greatest contrast between stations in overnight minimum temperatures. This pattern is a classic indicator of the Urban Heat Island (UHI) effect, in which heat absorbed by pavement, concrete, and nearby infrastructure during the day is released slowly overnight.
Because climate datasets often rely on daily average temperatures – calculated using the daily high and low – elevated nighttime temperatures can significantly influence long-term climatic temperature records.
“Urban heat island effects are well documented,” Watts said. “The Reno experiment shows how strongly these effects can influence measurements when instruments are placed near artificial heat sources.”
Confirmation of Earlier National Findings
The Reno experiment builds on the findings of The Heartland Institute’s 2022 report “Corrupted Climate Stations: The Official U.S. Surface Temperature Record Remains Fatally Flawed,” which documented widespread siting issues among official U.S. weather stations.
Unlike earlier surveys that examined station placement, the Reno experiment provides direct side-by-side measurements taken under identical weather conditions.
“This project provides a real-world demonstration of how microsite exposure affects the temperatures being reported,” Watts said. “It shows that measurement integrity must be examined before drawing conclusions about long-term climate trends.”
Implications for Climate Data and Policy
Surface temperature measurements play a significant role in shaping public discussions about climate trends and informing energy, environmental, and infrastructure policies.
The report concludes that station placement and microsite exposure should be explicitly evaluated during climate data audits and policy assessments.
“If temperature stations are influenced by nearby heat sources, those effects must be understood and accounted for,” Watts said. “Otherwise, policymakers risk basing decisions on measurements that include localized heat contamination.”
About GOATS
The Global Open Atmospheric Temperature System (GOATS) is an independent surface temperature measurement network modeled after the National Oceanic and Atmospheric Administration’s United States Climate Reference Network (USCRN), the federal government’s highest standard for low-bias temperature measurement.
GOATS stations employ triple-redundant sensors, proper solar radiation shielding, and strict siting standards to minimize the influence of nearby artificial heat sources. They record temperature every minute and publish data openly without adjustment.
Reno, Nevada local TV veteran Mike Alger was instrumental in getting permission to place the GOATS station on airport property adjacent to the airport to ensure proximity. He had this to say after reviewing the results:
“For decades, I have suspected the temperatures at the Reno airport skewed significantly higher due to Urban Heat Island effect. This study very clearly shows that UHI is not only present, but dramatically present. The use of temperature records from this station, and many others like it, must be re-examined when it comes to assessing climate temperature history.”
Read the Report
The full report, “Global Open Atmospheric Temperature System (GOATS): What Was Accomplished in Reno,” is available here. Full data is available here. A technical whitepaper of the GOATS project is available here.
If you’d like to interview Anthony Watts, please contact Heartland’s Jim Lakely at jlakely@heartland.org or call/text 312-731-9364.
The Heartland Institute is a national free market think tank founded in 1984 that The Economist magazine called “the world’s most prominent think-tank promoting skepticism about man-made climate change.”
###
Long-time readers of WUWT may remember this study I did years ago. It took me awhile, but I’ve proven the temperature issues with Reno are NOT climate change related, but bad station placement.
UHI is real, in Reno at least
Anthony,
Thank you for this demonstration. In an ideal world, responsible authorities would conduct this type of experiment before declaring a location as appropriate for purpose.
Would you at Heartland please consider a future policy to curtail use of Taverage, defined as half the sum of Tmax and Tmin. The latter pair should not be averaged because they are caused by dissimilar processes. Tmax is mostly set by a daily decrease in incoming solar radiation, while Tmin is mostly set by a nightly pattern of infra red radiation towards space.
For an analogy using aircraft velocity, indicated air speed and speed over the ground are both commonly measured but are not averaged because their sources are dissimilar. Geoff S
Good point, but…when writing press releases, we have to use terminology already accepted in order to dispute it in the discussion space.
Disputing the use of Tavg doesn’t mean you have to use it. A simple statement at the start of anything you write stating “Tavg cannot distinguish between climate states since two different climates can have the same Tavg. Instead we will analyze Tmin and Tmax separately.” should suffice to get the idea across that climate science is using a faulty metric.
Bravo.
When I was still a long way from leaving school, I learnt that the word “average”, when applied to a group of numbers, could be understood as three different measures the arithmetic mean, the median or the mode. As I progressed I learnt of other measures such as the geometric and harmonic means.
Climate scientists, for the most part not being mathematicians, tend to believe that (Tmax+Tmin)/2=Tmean=Tavg provides a close approximation to the average temperature over a given period of time.
Even ignoring the fallacy in deriving Tavg identified by sherro01, it is worth noting that Tmax and Tmin, as used by Climate scientists, are merely two points on a continuous line measuring temperatures throughout a 24 hour period. It is highly unlikely that, for any particular day, this line lies above a horizontal line representing Tavg for 12 hours and below for a similar period.
It is even less likely that the sums of the distances between the continuous line above and the continuous line below the horizontal line cancel each other out. Yet neither Tmax nor Tmin, the measures used to derive Tavg, have been weighted, either for duration or for intensity. Tavg is not fit for purpose.
Tim Gorman’s suggestion makes a lot of sense.
That continuous line does not have a constant slope. The daytime temp is sinusoidal and the nighttime temp is exponential decay. There is no way these are going to cancel out based on the mid-point horizontal line.
Climate science (and their supporters here) won’t even admit that the earth loses more heat to space during the day that it does at night. (T^4 is greater when the temp is higher, i.e. during the day)
Is it correct to label the airport temperature station as badly placed? Air density varies with temperature, higher temp – lower density and the temperature varies with sunlight (or not) on the pavement, wind speed, jet exhaust and probably other factors as well. The sensor is needed for aircraft operation but bad for climate studies. I have no doubt that many climate “scientists” are well aware of the need for runway temperature values and well aware that pavement and other non-weather/climate factors serve to alter the values but use the data anyway. So just why are such sensor data allowed in climate studies?
Badly placed for CLIMATE OBSERVATIONS. Perfectly placed for RUNWAY OBSERVATIONS. Problem is that the ASOS network isn’t fit for purpose for climate, but climate scientists don’t care.
How much does its temperature reading go up every time a jetliner takes off or lands past it?
Very little. Modern high bypass engines mix ambient air with the hot exhaust in proportions from 5 to 12 times more bypass air than the hot engine core exhaust. And if you compare the volume of engine exhaust as compared to the volume of wind driven air over the area of the engine’s path down the runway, the wind dilutes the exhaust by several orders of magnitude more than the volume of that exhaust at even minor crosswind speed components.
Stand behind your car’s exhaust and see how far away you can detect it’s hot exhaust – a few feet at best due to mixing with ambient air. Yes jet engines are 10-20 thousand horsepower compared to 200 in the car, but airport stations are hundreds of feet from takeoff locations, and at landing the engines are at idle. (and airport stations tend to smooth out spikes as their purpose is for aviation safety – the air temperature and hence density is a critical factor for take off thrust, weight allowable, etc calculations that EVERY airliner performs for every takeoff and landing based on the actual conditions on the runways)
“Airport stations are hundreds of feet from” jet engine exhaust. Mostly but not always.
“(and airport stations tend to smooth out spikes as their purpose is for aviation safety” Not always. Also, Nyquist sampling and averaging will raise the average based on the spike as part of the smoothing.
You don’t know what you are talking about. The exhaust from a jet engine can be over 600C and the engines are not idle on landing but up to 70% with reverse thrust selected. Most busy airports around the world will often have landings and take offs every 30 seconds, especially with more than one runway in operation and the volume of hot air from aircraft will be far greater than surrounding air.
The engines on a B737-800 will produce thrust that is equivalent of about 70,000 hp. and each engine on the B777 produces over 100,000 hp. With thousands of hours of airline flying and 54 years in aviation I say most of what you said is incorrect.
Sorry R.K. but you are mistaken. Minimum safe aircraft spacing is 2 minutes for landing and taking off from the same runway. And you failed to read my post, or fail to comprehend what bypass air entails. The engine core has an exhaust about 2 feet in diameter, but the huge fan at the front of the engine can be as large as 14 feet in diameter for the 777 engines. Those large fans blow cold ambient air past the engine core and provide 80% of the thrust out the back. This cold bypass air both mixes with the hot core exhaust, and provides a sound dampening effect. So yes core exhaust is around 4-500 C, but the bypass air dilutes and brings that core temp way down.
Yes, reverse thrust can be up to 70%, but percentages of turbofan engines are tricky as they are highly non linear. 70% of N1 speed can be only 50% of the available thrust as one example. And reverse thrust is only applied for a small proportion of the landing roll, as compared to takeoff thrust and roll distance.
Let’s examine your claim of the 737-800 engine power. The CFM-56 engines each can produce 24,000 lbs of thrust, but are typically derated for majority of takeoffs to either 20,000 or 22,000 lbs thrust. But that is not power. To determine power, the formula is thrust in lbs x speed in mph, divided by 375 for result in horsepower.
So if we take 22k each for total of 44,000 x take of speed of 150 mph which is 6,600,000 divided by 375 we arrive at a power at Vrotate of 17,600 horsepower.
Now for the 777 those engines make between 75,000 and 115,000 lbs of thrust each. So if we take the median, say 90,000 each and Vrotate of around 173 mph we get a total power at rotation of 83,040 horsepower.
Surely you do not contend that the 777 vs 737 ratio of takeoff engine power is 1.25 while their gross weight ratio is 4.2 now do you? Their power ratio as per the calculation above is 4.7, which more closely agrees with their weight ratio.
And to put a finer point on your mistaken claims, at 35,000 feet those CFM-56 engines only deliver about 6,500 lbs of thrust each, but they are going 500 mph (which is 17,333 horsepower)
I am glad you see your statement that airport observation stations are fit for their intended purpose, i.e. aviation safety. But they are not fit for climatology purposes. However I do not see this distinction in your article, or the many rants against bad station data. Would it not be more appealing to convince the general public or lawmakers to acknowledge that airport data is correct for airplane safety, but not for general climate analyses? Leaving out their fitness for intended purpose makes it sound like you are in favor of canceling or moving airport stations which would make them unfit for aviation safety.
Language does matter.
Good point.
I imagine “climate scientists” who “identify” as such see it as a benefit – anything that pushes the propaganda.
As such it should ONLY be utilized for Airport Operations and not Climate Data.
That was my first thought. It’s not badly placed it’s badly used. The same can be said for all the airport weather stations. They are necessary for aviation but should never be used for any other purpose.
I suspect airport records are used because they exist. Early airports may have had grass runways and the planes were biplanes. Assuming the thermometers weren’t mounted on a building, those records might be OK for climate data.
But once runways became concrete …?
“So just why are such sensor data allowed in climate studies?”
Tradition. Climate science will tell you that they must use measurement data like this in order to achieve a minimum “sampling error” as well as to create long records of temperature data using measurements from the 1800’s. 1. The way to fix sparse sampling is *NOT* to use bad data. 2. You do *not* need long records dating back to the 1800’s to monitor “climate change”.
More to the point, if you don’t HAVE long ‘unpolluted’ temperature records for a given location, stop pretending you do.
Especially when they get at what was once data (i.e., instrument measurements) with their “adjustments.” Think about the pattern of those – typically OLD data is being adjusted DOWN and recent data is adjusted UP.
Which means they start with data already polluted with UHI effects and pile additional imaginary “warming” on top of THAT. 🙄
The “long record” excuse doesn’t even make statistical sense.
If you are calculating how precisely you have located the mean of a set of data, and you have multiple samples that are large enough, the standard deviation of the sample means won’t change much from dropping or adding records.
SDOM = SD_(population) / sqrt(n)
If n changes from 10,000 to 9,999 your SDOM isn’t going to change much and neither will the SD_(population). You don’t need to make up hokey data elements to bring the sample size back up to 10,000
Quote “Reno is often cited as “the fastest warming city in the United States,” with the blame being placed squarely on climate change.”
No. No. A thousand times no. A warming city IS a change of climate. It is NOT caused by a change of climate.
These things are not complicated.
Welcome to Reno the
BiggestWarmest Little city in the World.There was once a time when Warm meant Friendly and Gay meant Happy. Now, not so much.
I wonder how many Joules/m^2 are emitted by the city with all the AC, lights, etc.
In addition to thermal energy retention by the buildings and roads, etc. (UHI), the specific heat capacity for the lower 100 feet or so of the atmosphere one can calculate the temperature rise directly from the Joules emitted at ground level.
Great post, AW. Congratulations.
I was curious about whether the now proven large discrepancy between ASOS and GOATS was deliberate, incompetence, or something else. So just did some quick Google AI enabled research.
The Reno Airport ASOS, KRNO, was emplaced 5/2007. It strictly followed rigorous placement standards developed earlier in 2007 jointly by NOAA, FAA, and DoD. Their standards intent was to provide the best possible information to aircraft taking off and landing at major airports.
That same year, WUWT published on the then newish CRN high quality climate station placement standards. By CRN standards, KRNO using the then also new NOAA/FAA/DoD standard is a CRN Class 4 (very poor)—with likely error >=2C, so not fit for climate purpose.
So the answer is both something else and incompetence. The something else is the two very specific standards were designed for very different purposes. The (deliberate?) incompetence is NOAA using the one for the other.
If that +/- 2C measurement uncertainty was properly propagated during data analysis it would highlight the uselessness of the data in tracking “climate change”. The true incompetence is the inability/unwillingness of climate science to properly apply metrology principles that are standard in other physical science disciplines.
“Climate science” abuses the word science continuously.
I couldn’t find any NOAA statement of class for ASOS stations. Examining WMO documents I would agree with your rating. Here is what WMO indicates for a class 4 station.
Note the bolded and underlined title. It is bolded in the WMO document also. It says an additional 2° C of uncertainty over and above the standard uncertainy.
I have worked with an AI to develop an uncertainty budget for ASOS stations. An expanded uncertainty of U = ±1.5°C is not unreasonable. Adding 2°C to that and one ends up with a total uncertainty of ±3.5°C.
Depending one airport traffic, that could be unacceptable for heavier planes.
Funny how that uncertainty disappears through averaging, smoothing, and finding the standard deviation of a mean by dividing by √n.
Well it doesn’t disappear, but they pretend it does.
Never attribute to nefarious activity that which can easily be attributed to stupidity or even taking the quick and easy approach (aka laziness).
I’m going with “D. All of the above.”
I remember when UHI was raised as an issue impacting temperature records. The CC proponents initially claimed that the impact was a fraction of a degree. Based on their reluctance to consider the impact of UHI, I suspect that the CC proponents were aware of the magnitude of the UHI impact of the Reno Airport station as well as other stations. Some of them had to know that UHI corrupted many of the temperature station records.
You’re not suggesting that the PROBITY of this station’s “data” is sub-par, are you Anthony?
What? It’s nose is smaller than average?
If it were Pinnocio, it’s nose would be much bigger than average.
Not just the data but also its analysis. Climate science ignores BASIC statistical methods and procedures used for data analysis as well as established metrology principles.
Is the GOATS project a non-profit than can be contributed to. I proposed donating to a similar concept in UK. Is their a target list of sites to offset obvious bad data?
And, if your GOATS site had used a Stevenson screen, its measured temperature would have been even lower.
no, it wouldn’t. read the whitepaper included in the report linked in the story.
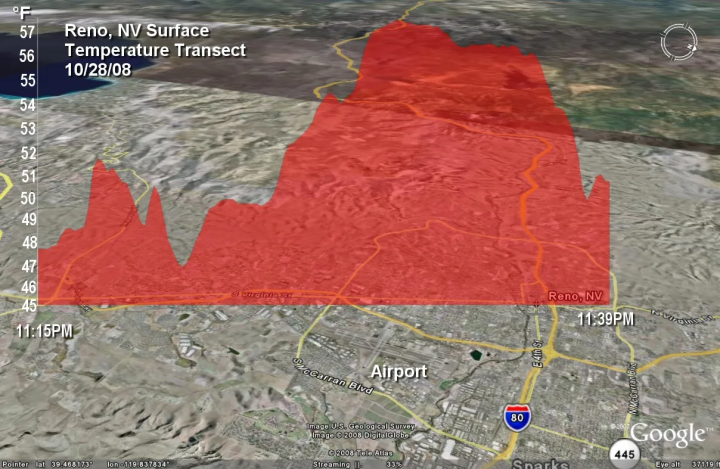
I do remember your drive across Reno to get the transect of temperatures. Always impressed by your motivation and follow-through. Years later you’re still gathering data on this city.
Aside from frying eggs on the streets, Reno is a fun place.
Is there any difference in elevation above sea level between the two sites?
I checked on Google Earth, and the elevation change is only 8 ft: 4406 ft for Anthony’s site and 4414 ft for the airport site.
For a Reno temperature check, I went to:
https://www.extremeweatherwatch.com/cities/reno/average-temperature-by-year. The Tmax and Tmin data from 1938 to 2025 are displayed in a long table. Here is the data for these two dates:
Year——-Tmax——-Tmin——-Tave Temperatures are °C
2025——-21.3——–6.2———13.8
1938——-19.1——–0.7———-9.9
Change—+2.2——+5.5——–+3.9
Range Tmax: 17.3–21.4
Range Tmin: -1.4—-6.3
Weather Station: Reno Tahoe International Airport 1937-2026
The biggest portion of the urban heat island effect is the increase in Tmin by +5.5° C This results in substantial increase in Tave of 3.9° C.
At the above website, you can for each year obtain Tmax and Tmin temperature data for each month. If you go to: https://www.extremeweatherwatch.com/cities/reno, all temperature, weather, and climate data are displayed from the beginning of the record to present . At the end of page the is list of options for display of data.
In the “Select Cities” box, enter the name of the city starting with a capital letter. If the data is in NOAA data base, the name of the city will apear below the box. Click on it to obtain the data.
You can also obtain data for a country, for example the United States:
https://www.extremeweatherwatch.com/countries/united-states/average-temperature-by-year. The temperature data for all countries starts in1901 and up to the present.
Be sure to check the home page: https://www.extremeweatherwatch.com.
There are links in light blue to a great many the weather stations located around the world that are in NOAA’s data base
I went and got average annual temperatures for several locations in Kansas.
city max min
Topeka 66.8 44.7
Abilene 69.4 46.1
Lawrence 67.3 43.7
Salina 68.4 45.0
These stations are all within 100 miles or so from each other. Big differences in temperatures. Yet climate science thinks that they can accurately use the stations to “homogenize” missing data for a station.
A second grader could identify the problem with this assumption by climate science.
Did you correct for the effect of altitude, about 1000′ in that sample?
The altitude difference between the four cities is 350 ft. That would account for about 2°F difference. However, the point is that spatial nearness does not guarantee that homogenizing nearby stations is a correct thing to do. There are a quite large number of factors within a microclimate that vary between stations and result in varying temperatures. Homogenizing only increases the uncertainty in the “corrected” or imputed value and should be propagated into the uncertainty of any calculation using it.
Here in the UK during the TV weather forecasts, the guys/gals often say “temperatures will be “x” in the countryside, but it will be warmer in the cities” – words to that effect…
they KNOW there is a UHI effect…
I have seen UHI effects at my house. I live in a medium size city in an urban residential area. My outside thermometer usually reads 3-5 degrees higher than the airport temperature. BTW, I have verified the accuracy of that thermometer with a lab-grade mercury one.
And the airport temperature is probably inflated too!
Bravo.
If observations/experiments disagree with conjecture/hypothesis/theory, go back to the drawing board and come up with a more accurate hypothesis.
Science is build on errors, mistakes, and failures leading to learning and better understanding.
The real problem occurs when stations like this are used to “homogenize” missing data for a CRN station. It destroys the use fulness of the CRN network. The uncertainty grows each time an ASOS station is used to create data for a CRN station thereby destroying the “reference” part of CRN.
I don’t think anyone has evaluated how much missing data there is in CRN stations. I have been experimenting with using 5 minute data and was flabbergasted to see how much data was missing in the few stations I have looked at.
I have been developing a sum of 5 minute temps throughout a day from CRN stations. Out of 288 periods I use only those with 90% (260 periods) available periods. You can’t believe how many days are lost of Tmax and Tmin, and of course Tavg. This translates into highly uncertain monthly values and I really question how one can add months with missing days to those with fewer or less missing days and get a certain value.
Imputing values for large chunks is fraught with uncertainty as the missing periods and days grow. In my mind I have an aversion to creating “data” but it may be necessary. I am going to experiment with using ARIMA for each period in a month to derive predictions for missing information. We’ll see what uncertainty might derive.
What they “create,” “adjust,” or “estimate” is NOT “data.” But they act as if it is. And therein lies the problem.
Anthony,
Thank you for this study. This adds additional data indicating that Tmin is increased by the UHI effect. I remember reading a report that the number of rural temperature stations decreased significantly during the 20th Century. I do not remember the source. An increase in the percentage of urban vs rural stations could be expected to lead to an increase in Tmin and Tavg.
I’m shocked! 😲😲😲
Well, not really.
The “instrument temperature record” was never designed to measure changes to the climate over time. It was just there to supply weather information.
A sizable chunk of what they claim to be “global warming” is clearly “global urban heat islanding.” No matter how many times the Eco-Nazis attempt to claim otherwise.
Thanks Anthony, for all you do.
As I like to summarize this situation, in terms of our ability to measure “climate change,” the data is crap. And when the data is crap, so is your “science” which is based on that crap data.