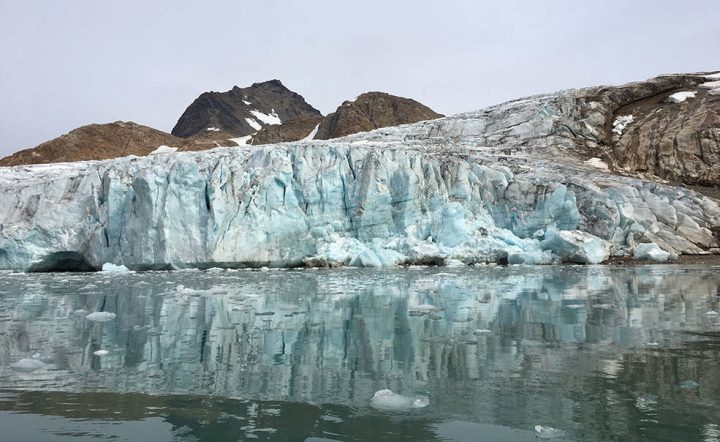
To learn how ocean water is melting glaciers, NASA’s Oceans Melting Greenland mission extensively surveyed the coastline of the world’s largest island.
The most important thing to remember about NASA’s Oceans Melting Greenland mission, which ended Dec. 31, 2021, may be its name: OMG proved that ocean water is melting Greenland’s glaciers at least as much as warm air is melting them from above. Because ice loss from Greenland’s ice sheet currently contributes more to the global rise of the oceans than any other single source, this finding has revolutionized scientists’ understanding of the pace of sea level rise in the coming decades.
These new, unique measurements have clarified the likely progress of future ice loss in a place where glaciers are melting six or seven times faster today than they were only 25 years ago. If all of Greenland’s ice sheet were to melt, global sea levels would rise by about 24 feet (7.4 meters).
But that’s just the tip of the iceberg in the story of this small plane- and boat-based mission. In six years of operations, OMG made the first scientific measurements along many miles of the most remote coastline in the Northern Hemisphere. The mission performed the most complete survey of the seafloor around Greenland’s coastline, including dozens of previously uncharted fjords (cliff-lined inlets clogged with icebergs from disintegrating glaciers), and measured how the ocean temperature changed from place to place, year to year, and top to bottom. To get this unique dataset, mission planes logged enough air miles around and over Greenland to circle the globe more than 13 times.
Preparation
More than 220 glaciers flow from Greenland into the ocean. Before OMG, scientists figured the ocean water swirling around and under these glaciers had to be contributing to their ice loss. But how much?
Satellite observations of sea surface temperature weren’t much help in answering that question. Around Greenland, the top layer of the ocean is extremely cold and not very salty, containing a lot of water from the Arctic, the freshest of oceans. A shallow glacier that only touches this layer melts slowly. But hundreds of feet below, the ocean is warmer and saltier. A deep-seated glacier is eaten away by the warmer water, losing ice four or five times as fast as a shallow one.
The only way to find out any glacier’s risk is to go to Greenland and measure the glacier and the seafloor and water in front of it. Scientists had been studying individual glaciers that way for years, but Josh Willis, principal investigator of OMG at NASA’s Jet Propulsion Laboratory in Southern California, wanted to get the complete picture: to measure all 220-plus glaciers for five years – the length of time available to missions funded by NASA’s Earth Ventures airborne research program.
“When we started to design OMG, we asked ourselves, ‘Can we do an experiment in five years that will tell us about the next 50?’” Willis said. Results have proved that they could. NASA even allowed them a sixth year of fieldwork to observe unexpected, rapid swings in water temperatures off Greenland’s west coast.
Operation
The mission’s first job was to map the seafloor around the island to see where deep, warm water can reach glaciers. A contractor completed most of the mapping using a research boat, and OMG Deputy Principal Investigator Eric Rignot of JPL and the University of California, Irvine led smaller surveys in following years to fill in missing sections.
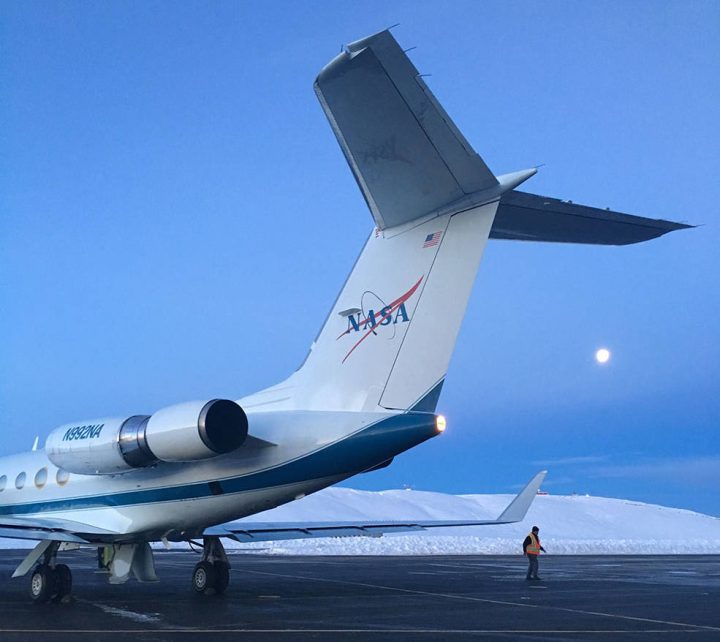
To measure the ocean temperature and salinity down to the seafloor, Willis ran a summer airborne campaign that dropped about 250 probes each year into the ocean at strategic locations around the entire coastline. Six summers of flying over the remote Arctic may sound more like an adventure than a research project, but, Willis said, “It’s only an adventure in retrospect. While you’re in it, you have your head down and you’re working as hard as you can.” For the scientists, the data streaming into their computer from the probes was excitement enough.
The detailed maps and temperature data collected by OMG show that two to four times as many glaciers sit in water that is several degrees warmer than previously thought and, thus, are at higher risk than anyone knew. Researchers understood that about a third of Greenland’s glaciers account for half of its ice loss; OMG found that all of these culprits reach down into warm water. Climate models that don’t account for the warm water’s effects underestimate glacial ice loss by at least a factor of two – in other words, missing half the sea level rise from this source.
Collaboration
OMG’s groundbreaking data has influenced many kinds of Arctic studies besides oceanography. For example, Kristin Laidre of the University of Washington is an internationally known expert on narwhals, Arctic whales with a tusk-like protruding tooth. She and Ian Fenty, an OMG co-principal investigator at JPL, developed a project that benefits both marine biologists and oceanographers: a research cruise to place OMG probes and acoustic sounders that record the presence of narwhals in front of West Greenland glaciers.
The probe data provides a close-up view of how much ocean conditions can vary in a small area, and Laidre hopes that, in combination with the sounder data, it will help explain why certain glacier fronts are especially attractive to narwhals. “We biologists can get a better understanding of animals and populations by working with physical scientists,” she said, referring to the OMG team. “To have a group of scientists who want to collaborate is really great.”
Continuation
The end of the mission doesn’t mean the end of all new data from the Greenland ocean. In 2021, the team dropped a few longer-lived probes in areas where changes in ocean temperatures or circulation are not fully understood. These probes “winter over” below the surface, continuing to bob up and down through the water to collect data that will be read remotely when the ice melts next summer.
And scientists in many fields will continue to draw on OMG’s observations for their research. To date, about half of peer-reviewed journal articles using the data are written by researchers outside the mission’s science team – an unusually large portion. “We’re seeing a lot more science than we originally planned,” Willis said. “Those papers aren’t going to stop.”
Jane J. Lee / Andrew Wang
Jet Propulsion Laboratory, Pasadena, Calif.
Great – that’s the way forward. Data – Data – Data. The more the better. But to collect enough data to be able to state with any certainty what the world’s climate will be in 100 years time is next to impossible – or will need perhaps 1000 years of patient collection of myriads of data from myriads of areas.
OMG!!
A great name for alarmist Greenland-dystopia.
OMG! Glaciers are touching seawater!
Sure that never happened before.
OhMyGod – “temperature data collected by OMG show that two to four times as many glaciers sit in water that is several degrees warmer than previously thought and, thus, are at higher risk than anyone knew.”
So is the Water Degrees warmer than before, or just that they Never Thought it could be?
If it has always been this warm, where is the risk?
In the meantime 76% of beaches are stable or accreting.
“Analysis of the satellite derived shoreline data indicates that 24% of the world’s sandy beaches are eroding at rates exceeding 0.5 m/yr, while 28% are accreting and 48% are stable”
https://www.nature.com/articles/s41598-018-24630-6
and of course the reasons behind the ones that are eroding could be beach mining –
“Coastal sands are being heavily mined, diminishing the world’s beaches. Every year, billions of tons of sand from beaches, ocean floors and rivers are scooped up to make a plethora of objects, such as concrete, microchips and even toothpaste, TakePart reports. Conservationists warn that the industry is damaging ecosystems and changing coastal water flows.
As a result, beaches and communities are becoming less resilient to storm surges and flooding – a poorly timed side-effect in the face of climate change and rising sea levels.
“No one ever thought we’d run out of sand,” University of California at Santa Cruz Institute of Marine Sciences director Gary Griggs told TakePart. “It’s a devastating problem, but nobody in the U.S. has a concept of it because we go to the beach and see this big wide expanse of sand.”
https://weather.com/science/environment/news/coastal-sand-mining-erosion-beaches-disappearing-resources
The “health” of a continental glacier system, discharging ice into the ocean at its margins, depends on two main factors, and this NASA “study” only deals with the least important one. The heart of a glacier system is the recharge zone, where snow falls, accumulates, and compresses into sufficient ice that the load starts movement down slope. Sure, increased melting at the glacier-ocean interface can slightly increase the flow of ice in the lower reaches, by reducing bed-load where the glacier is grounded and by melting floating ice. But if the recharge zone is still accumulating snow and adding to the load the glacial system continues to function, minus a very small (less than 1%?) part of the overall ice inventory. Notice in the video presentation NASA does now show the incredible ice mass covering the center of Greenland, they only make one comment about how it is two miles thick. So we have a steady rise in sea level, the Greenland glacial recharge zone is healthy (remember the WW2 airplanes buried 50 meters deep under ice on Greenland, one extracted and called “Glacier Girl”?), and NASA fools around with a peripheral issue?
The most interesting line is the second sentence which states that Greenland melting ice is the largest contributor to sealevel rise. What happened to Antarctica? Not melting anymore? Quietly shovelled under the carpet?
What proportion of sea level rise is due to melting ice and what proportion is due to the thermal expansion of sea water due to the slow increase in temperature?
I read somewhere a couple of years ago that for an increase from 10’C to 11’C would mean a couple of feet increase, which I thought was quite high. It’s a complex thing because various parts of the ocean are at different temperatures and warming at different rates.
But it would be good to see a “Willis E Type” analysis.
Most of the oceans are at almost freezing temperatures, on the top few meters get ‘warm’, even in the tropics or equatorial regions. You could take the surface area of all the oceans, multiply by, say…. I really don’t know… but not more than 10 meters, to get the volume affected by any warming, multiply that by the thermal expansion coefficient and by say 1.5°C, to cover the warming over the next century, to work out the volume change.
I won’t do the math, because the oceans would take forever to warm that much because they have much more mass than the atmosphere, and the climate doesn’t follow neatly draw straight trend lines, likes to wiggle around decades and centuries long patterns.
So really useless to waste so much money on climate scientists over a 1.5°C/century warming… Oops my bad, there’s no way we know the “Earth’s Temperature” that precisely, so what-the-heck, let’s round it up, it’s still not scary at 2°C per 100 years, especially if the equatorial ocean regions are not going to go over ~30°C.
Good point. And if Greenland is the main contributor and IF the melt rate has increased by “6 or 7 times in the last 25 years” as claimed, then there should be an easily measured acceleration in sea level rise measured by tide gauges. Hmmm…tide gauge data (adjusted for land movement) shows no acceleration. Claim falsified by observation. OMG, more alarmist misinformation.
“over the last 25 years” – from a historically cold period to our barely comfortable period. Convenient statistics, like the ones shown to Boris.
How has journalism complelely been corrupted that obvious slight-of-hand tricks like this don’t get called out?
Zwally et AL 2021 Antarctic Ice:
Source
the name of the project was really “Oceans Melting Greenland mission”?
I suppose with a name like that- it was expected that they’d find melting ice. Try again but change the name to Oceans Greenland Not Melting mission. You get what you pay for.
Melting Arctic & Greenland Area’s
Mapping Arctic & Greenland Areas … better.
“OMG “
That could be taken quite literally
“ice loss from Greenland’s ice sheet currently contributes more to the global rise of the oceans than any other single source”
The Thwaites glacier could not be contacted for comment.
” If all of Greenland’s ice sheet were to melt, global sea levels would rise by about 24 feet”..
and IF you were to tow Greenland to the tropics, that might just happen. If it stays where it is, it’ll go on accreting about as much snow and ice as melts every year.
It’s to be expected that the Sierra Club would raise the specter of the entire Greenland ice cap melting but for a government agency to do so is extremely unprofessional. And, how is this topic the subject of the Jet Propulsion Lab? I’d rather have them working on trying to determine the propulsion system of those UAPs seen over our aircraft carriers.
It’s an island Jim…_
https://www.britannica.com/story/is-australia-an-island
But using NASA’s calculations what would be the effect?
“(4) Calculate the sea-level-rise answers by dividing the water volumes determined in #3 by the global surface-water area determined in #1, thereby spreading the effect of the ice sheet’s water throughout the expanse of the Earth’s surface-water area. The answers are:
(a) (2,343,728 cubic kilometers)/(361,132,000 square kilometers) = 0.0065 kilometers = 6.5 meters for the Greenland ice sheet;
(b) (26,384,368 cubic kilometers)/(361,132,000 square kilometers) = 0.0731 kilometers = 73.1 meters for the Antarctic ice sheet;
(c) 6.5 meters + 73.1 meters = 79.6 meters for Greenland and Antarctica together.” 79.6m = 261.1549 Ft
http://pumas.jpl.nasa.gov/files/02_10_97_1.pdf
Note the division by the same area, no matter the added ice volume.
So by NASA reasoning we will get meters of sea level rise, but still have the same sized ocean (361,132 Km^2). No place gets drowned by the new rise, so why worry.
The Holocene Optimum was at least several degrees warmer than it is today and lasted for over 10K years. Greenland’s glaciers survived that.
I believe there was a stat around “record”melting one year for Greenland where it lost a certain amount of tonnage. If every year did the same it would take 12,500 years for it to melt. I don’t think people understand the sheer volume. I certainly didn’t until those numbers popped up!
Who are these clowns?
I mean REALLY, who or what are they……
Quote:“NASA’s Oceans Melting Greenland mission extensively surveyed the coastline of the world’s largest island.
Even today’s schoolkids would venture that Australia is bigger, by a factor of well over 3 (three)
Or, to be precise:
3.5512465373961218836565096952909 times bigger
Australia is a continent. Islands are surrounded by water. I’m still trying to figure out what surrounds continents.
surfers?
Oh, it can’t be true but all land is surrounded by water…..lol
Oceans?
An island can be a continental island, like Great Britain or Newfoundland, which sit on continental shelves of their “parent” continents. Or it can be an oceanic island, like Iceland or Hawaii. Greenland sits on continental shelf that is only tenuously connected to North America, so I would call Greenland a continent. Madagascar and New Zealand too, they have their own bits of continental shelf that are not connected to other continental shelves, so they should be continents.
Since we have come to understand the difference between continental crust and oceanic crust, the definition of what a continent is should probably be revised.
Why is India a sub-continent, and not Arabia, or Iberia, or Scandinavia?
Good subjects for heated barroom discussions – absolutely nothing depends on the outcome.
It’s an island Jim…_
https://www.britannica.com/story/is-australia-an-island
Given it’s rather tenuous connection to any other land, Africa is very close to being an island, too.
I suspect both Africa and S. America, were they to disconnect from Europe or N. America respectively, would be big enough to be considered continents in their own right.
I’m still trying to figure out how Asia and Europe are considered separate continents.
the Ural mountains.
All this time I thought South America was a continent.
Since the advent of the Suez canal, Africa can be considered to be surrounded by water.
The same might be said of S. America with respect to the Panama Canal, though the Panama Canal does have locks.
Wait a minute. Where’s the “worse than we thought” claim from the tax-dollar leaches?
Regards,
Bob
There was a comment that the deep waters were warmer than these “scientists” thought.
Though there was no documentation of what “scientists” thought the temperature of those waters were prior to this mission, and no documentation that those warmer waters, weren’t always this warm.
Obviously, they were keeping their thoughts to themselves until someone funded a 5 year research project so they could claim knowledge that “it is worse than we thought”.
Summit camp , Greenland- Brrrr
-18C
http://www.summitcamp.org/status/webcam/
A bit colder according to the DMI Promice data.
EGP 2022-02-01 00:00:00.0
Temperature (°C): -53.19
Windspeed (m/s): 5.02
Incoming Sunshine (W/m²): -1.22
http://polarportal.dk/en/greenland/surface-conditions/
Mass accumulation pretty much on average too
Ben, is incoming sunshine really negative? Or typo?
Your temperature is “As of 08/08 06:39“. No mention of what year, but never the less, it is not current.
So, what moron did not know that glaciers in contact with ocean water melt? We really had to piss away all these millions upon millions of tax dollars to prove what anyone with ice in a drink can prove for free? College education is detrimental to human intelligence, that is all this “study” proves.
Bingo!And when that ice finally melts completely,alas,the water level has not changed.I did this experiment just to see for myself.I had believed that the level would rise.
That’s only true of glaciers that are free floating. Many of these glaciers are still grounded.
Glaciers can overhang sea water only for so long before they calve. Heavy thick amounts of ice with many vertical fractures is not strong.
It still doesn’t explain why the water down not cool down drastically on contact with the ice. To hear the moron flying many times around the Earth all around Greenland, the water in contact with the glaciers is permanently warm.
It seems that NOAA made similar claims about glaciers in Antarctica being melted underneath and causing sea level rise.
Now, they have immense amounts of data; taken from various airplanes on individual routes measuring, what?
What scale?
What consistency or constancy?
What accuracy?
How do they merge data?
etc. etc.
If the water is a bit below freezing (salt water, right) and the glacier is obviously below freezing, then the glacier isn’t going to melt. No one’s going for a swim in Arctic or Antarctic waters, even in the middle of summer.
That’s why those doomsday glaciers, that the media soils themselves when thinking and unfortunately reporting about, float for years when they finally break off and float away.
How do glacier get in contact with the ocean? Answer by growing.
Gulfstream jets and not piper cubs? I wonder how much all those exhaust gases added to the “increased” warming!
Off topic but
https://www.bbc.co.uk/news/science-environment-60203674
A slide show that Prime Minister Boris Johnson says helped convince him on climate change has been revealed for the first time.
The slides used to “teach” him about climate science have been released after a Freedom of Information request by UK climate website Carbon Brief.
While Mr Johnson has urged action on climate change, he previously, as a journalist, expressed scepticism.
AKA The Peppa Pig Vroom Vroom guide to Climate Emergency
https://www.youtube.com/watch?v=8zHURhs0DbM
At about 28 seconds although the lead up is intereting too
All that’s now missing is actual acceleration in the rate of sea level rise. It’s still going up at 1 or 2 mm/yr like it has for the past 6,000 years.
Previous to that it was shooting up like a rocket –
I’m looking at the picture of the plane and I am wondering, what is the ‘can’ mounted behind the engine? An Afterburner?
Never mind, I figured it out. It’s a HUSH kit.
The didn’t want to wake up the polie bears?
This bit is certainly nonsense: “…a place where glaciers are melting six or seven times faster today than they were only 25 years ago.”
“25 years ago” is a convenient time frame, because it compares satellite measurements to what is mostly speculation — and what they speculate is implausible.
I like the idea of the Greenland subsurface coastline measurement survey, but its value is only as good as the credibility of the people running the project. If they’ll misrepresent one thing, then what else are they misrepresenting?
Over the period of time for which we have GRACE (satellite gravimetry) measurements, there’s been no sustained acceleration in Greenland ice loss trend. Here’re the ice mass estimates which DMI has derived from GRACE measurements, relative to a 2002 baseline. (Note that the full 5000 Gt range of the vertical axis represents just 0.19% of the mass of the Greenland Ice Sheet.)
If JPL’s Media Relations Specialists really believe that Greenland’s ice loss accelerated by 500-600%, conveniently just before satellite measurements began, then to what do they attribute the cessation of that supposed acceleration?
We don’t have satellite measurements from which Greenland’s ice loss rate >25 years ago can be determined with confidence, but if Greenland’s ice loss had actually accelerated by 500-600% it would have had a noticeable effect on sea-level rise in the tropics, especially on the opposite side of the Earth, in the mid-Pacific (far from the distorting effect of the GIS’s gravity field).
The highest quality measurement record from the tropical mid-Pacific is from Honolulu. They have 117 full years of continuous sea-level measurements, without even a single month gap. It is also a site with small tides, and little or no vertical land motion (though the whole island chain is moving NW about three inches per year). Here’s what it looks like graphed (and juxtaposed with CO2 measurements):
Here’s an interactive version of the graph:
● https://sealevel.info/MSL_graph.php?id=Honolulu
Here’s NOAA’s version:
● http://tidesandcurrents.noaa.gov/sltrends/sltrends_station.shtml?stnid=1612340
So, where is the evidence of a dramatic acceleration in Greenland ice loss? I certainly don’t see it.
Over the last decade sea-level rise has accelerated sharply along the U.S. southern Atlantic coast, but that’s probably due to Gulf Stream variations:
● https://sealevel.info/MSL_graph.php?id=Key+West
● https://sealevel.info/MSL_graph.php?id=Wilmington
It hasn’t affected New York much:
● https://sealevel.info/MSL_graph.php?id=Battery&c_date=1930/1-2024/12
The longest sea-level records are in northern Europe, but that’s close enough to Greenland that when Greenland loses ice it has reduced effect on sea-levels in northern Europe, due to gravity changes. Some long, high-quality European tide gauge records show a slight acceleration, others don’t;
● https://sealevel.info/MSL_graph.php?id=Harlingen&boxcar=1&boxwidth=5 (perfectly linear)
● https://sealevel.info/MSL_graph.php?id=Swinoujscie&boxcar=1&boxwidth=5&c_date=1890/1-2024/12 (slight acceleration)
Hawaii, in the middle of the tropical Pacific, is a nearly perfect place for detecting Greenland ice mass trend changes. Unlike the north Atlantic and Baltic (where the longest measurement records are), it’s not appreciably affected by Greenland’s gravity. Unlike the U.S. Pacific coast and the western Pacific rim it’s not much affected by ENSO slosh. Unlike the U.S. Atlantic coast it’s not affected by the Gulf Stream and AMO.
The sea-level trend at Honolulu has been almost perfectly linear for 117 years. So if Greenland rate of ice loss is really much more rapid now than it was ≥25 years ago, as JPL claims, then why hasn’t Honolulu’s sea-level trend accelerated?
P.S. — This bit from the article is also misleading: “If all of Greenland’s ice sheet were to melt, global sea levels would rise by about 24 feet (7.4 meters).”
It’s misleading because they fail to mention how implausible that is, or long that would take. At the current rate (estimated by DMI from GRACE measurements) of not quite 5000 Gt per 20 years, to melt the whole GIS all would take over 10,000 years.
According to the warmie scientists, the oceans have warmed up by only 0.03C.
Exactly how much melting does that much warming cause?
And that level of alleged warming is well within error ranges of the equipment; if the equipment was calibrated when it was installed in a lab.
Not as deployed in the ocean on unique equipment floating/diving around the oceans.
Can someone with some aeronautical knowledge tell me what is going on with the engine on that plane in the picture above?
Looks to me like a hush kit, which is a way to quiet down the noise pollution of older aircraft engines.
They claim that the water is warmer than they previously thought.
Do they provide any evidence that the water hasn’t always been this warm?
“Do they provide any evidence that the water hasn’t always been this warm?”
Supposedly, this is the first time the temperatures have been measured at these glaciers, so I don’t see how they know the water is warmer.
Perhaps the water is warmer than they speculated it would be, and that’s what they mean. Alarmist Climate Science is made up of a lot of speculation. This may be another case of that.
They claim to air drop sensors around Greenland.
It is extremely unlikely that sensors were dropped in the same exact positions, or even close to the ice…
Meaning they measured temperatures far from the ice and not under the ice.
Same assumptions and mistakes they made in Antarctica.
Monomaniacal is a word I’ve seen a lot in assocation with COVID, but it’s so much more. Paraphrasing the most important axiom about “truth” and power: When you think you’re a hammer, the whole world looks like nails.
How does heat from a warming atmosphere get to the seafloor so quickly? Besides going against buoyancy effects, aren’t seafloor currents very slow? Wouldn’t there be a lag of a few centuries?
Salinity can have a greater effect on density than temperature. So colder but fresher water can, indeed, be less dense than warmer, more saline water.
Water from rivers & rain, or meltwater from glaciers, can make ocean surface water fresher; evaporation from the surface can make it colder and saltier.
My understanding is that a full AMOC cycle is about 1000 years, but where the surface currents sink and begin their deep ocean return trip toward the tropics is right around Greenland. So, in theory, it shouldn’t take anywhere near that long for surface temperature changes to affect the deep ocean near Greenland.
However, the AMOC has a built-in thermostat mechanism. In the extreme north Atlantic, warmer water reduces sea-ice coverage. Reduced sea-ice coverage drastically accelerates transfer of heat from the ocean to the air, which warms the air (causing “Arctic amplification” of warming), but cools the water, by evaporation & heat exchange with the air.
When there is less ice on the ocean, there is far more heat transfer from the ocean to the air:
It’s a negative feedback loop:
warmer water temp → less sea ice coverage → more evaporation → cooler water temp
The ice coverage “thermostat” helps prevent surface water warmth from making it into the ocean depths, so in the context of water temperatures it could be called “Arctic attenuation” rather than “Arctic amplification.”
Did they factor in that “hot springs in Greenland are a common natural phenomenon”?
On Disko Island there are thousands of hot springs though on the other side of the country in East Greenland there are only just over 100. However, these springs are warmer than the Disko island ones, with temperatures of up to 50-60 degrees C -122 – 140F.
What might be happening on the ocean floor around Greenland? 🙂
https://visitgreenland.com/about-greenland/hot-springs-greenland/
Glacier’s largely melted during the last warming period then expanded during the little ice age, and are now melting again. Was London under water in 1000 AD. I didn’t think so.