Sky News Australia
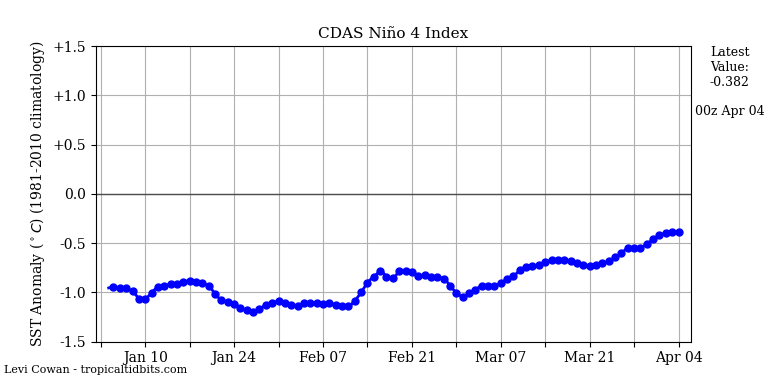
Former JCU Marine Physicist Peter Ridd says the Great Barrier Reef is now experiencing “record high coral cover”.
“This is data that’s been accumulated over a little while now and it shows … it’s actually at record high coral cover,” he told Sky News Australia.
“We’ve got more coral on the Great Barrier Reef now than we did when records began in 1985.
“We’ve got twice as much coral as we had after huge cyclones went through the reef in about 2011 and 2012, and this record-high coral cover is despite supposedly having three catastrophic unprecedented bleaching events in just the last five years.
“So you’ve just got to wonder were those bleaching events maybe as catastrophic as these experts supposedly claimed.”
Universities in Australia, particularly James Cook University (JCU) in Townsville, are plumbing historical lows where it applies to academic freedom and the ability to question the current dogma. Peter Ridd, a passionate and renowned environmentalist, has come out and refuted alarmist pronouncements on the health of the Great Barrier Reef thereby potentially threatening the flow of research dollars to JCU. The response from JCU has been to harass and then deprive Peter Ridd of his academic tenure.
Another example of universities toadying up to moneyed interests has been when Queensland University, Brisbane, has dismissed its student Senate representative, Drew Pavlou, for publically criticising the Chinese Govt for its treatment of the Uighur minority in Sinkiang Province. University vice chancellors in Australia are drawing very healthy salaries these days and the consequence is for them to, first and foremost, toady up to the source of the cash.
1000% The government appears to have no stomach to correct the situation !
As I understand it, they are happy to let Chinese students into Australia while still not letting our own citizens leave the country, nor return in any number.
So now it’s celebrities, toady politicians and Chinese students who are exempt.
“…thoroughly vindicated by this latest report.” in the video, near the end. Does this vindication carry any legal weight? Does the Professor get his job back? Will the Doomsday CAGW crowd apologize? No, no, and no. The cultural degradation associated with the Political Science of Climate Change will take many years to undo. I hope we get started soon.
Wonder if we’ll see this on the news tonight…
You’re slightly more likely to see this on the news than the anti-mandatory vaccination protest by nurses and health care workers in Melbourne yesterday. But I would still put this as a 0% chance of showing up on the Telly, on any station. We are living in a police state, truth and justice have been cast aside.
Sounds familiar: in Switzerland there is hardly any news on official media regarding the massive protests going on in other EU countries. Officially, there’s no deaths and only very rare adverse events due to the vaccination, which is portrayed as the safest and best tolerated vaccine in history! We’re having a vote Nov. 28 to cast away the Covid measures, but since a majority has already been vaccinated and no one sees what’s going on outside the country, or what is going to come wrt. further restrictions, loss of rights and freedoms, I doubt it’s going to be accepted.
Peter’s book Reef Heresy? is a great read and hits a nice balance between the technical and layman’s terms, lots of graphics, clear argumentation, etc. Yep, the Crimate Ker-ching people have their hooks into the Reef as well.
This seems to relate to AIMS report where they studiously avoid providing and overall graph, preferring to break it down into three regions to obscure what is going on for the entire GBR.
https://www.aims.gov.au/reef-monitoring/gbr-condition-summary-2020-2021#HCC
Where is this coral cover graph or the data it is based on ?
Can someone close to David Attenborough please let him know, before he makes a fool of himself yet again at the upcoming COP 26.
Like many I grew up adoring Attenborough’s nature documentaries on TV. However, he is now and out and out liar. There is no need to inform him because he already knows, like he knew about the walrus haul-out cliff tragedy being due to the presence of polar bears and maybe even their own drones spooking the animals.
Like so many members of AGW death cult, he has been convinced by the hysterical rhetoric into a frame of mind where “the end justifies the means.”. Lying is OK to “save the planet”, as is blocking motorways and causing the deaths of members of the public needing to get to hospital.
Hmmm… a very partial account of the findings of researchers there…
Here’s a report from marine scientists involved in the research:
Great Barrier Reef in ‘recovery’ but experts say progress will be threatened by climate-related disturbances – ABC News
(emphasis below mine)
“The Great Barrier Reef is experiencing a rare window of recovery due to a break in weather and bleaching events according to the latest observations from marine scientists.
Key points:
According to the Australian Institute of Marine Science’s Annual Summary Report on Coral Reef Condition, which was released today, conditions have been relatively good for coral recovery during 2020-21.
Researchers surveyed 127 reefs and found that at least 69 had seen an increase in hard coral cover since they were last surveyed.
“This indicates that recovery is well underway, after a particularly intense decade of disturbances prior to this,” monitoring team leader Mike Emslie said.
“We’ve had very few acute disturbances this year,” Dr Emslie said.
“There were no sustained heatwaves leading to coral bleaching, there were no large tropical cyclones.
The improvements come after the Great Barrier Reef experienced its most widespread bleaching event on record early last year.
Dr Emslie said the majority of the coral cover growth was driven by common, fast-growing table and branching corals.
However, he said these corals were the most vulnerable.
“Their fast growth comes at a bit of a cost, their skeletons aren’t as dense as other corals,” Dr Emslie said.
AIMS has warned that the recovery the Great Barrier Reef is currently experiencing is likely to be short-lived with the “increasing prominence” of climate-related disturbances.
“The biggest risk to the reef going forward is climate change,” AIMS chief executive Paul Hardisty said. “
Wow griff, did you put all that together by yourself? Well done!
You really are stepping up to the task given to you by the controllers of CAGW aren’t you?. Or maybe you are just the conduit through which the numerous zealots flow their nonsense views and selective data.
‘Wow griff, did you put all that together by yourself? Well done!’
Nope. It’s copied from the link Griff added to his post.
You would say all of the above wouldn’t you?
So how about these questions: all of the Medieval Warm Period, the Roman Warm Period and the Minoan Warm Period were hotter than today. How come the Great Barrier Reef (GBR) survived all those episodes? How come corals survive and thrive in the Red Sea and Persian Gulf where ambient air and water temperatures are much higher than over the GBR?
CO2 was 260 – 280 ppm during those times.
Griff, your comment actually confirms what the article says. Have you seen the light and become more sceptical of alarmist propaganda?
“Could”, “believe”, “likely”, “experts say” etc. etc.
All these are hallmarks of CAGW bullsh1t.
The actual data shows a welcome recovery, but no records broken.
A really superb recovery. You must be pleased with that John. So, what’s to worry about?
Geez, I take Peter Ridd’s side in this entire reef fiasco (well, this premature report of its death) ….
But it what’s with people giving a downvote to simple posting of a chart?!!
We don’t like data any more?
Central
Central GBR
Looking good.
Data Source: https://www.aims.gov.au/sites/default/files/2021-07/AIMS%20Long%20Term%20Monitoring%20Program%20Annual%20Summary%20Report%20on%20Coral%20Reef%20Condition%20%28GBR%29%202020-2021_July2021.pdf
A superb recovery. I hope you’re pleased to announce that the barrier reef isn’t on the point of total wipeout, as a lot of alarmists have incorrectly claimed.
Thanks for these three graphs. It looks like average them, you get an all time high.
Thanks John. In that pdf the link for the data goes here:
https://eatlas.org.au/gbr/ltmp-data
Which tells us :
So there is not even an open public archive of this data. You have go through their gatekeeping process to ask – pretty please – if they would be so kind as to let you see their actual friggin data !
They deliberately do NOT provide the whole GBR plot. That seems to be Peter Ridd who dug the data to provide the headline graph.
And the overall trend ….
John Phillips, averaging the northern, southern and central charts appears to show a record high for the Great Barrier Reef. The overall trend figure that you have shown is misleading because it only goes up to 2020. The other charts are more up to date.
“averaging the northern, southern and central charts appears to show a record high for the Great Barrier Reef”
The individual regions are below their recorded highs, but combining them produces a new record? You are gonna have to explain that one to me.
Arithmetic does not appear to be your strong suit. I saw immediately that the current level is close to the record highs in all regions of the Great Barrier Reef. However, the charts show that the peaks in each graph are at different points. I selected the obvious peaks in the overall trend line and calculated the average of all three charts. In all cases, the current level was the highest. The article is clearly about the Great Barrier Reef in total, not pre-selected bits of the reef.
Boom!
Ah, apologies. I did not think anyone would be so dumb as to try and average three areas without taking their sizes into account.
John Phillips, I actually did take their sizes into account. It made no difference to my conclusion. I have a word of advice for you. When you are in a hole, stop digging.
Share your numbers? Current coverage, previous peaks and areas please. After all, if we are going to make claims based on eyeballing some graphs, best do it accurately.
From the report
“While there have been hard coral cover increases across all three regions over recent years, the Northern and Southern GBR are still below the highest recorded coral cover in the 1980s, and preliminary analyses have documented shifts in the dominant corals on some reefs.”
Central is also below its 2016 peak.
Still digging your hole. The report you keep quoting shows that Peter Ridd is correct. You just don’t seem able to understand the report.
Nothing wrong with my reading comprehension, the report actually says this.
“Sustained recovery of the GBR back to historical high coral cover requires the next few years to be disturbance free to allow corals to continue to grow and increase their populations.”
So the people who actually collected the data say the coral is below historical highs. We can hope the favourable conditions continue and the recovery continues. In the meantime we are still waiting for you to provide your ‘record numbers’..Nullius in verba.
The numbers you are looking for are available on the site which you linked to. I weighted the northern region as 42%, the central region as 42% and the southern region as 16%. These numbers come from the site and confirm that Peter Ridd is correct. You seem unable to comprehend the sites that you are linking to.
You can squint at graphs all you like, it is there in black and white – the report that Ridd cites states the GBR requires several more years of recovery before it returns to its historic high levels of cover.
You are deliberately misquoting the people who collected the data. They say that the coral is below historical highs in each region, not the entire Great Barrier Reef. Your inability to understand the difference has made you into a laughing stock on this site.
I gave an exact, word-for-word quote. And no, they don’t.
Your quote includes the word “sustained” which tacitly admits that today’s level is at a historical high. This is not technically lying. This is called spinning “bad” news which in this case is the fact that the numbers show that today’s coral coverage in the Great Barrier Reef is at an historic high. You have misinterpreted what the quotation actually means. Whether this is accidental or deliberate, only you can say.
The recovery must be sustained for several more years in order to return the GBR coral cover to the historical high levels.
sustain
verb [ T ]UK /səˈsteɪn/ US /səˈsteɪn/
sustain verb [T] (CONTINUE)
to cause or allow something to continue for a period of time:
HTH.
You have rewritten the quotation to mean something entirely different. You have become a joke.
I have rewritten nothing. The quotation, verbatim, reads
Sustained recovery of the GBR back to historical high coral cover requires the next few years to be disturbance free to allow corals to continue to grow and increase their populations.
I would describe that as unambiguous. Coral cover is several years away from regaining its ‘historical highs’.
To be clear, this year’s recovery is remarkable and very welcome. However Peter Ridd’s claims seem to rely on his somewhat idiosyncratic interpretation of the data. The reality is that the GBR is likely to experience bleaching events of increasing frequency, in all likelihood becoming an annual event, which will give the corals no time to recover.
You have now reverted to the original quotation which tacitly admits that today’s level is at a historical high. The emphasis should be put on the word “sustained” to be understood in its correct meaning. This is unambiguous but you have wilfully misinterpreted it.
In this thread you have deliberately misrepresented the data and now you are doing the same with direct quotations. You are incredibly dishonest. You will clearly do absolutely anything to avoid admitting that you are wrong.
The report is indeed unambiguous. What is remarkable is the number of words you have to redefine to twist it to your preferred meaning. Words like ‘sustained’, ‘recovery’, ‘back’, ‘next few years’, ‘continue’, ‘grow’ and ‘increase’.
Comedy gold indeeed.
Thank you for agreeing that the report is unambiguous.
I agree with you, Bill. In the quotation, they are clearly talking about sustaining the current record level of coral.
I have been trying to explain that the quotation is about sustaining the current recovery of the reef back to historical high coral cover, but he just cannot seem to comprehend English sentence structure.
“Ridd shows a figure allegedly from the latest Australian Institute of Marine Science (AIMS) report to support his claim that the amount of coral in the Great Barrier Reef reached a record high in 2021, but Ridd’s figure is neither consistent with the figures published in the AIMS report[1], nor with the scientific literature. Contrary to the claim, the recent AIMS report for the three regions of the Great Barrier Reef showed strong variation in coral cover across years, but no record high in 2021, as claimed in Ridd’s article. Furthermore, scientific studies show a significant decrease in the amount of coral and coral growth rate since the 1980’s”
https://climatefeedback.org/claimreview/despite-2021-being-a-good-year-for-coral-health-coral-in-the-great-barrier-reef-has-declined-over-the-past-decade-and-is-threatened-by-climate-change-contrary-to-claims-by-peter-ridd/
Hilariously, the link that you provided shows someone making the same mistake as you.The graphs you presented here support Peter Ridd’s position. You really shot yourself in both feet.
Ah , so at last you reveal the source of your misinformation. The notorious serial liars at bogus “fact checker” Climate Feedback.
They back up this claim with papers from 2012 and 2015, actually before the recent recovery !
They claim he “misuses” the AIMS data because it does not agree with the spin they put on it by breaking it down into separate areas to HIDE the fact that the overall coverage is equal to the previous record levels.
The truth is AIMS are “misusing” the data because they avoid providing a graph showing the full picture, only the regional graphs.
https://www.aap.com.au/has-the-great-barrier-reefs-health-barely-changed-since-the-1980s/
This link refers to last year’s figures. We are talking about this year’s data. Your utter desperation is showing. You just can’t admit that you were wrong, can you?
Funny all these “fact checkers” are presistent liars.
They take a claim that current levels are nearly same as 80s and instantly change it to be a claim that “it has barely changed“.
Arctic sea ice min. is 15% higher this year than it was in 2007. That does not mean “it has barely changed”: it was much lower 2012. That means it is 40% higher than the all time record low.
That’s lie. Central region is clearly higher. They claim to do a fact check, cite the source , then lie about what the source says.
Say there’s three boxes with a different number of balls in them each day, and they’re measured by how full they are
Blue box Day 1: 80%, day 2: 30%, day 3: 70%
Red box Day 1: 30%, day 2: 90%, day 3: 60%
Green box Day 1: 70%, day 2: 20%, day 3: 60%
None of the boxes have their record high on day 3. But the totals are as follows-
Day 1: 180% / 3 boxes = 60% overall average
Day 2: 140% / 3 boxes = 46% overall
Day 3: 190% / 3 boxes = 63% overall
Because the individual regions of the reef don’t all have their record high in the same year, the record high for the total can be any year, whether or not any of them set an individual record.
Every idiot knows that you don’t need a single world record run to run an overall world record in 4*100 meter dash relay .
To my knowledge it has never happened.
Maybe it happened once or twice in swimming but 99% of all relay race world records happened without a single run record.
It is pretty simple Phillips:
Lets assume the record for every region is 100(%).
Now Lets assume that every time one region achieved a record the other 2 were sub 90.
Therefore the possible maximum during a record year is >280.
While you can reach 285 if all regions reach 95 in the same year.
John says “You are gonna have to explain that one to me.”
Add the last point to you trend graph, John. The regional coverage graphs go one more point beyond 2020. Your trend graph does not.
The “trend” is not even the point in question. The claim is whether the current cover is as high as early part of the record.
But you are right, he has lost the final data point, which is certainly higher.
“And the overall trend ….”
Of course! Because the world was created in 1980!
(I advise you NOT to tell that to some Bible literalists, they believe that the world was created a bit earlier than that…)
they believe that the world was created a bit earlier than that…)”
But not by an awful lot….
Something these graphs also don’t show is the change in the diversity of the GBR coral population. Coral shows a remarkable resiliency and ability to rebound after bleaching events, but most of the growth is by a handful of faster-growing species.
Indeed. And this paper looked at factors affecting bleaching and apart from the obvious link to temperatures (and rate of change of T) also found a relationship between bleaching and species diversity. Less diversity=more bleaching.
And with only that article you think that you know ALL about corals? Why don’t you learn with Clint Eastwood (“In the line of fire”: “I know things about pigeons…”)?
If you knew a bit about corals you would know that bleaching is a normal and not uncommon occurrence in the natural history of corals. Has nothing to do with their “extinction” or other dangers.
If you knew a bit about corals you would know that bleaching is a normal and not uncommon occurrence in the natural history of corals.
“Tropical reef systems are transitioning to a new era in which the interval between recurrent bouts of coral bleaching is too short for a full recovery of mature assemblages. We analyzed bleaching records at 100 globally distributed reef locations from 1980 to 2016. The median return time between pairs of severe bleaching events has diminished steadily since 1980 and is now only 6 years. As global warming has progressed, tropical sea surface temperatures are warmer now during current La Niña conditions than they were during El Niño events three decades ago. Consequently, as we transition to the Anthropocene, coral bleaching is occurring more frequently in all El Niño–Southern Oscillation phases, increasing the likelihood of annual bleaching in the coming decades.”
https://www.carbonbrief.org/severe-coral-reef-bleaching-now-five-times-more-frequent-than-40-years-ago
“Tropical reef systems are transitioning to a new era…”
Everything is “transitioning to a new era” in journalistic verbiage. Nothing to do with science. Corals are millions of years old, their “transitions” cannot be evaluated by some pretended observations in a few recent years. Please, study biology, because it seems that you only “know things about corals”…
Coral shows a remarkable resiliency and ability to rebound after bleaching events, but most of the growth is by a handful of faster-growing species.
Why does this surprise you, and why is it a bad thing?
I’m not making a value judgement, here, but stating a fact. The % of coral cover doesn’t reflect the loss of biodiversity occurring. Most people I think would view this as a negative consequence.
What loss of biodiversity? The slower-growing corals are still there, they have not gone extinct. In time, the same equilibrium between species will be re-established.
Assuming that present conditions will prevail is naive, when bleaching events are only expected to become more common as global warming progresses.
You have absolutely no idea whatever what the climate will be in the future. Computer models are worthless.
Alarmists like you have a precisely 100% record of failure in your predictions.
Speaking of “naive:” “Expected” is an extension of a belief, not a demonstrable fact.
Absent the existence of time machines, we can never demonstrate with absolutely certainty what will happen in the future. The best evidence that we can put toward the problem tells us that the observed trends are likely to continue, and that this will pose an ongoing threat to the GBR.
The observed trends of something you don’t understand tells you nothing.
What’s different for current conditions? Global temperatures are up, at least according to alarmist propaganda; CO2 is up for sure.
Most people don’t care and can’t name a single species of over 600 different coral on the barrier reef. Those with an agenda do care, though, even though they can’t name a single species either.
Since extinction is the rule for all species given enough time anyway, worrying about it might help to do something but I can’t figure out what. Maybe we should revoke the law of survival of the fittest.
“I don’t know much about corals so they can go extinct for all I care” is the goofiest thing I’ve heard in a while.
You should get those voices in your head checked out. Even people with agendas need medical intervention when they hear voices that aren’t there.
The GBR is home to hundreds of coral species, whose relative local abundances are naturally subject to change over time. The GBR is just as diverse now as it has been since the hotter than present Holocene Climate Optimum. What species have gone extinct or been locally extirpated there recently?
The present, living reef structure dates from the HCO, ie six to eight thousand years ago, when water temperatures were balmier than today.
Tropical corals like it hot.
Same thing happens after a forest fire. Fast growing brush and trees come in first, and 30 years later are eclipsed by slower-growing varieties.
Isn’t nature wonderful, that we have a sort of specialization in plants!
Or an upward trend from 1987 on. <sigh> It is hard to see a trend of any kind outside of 500 to 1000 years for things like this. The sine wave is often too large and everything else is noise.
Out of curiosity do you recognize John the Medieval Warm Period, the Roman Warm Period and the Minoan Warm Period as being as warm if not warmer than today OR are you one of those that attempt to explain away the thousands of papers from all over the world as not being accurate?
Nice graph. It shows corals are better off then they were 30 years ago.
I’d call that a nice and healthy recovery. Or are you going to try and maintain that the corals were better off back in 1990?
You’re looking for problems that aren’t there John. That’s the definition of unwarranted alarmism.
The question is, whether the recovery conditions are likely to be temporary. And whether any episodes of worsening conditions, which there will be, can be tied to global warming.
I have seen no rigorous account which explains why the tiny rise in current global temperatures can be tied to any local conditions which damage the GBR.
The problem is exactly the same as with wildfires and flooding. Or polar bears for that matter. People pick some change, which if its really occurring, would be noteworthy. They then feel obliged to defend the size and drama of the change, to the point of getting into denial when it reverses. And they try to move the debate from whether global warming is actually driving these changes to whether they are happening and whether they are dramatic.
So we find that European flooding, which is in no way historically remarkable, is said to be unprecedented and is attributed to a global warming which all the models say is supposed to produce droughts in the parts of Europe which have flooded. We find Californian wildfires whose destructiveness is due to the refusal to manage the forests sensibly and sustainably attributed to a non-existent level of supposedly unprecedented droughts and heatwaves. Which are simply normal fluctuations which are common in the historical record.
We are seeing exactly the same thing with the GBR. Its first of all claimed that its damaged and in terminal decline. Which the evidence shows it is not. And then when it recovers beyond the possibility of denial, this is said to be temporary, because the imaginary warming that has been cited as the cause of the initial downturn is obviously going to produce more damage in future.
Without ever tying the amount of the alleged warming to the temporary decline in the first place.
Its a sort of religious hysteria. People scanning the heavens and seeking to interpret natural phenomena as signs and portents of the non-existent coming apocalypse.
Great points Michel! Dr. Jordan Peterson has said this “religious hysteria” you mention is explained by the decline of organized religions in the western world. Here’s a very recent interview (Sept. 24, 2021) with Dr. Peterson where he addresses climate change and other imagined “catastrophes”. I listened to the entire interview yesterday and found some very helpful insight into why people “believe” so strongly and the psychology behind it.
“I have seen no rigorous account which explains why the tiny rise in current global temperatures can be tied to any local conditions which damage the GBR.“
Let’s put some numbers on that ‘tiny rise’
When making an argument about the size of change, it’s disingenuous to use anomalies. Put it in the context of the actual temperature over a year. Then you’ll see that the change is tiny compared to the variability. Your argument disappears.
“When making an argument about the size of change, it’s disingenuous to use anomalies.”
The opposite is the case. Corals start to experience stress when the temperature varies from the normal – the anomaly. Bleaching events are closely correlated with increases in SST over the normal so anomalies during the Austral summer are in fact very relevant.
The recovery this year is welcome however if, as forecast, sea temperatures continue to rise, large scale bleaching events will only become more frequent. It takes 5 years or more for full recovery from such events and it seems likely the GBR simply will not get such breathing space, in fact it is more likely that bleaching will become an annual event.
Even under an optimistic 1.5C increase in global temperature, the IPCC forecast we will lose 70-90% of reefs, rising to 99% if we get to 2C.
I fear the likes of Ridd and WUWT will soon be judged as breathtakingly complacent.
“Corals start to experience stress when the temperature varies from the normal”
The normal variation is six degrees C during the course of a year. A one degree change of one hundred years is not a variation from the normal.
The timescale is too fast to enable adaptation and it is one degree extra at the top of the range. Enough to trigger bleaching in many species.
And the warmer temperatures are becoming more frrequent.
Explain how the GBR survived perfectly well far warmer epochs than today.
Name an example? The corals that are around today are not the same species that survived previous warm events.
http://globalreefproject.com/coral-reef-history.php
The corals today are not the same as 40 million years ago. There were several previous warm events in the last 10,000 years.
You genuinely believe the corals present some 7000 years ago during the Holocene Thermal Optimum differed from those today? Yet temperatures were several degrees warmer.
John writes “Corals start to experience stress when the temperature varies from the normal – the anomaly.”
A change in the average, especially a small one compared to the variability is not going to do what you claim. A change in the extremes is what is dangerous.
Changes in the average drive natural selection.
https://www.science.org/doi/10.1126/science.aan8048
The data from this years proves that the claim of not enough time for recovery postulated in 2018 is false.
Except the corals do recover and those that survive will tend to be able to withstand the warming event. That’s natural selection and it has worked through glaciation which is much more recent than your “big picture, 40 million years ago” link.
Crap.
http://www.bomwatch.com.au/wp-content/uploads/2021/08/GBR_SST-study_Aug05.pdf
That is an observed fact.
That is at best an unfounded extrapolation. It would be justifiable to say; ‘The “recovery window” is due to an observed end to climate-related disturbances’.
And expert Shia theologians believe the Mahdi will come and rid the world of evil. Doesn’t mean that’s right. It just means you’ve picked an expert according to your chosen religion.
the Empire Strikes Back. Crimate Ker-ching! Hope your getting your share, otherwise you are giving useful idiot freebie support to the largest oligarchy of professional scammers in the world. How stupid you should feel – that is, unless you’re getting paid?
“A break in the weather” That’s pretty funny. When good things happen it’s the weather, but when it’s bad things, it’s the climate. LOL!
Give us a solution that does not leave billions without energy and billions in energy poverty. You cannot.
54 years after being ground zero for the biggest nuclear blast ever , the reef at bikini atoll is thriving . no sign of climate catastrophe there . corals are a hardy species .
By the same criterion, so are humans a hardy species.
The parallel story to Bikini Atoll recovery is the resurrection of Nagasaki and Hiroshima.
Eerily, both reef and human populations re-established themselves in about the same time frames.
““There were no sustained heatwaves leading to coral bleaching, there were no large tropical cyclones.”
The hurricane season in the Atlantic seems to rather tame, too, this year. I bet this, and the healthy coral reefs, really irritates the alarmists.
Let me translate that for you:
“The reef’s actually fine, but we’ll lose our fat and juicy grants if we don’t say the reef is about to die. So, we’ll start screeching about future coral carnage (that nasty Peter Ridd can’t measure something that hasn’t happened yet)”
ABC news? Great source of science there Griff. Open mouth, change foot.
“Recovery” is a demonstrable fact. “Threatened” is an unsubstantiated opinion.
As has been explained numerous times here, “bleaching events” do not mean that the coral dies! They’re just swapping out algae.
Bleaching is caused by warming of water by direct sunlight, not the air in contact with the ocean. Not global warming. Recent El Nino events with little cloud cover caused the bleaching. We are now in the La Nina phase, more cloud, very little bleaching.
Good comment.
Recommend watching the whole video, it’s very entertaining.
Thanks Ben, it is.
Great news – Thanks for the update, Peter!
The problem with “bleaching events” is the terminology, which implies a deleterious chemical attack – as in chlorine bleach – rather than a very unremarkable, natural adaptation to the normal cycles in environmental conditions that frankly, most animals and plants on earth do to one extent or another all the time. Just as all animals and plants adapt to the change of seasons from year to year … and changes to climate over long timeframes.
There is no “bleach” in “coral bleaching”. We should reject and call out this term, which is extremely misleading. I am not an aquatic biologist, so I am not qualified to offer a better term, but someone should.
“Zooxanthellae expulsion” doesn’t roll off the tongue very well. Maybe ZE event?
To put it in clear English, call it “the crew change”.
“Coral bleaching,” and “ocean acidification,” all part of a scare campaign.
Cook carried several scientists on his voyages
If only JCU would.
-1
A direct hit.
The GBR is another myth of cyclical death and rebirth, like Prometheus
To test the suggestion that the MSM is ignoring this “inconvenient truth” I put “Great Barrier Reef experiencing ‘record high’ levels of coral coverage“ into the Google search engine to see what would come up. The fourth, yes the fourth’ hit was something from The Guardian dated 11 July 2019. Its title is:
Great Barrier Reef hard coral cover close to record lows –
A great example of Google’s power to be selective.
Peter’s a witty bloke. Seems like a nice chap. What JCU did to him was disgusting.
Hi Griff
I can see that you are fond of deferring to ‘authority’, obviously this saves you the trouble of doing some logical thinking for yourself.
Let’s just review the situation CO2 has been increasing and temperatures have been rising, there is a recognised mechanism for this, the Greenhouse Effect. I accept that, all other things being equal, a rise in CO2 leads to higher radiative forcing on the Earth and therefore higher temperatures.
However, this depends on ‘all other things being equal’. So have they been? A pretty key question don’t you think? What is the main component of the Greenhouse Effect? Well that is overwhelmingly water vapour. CO2 is only a minor player compared to this.
So you would think any scientist worth his salt would have looked at trends in atmospheric water vapour over the so called problem period. I think that would be hard to disagree with, what do you think.
Well if you bother to look at such a thing some scientists have looked at it. Also and this is right up your deferring to authority strasse, it is the World Metrological Organisation, through their Global Atmosphere Watch programme.
Mind you, it seems very few other scientists have been minded to look at atmospheric water vapour, probably because of this statement in the report.
…………………….
“It is impossible for us to control directly the amount of water vapour in the atmosphere since water is found everywhere on our planet – it covers 71% of Earth’s surface.”
……………………………………..
Not much money to be made studying something we have no control over is there?
So what did they find has been happening to water vapour over the so called problem period?
“Research has found that a 10% decrease in stratospheric water vapour between 2000 and 2009 acted to slow the rate of increase in global surface temperature over this time period”
” More data suggest that stratospheric water vapour probably increased between 1980 and 2000, which would have enhanced the decadal rate of surface warming during the 1990s. These findings show that stratospheric water vapour is an important driver of decadal global surface climate change.”
They also say.
………………………………..
“A recent study showed that reanalysis data on high-altitude atmospheric water vapour, critical for the greenhouse effect, are not as accurate as previously thought. Water vapour data for the UTLS region from these reanalysis data sets have been compared to water vapour data from the Microwave Limb Sounder (MLS) on the AURA satellite. These satellite data have not been used in the production of these reanalysis, so they represent an independent data set well suited for validation. The study found that the reanalyses differed quite a lot from the MLS observations, overestimating the annual global mean water vapour in the upper troposphere by about 150%”
…………………………………
Oh dear, what does this mean for the modellers who have been pugging this data into their models?
The report states……..
………………………………
“More accurate data with better geographical coverage is needed. The observed temporal trends in stratospheric water vapour are poorly understood and this demonstrates our lack of understanding of how water vapour enters the stratosphere.”
……………………………………………
Oh dear again! To finally put the cherry on the cake.
……………………………
“The models that are used to predict future climate use reanalysis data to verify that the current climate is modelled correctly. The lack of accurate water vapour data in the important UTLS region will therefore limit the ability of these models to predict future climate.”
…………………………………
So what do you think Griff? (do you think or are you currently going La La La in your head.) Do you think you can put WMO into the sceptical column?
I bet you wish you could claim that atmospheric water vapour and atmospheric CO2 are in lockstep with each other but the report kiboshes that as it states water vapour fell between 2000 and 2009 whilst CO2 continued its upward march, so there is no lockstep relationship between CO2 and water vapour they can alter independently of each other
So what do you think Griff? Water vapour rose and temperatures increased and CO2 rose at the same time. Water vapour fell and temperatures stabilised or also fell.
Given that water vapour is by far the stronger of the two in the greenhouse effect which would you think was responsible for the vast majority of the temperature rise? Care to give an opinion based on logic not faith?
Now this might involve thinking for yourself, alternatively you can just defer to authority and accept the WMO report, which completely undermines any reliance you can put on the model predictions.
https://public.wmo.int/en/resources/bulletin/observing-water-vapour
Of course the WMO couldn’t help themselves when they said………… “Research has found that a 10% decrease in stratospheric water vapour between 2000 and 2009 acted to slow the rate of increase in global surface temperature over this time period”
What they should have said is that ‘CO2 rose and water vapour fell and temperatures decreased’.
https://www.woodfortrees.org/plot/uah6/from:2000/to:2009/compress:12/plot/uah6/from:2000/to:2009/trend
Best not to set the sheeple thinking, eh Griff?
The coral is thinner and newer, it isn’t the same as the older thicker coral. Oh wait…that was the ice in the Arctic.
My experience with nature is of you leave it alone and do not kill it off through real pollution or industrialized harvesting, it will do just fine.
The greatest threats to the Great Barrier Reef are all the scientists taking samples and potentially spreading disease from one area to another, and likely tourism where some people just have to do stupid things. This assumes that farm runoff has already or is being addressed.
It will be even better with upwelling.