By P Gosselin on 24. September 2021
Snowfan rreports here of how parts of western Germany have had 4 nights in a row of surface frost and how new models are even projecting snowfall already in mid October. If that occurred, it would be unusually early.
Globe cooling off
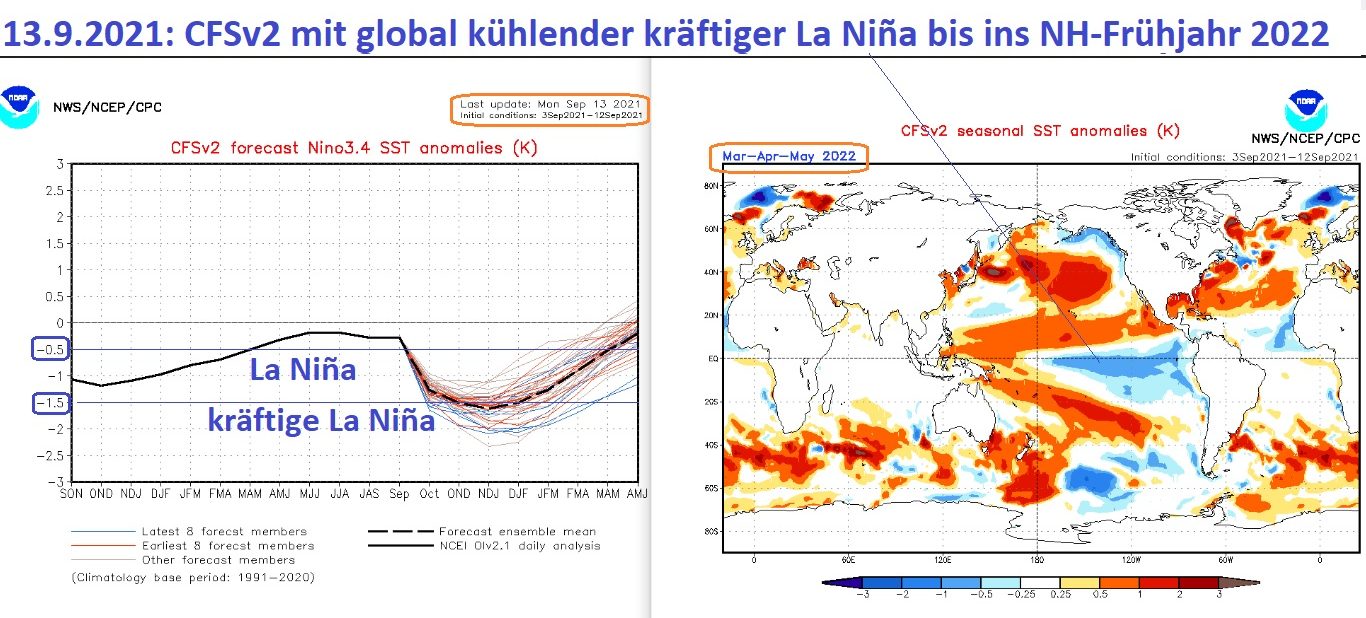
Overall the globe has cooled substantially since the last El Nino ended in 2016, and it now appears the cooling trend will persist another year as the CFSv2 is forecasting a La Niña to continue into spring 2022.

Source: NOAA/CFSv2-ENSO-prognosis
The latest NOAA/CFSv2 projection dated September 23, 2021, indicates La Niña-conditions over the Nino-region 3.4 of the equatorial Pacific.

NOAA forecast from September 13, 2022.
“As a result, the globe will cool further well into the coming year as it has done since 2016. That will mean no warming like the German Greens like to claim for about 7 years,” reports Snowfan.
How long will The Narrative continue? Despite cooling, reporting warming is continuing.
Not if one relies on satellites and weather balloons. The thermometers are corrupted by the urban heat island effect.
Stephan-san:
Not only is the Urban Heat Island effect not being properly being adjust out of raw temp data, but also: homogenization, in-filling of spurious temp data in huge land and ocean areas with no actual temp data, and adding heat to raw temp data to give Leftists their desired warming trends, all contribute to skewed and fake data to keep the CAGW scam alive…
if it weren’t for Dr. Spencer’s excellent work on UAH 6.0 global satellite temp data, there would be any accurate and valid global temp dataset available to see what’s actually occurring..
it’s deplorable what has happened to climatology specifically, but also the sorry state of all branches of science who don’t expose all the obvious lies the CAGW religious fanatics are spewing on a daily basis because they fear losing their jobs…
This is not how science should work.
Its not science. Its power politics and commercial marketing.
Man in white coat says ‘Persil washes whiter than white’
A lab coat is the emperor’s new clothing.
“Dr. Spencer’s excellent work on UAH 6.0 global satellite temp data, there would be any accurate and valid global temp dataset available to see what’s actually occurring..”
Adjustments in perspective (RSS and UAH) use exactly the same data from the same instrument….

So of course go with UAH.
Because it’s colder? (surely not!)
NOAA “adjustments” have lowered the global mean temp trend by raising past temperatures NOT cooling them ..
So they are doing a poor job with this ere “scam” to “give Leftists their desired warming trends”.
Another issue is that the number of rural weather stations has been dropping over the past half century. This further exaggerates the impact of UHI.
Not 2 days ago a NoTrickZone article appeared on this site highlighting a handful of European surface stations that showed a cooler than average summer in 2021 and it was cheered to the rafters.
When I pointed out that UAH satellite data showed that summer 2021 over land areas 20N-90N was the warmest on record, I was told not to confuse surface data with satellite.
The rule appears to be as follows: if surface stations show cooling where satellites show warming, we go with the surface stations. If surface stations show warming where satellites show cooling, we go with the satellites.
It’s all climate change. Just not CAGW the doomsters reckon they can control. You do believe in climate change don’t you?
Satellites and ground surface stations are measuring different things. Though, surface station warming can provide some early hints as satellite data lags a bit due influence of slower reacting ocean temps.
But yes, picking the data that screams “warming” for yelling headlines is looking for the only one golden cherry.
You want scientific data to be accurate then tell us the statistical parameters associated with the Global Average Temperature. Things like variance, skewness, kurtosis, population uncertainty.
If you can’t do this then it is inappropriate to call GAT a statistical analysis. It is a mathematical concoction to arrive at a meaningless number.
The rule is that different data sets show different temperature results. This is not in dispute.
One could then reasonably say that all the observed temperature data is not fit for policy determination since its unknown range is too large to make educated suppositions.
But you never say that. So you must have an agenda that precludes that option.
Warming is continuing if you follow the NOAA “altered” temperature data. The “raw” data shows a small cooling trend for at least the US.
Until they get their large, permanent, unrestricted new revenue stream for power grab and redistribution. There is nothing else that explains the behavior other than follow the money.
Yes. Heads they win, tails we lose. But over time the truth gets out.
Cooling is the new warming.
I believe we had this CAGW nonsense sorted in 2002, when we published:
1. “Climate science does not support the theory of catastrophic human-made global warming – the alleged warming crisis does not exist.” – 2002
2. “The ultimate agenda of pro-Kyoto advocates is to eliminate fossil fuels, but this would result in a catastrophic shortfall in global energy supply – the wasteful, inefficient energy solutions proposed by Kyoto advocates simply cannot replace fossil fuels.” – 2002
3. “If [as we believe] solar activity is the main driver of surface temperature rather than CO2, we should begin the next cooling period by 2020 to 2030.” – 2002
3a. “I suggest global cooling starts by 2020 or sooner. Bundle up.” – 2013
See Electroverse.net for record-cold events all over the world.
The warming alarmists are now reduced to claiming that “warming causes cooling”. Right-o!
Also, up causes down, right causes left, and poverty causes wealth.
And yet every developed nation with the possible exceptions of China, India and Brazil will offer climate ambition in Glasgow in a few weeks.
That is on the proviso that the UK can put fossil fuel in the fuel tanks of dated motor vehicles or electric energy into their electric vehicles in a few weeks. It would be a crying shame if Glasgow 26 was cancelled for lack of wind and fossil fuels. (Please do not panic buy if you are living in the UK. Enough old people will die of the cold to ease pressure on farm supplies)
It is noted that Glasgow 26 guests should bring a cut lunch. The hosts will be unable to supply food for overseas guests!
G
The narrative will continue until people openly laugh at it.
It is Lamarckianism on a grand scale. I am rather impressed.
But they will just tell us the cooling is proof of climate change and CO2 needs to be reduced anyway.
Naw….the headlies (sic) are…..
July 2021 officially the hottest month ever recorded on EarthGlobal land and sea temperatures were 1.67F above the average for July, making it the hottest month since records began 142 years ago
Wow, 142 years out of 4.5 billion. Proves nothing. Nor does it prove CO2 is responsible. Climate changes, always has, always will
No, it doesn’t. CO2 is the building block of all life!
I look at climate4you every month I don’t see this cooling what I missing? Static maybe.
HADCRUT4 shows no trend for the past 7 years, the other main data sets show a slight warming trend.
A series of La Ninas over a decade or so should stop the increase in atmospheric CO2 and potentially put it into reverse.
As I have stated previously, solar variations alter global cloudiness via changes in the jet stream tracks because more meridional tracks involve longer lines of air mass mixing and thus more clouds. No need to consider the Svensmark idea about cosmic rays providing more condensation nuclei of ehich there is no shortage in any event.
The reduction in solar energy into the oceans from more clouds gradually skews ENSO to favour cooling La Ninas over warming El Ninos.
The ice core records appear to fail to capture such short term atmospheric CO2 variability.
Rubbish. La Ninas have nothing to do with the increase in atmospheric CO2 which is driven almost exclusively by human burning of fossil fuels. When was the last time CO2 levels decreased on an annual basis?
Exactly the point. Most of 2021, due to “pandemic” restrictions, human production of CO2 declined, yet atmospheric CO2 continued to rise as if nothing had changed. Humanity and our feeble production of CO2, or of any GHG, have almost nothing to do with atmospheric concentrations of GHG.
Human CO2 contributions dropped by 15 to 20%, for a couple of months. Not enough to make a noticeable difference.
I beg to differ. It may not have been enough to see a difference over a full year; however, there should have been a measurable difference in the rate of growth (slope) during those two months of the Winter-Spring ramp-up phase.
The argument is that humans are entirely responsible for the annual increase in CO2 retained in the atmosphere. If all the CO2 was anthropogenic, then there wouldn’t be the obvious seasonal increase and decrease explained by photosynthesis. Anthropogenic sources are constant throughout the year!
“Human CO2 contributions dropped by 15 to 20%, for a couple of months. Not enough to make a noticeable difference.”
Exactly:
Lets take some high numbers
CO2 rises 2-3 ppm/year so 3
And use 20% reduction, all in 1 month
1/12 x 3 = 1/4 ppm
x 4/5 = 1/5
Now we have to halve that because 50% goes into the ocean
=1/10 ppm = 0.1 ppm
How about people naysaying pick that out from the noise on this graph …
https://img-s-msn-com.akamaized.net/tenant/amp/entityid/BB1gHc26.img?h=450&w=799&m=6&q=60&o=f&l=f
You are assuming that it is entirely human emissions that drives the increase in atmospheric growth of CO2. Were that the case, the strong seasonal signal wouldn’t be present. Even at 50% the seasonal signal would be muted.
The rate of growth during the 2020 April ramp-up is about 1 PPMv/month. If anthro’ CO2 was the only flux responsible for growth, a decline of 20% in human emissions would be about 0.2 PPMv, which halved, would be about your number of 0.1. However, the decline started before April, and continued after April, albeit at lower levels. There have been times in the past when a ‘bench’ was noticeable in the ramp-up. Not so in 2020! In fact, 2020 was indistinguishable from 2019.
The reason a decline in the rate of growth isn’t measurable is because the total contribution to the atmosphere isn’t 50% of human emissions, as you suggest, but is instead, less than 2.5%! There is no reason to suppose that the other CO2 fluxes eschew sequestration in the atmosphere, and only anthro’ CO2 contributes.
https://wattsupwiththat.com/2021/06/11/contribution-of-anthropogenic-co2-emissions-to-changes-in-atmospheric-concentrations/
If that is true then the policy implications are clear. Adaptation not mitigation is the only acceptable strategy.
Consider the hardship caused by the Covid restrictions. Consider the poverty produced by constraining growth, Consider the misery endured in 2020.
And it wasn’t enough too even be noticed.
Stop the planes. Empty the roads. Stay at home. And it had no impact on the atmospheric CO2 levels.
Any mitigation policy would need to be far harder than 2020 and not just for one year but for every year. Year after Year. Forever.
Never worth it. Never achievable. No-one could enforce it.
We need to follow the science and tell the Greens to grow up. AGW does not require cuts to fossil fuels. It requires economic growth to adapt. It requires the cheapest energy.
If you are right we ne need coal. And lots of it,
You have proven nothing. Those proffering the hypothesis that only the natural CO2 is absorbed by the oceans thereby leaving the man made CO2 to raise the concentration of CO2 are full of crap. Solutions of the same thing don’t act that way. You can not separate the two. If man made is 5% of the new, then man made is 5% of what is left.
This is besides the fact that we haven’t seen cooling like this for about 50 years. You’ll look pretty stupid if you prognosticate something different and it doesn’t come true. Kind of like all the models, right?
Jim,
every year CO2 concentrations in the atmosphere increase by about 50% of the total amount emitted by human activities. Claiming that humans aren’t responsible for the observed rise in CO2 levels would mean that firstly some process is removing 100% of human emissions and that secondly some second unknown process is currently emitting an amount equal to 50% of human emissions.
That 50% number could well be coincidence. How do you explain the ramp-up and decline phases in CO2 when anthropogenic sources are essentially constant?
Again that is easy. There is a periodic oscillation related to the northern hemisphere seasons. On top of which there is a smaller human contribution that is relatively constant and adds up year by year.
How can there be a dominant periodic oscillation if the human annual contribution is of the same order of magnitude as the oscillation? The annual range in CO2 concentration is about 8 PPMv during the ramp-up phase, and about 6 PPM during the draw-down. That suggests that the anthro’ contribution has to be about 25%. However, other analyses (Carbon Cycle) indicate that less than 5% of the of the total atmospheric CO2 flux is anthropogenic! The numbers for your “easy” solution don’t work out.
Again, you can not treat a solution that way. The CO2 sinks do not care one way or the other. I have seen no studies that definitively show that the amount of growth wouldn’t occur without man-made CO2. You are taking a coincident phenomena and also calling it correlation. That is not evidence and is proof of nothing.
You should be saying that the amount left correlates with the amount of man-made CO2 and leave it at that.
” I have seen no studies that definitively show that the amount of growth wouldn’t occur without man-made CO2. ”
The paleo record shows that to be the case – never mind basic common sense.
The only way that CO2 could be increasing via natural means is if the sinks turned into sources.
The oceans are warming -so they are less able to absorb gases.
But ocean ph is decreasing, so oceans remain a sink.
The biosphere is diminishing, but is more of sink than a source.
There are not several large volcanic CO2 out-gassings (would be seen as a large step rise in CO2 monitors).
Emissions match numbers for fossil energy burnt …

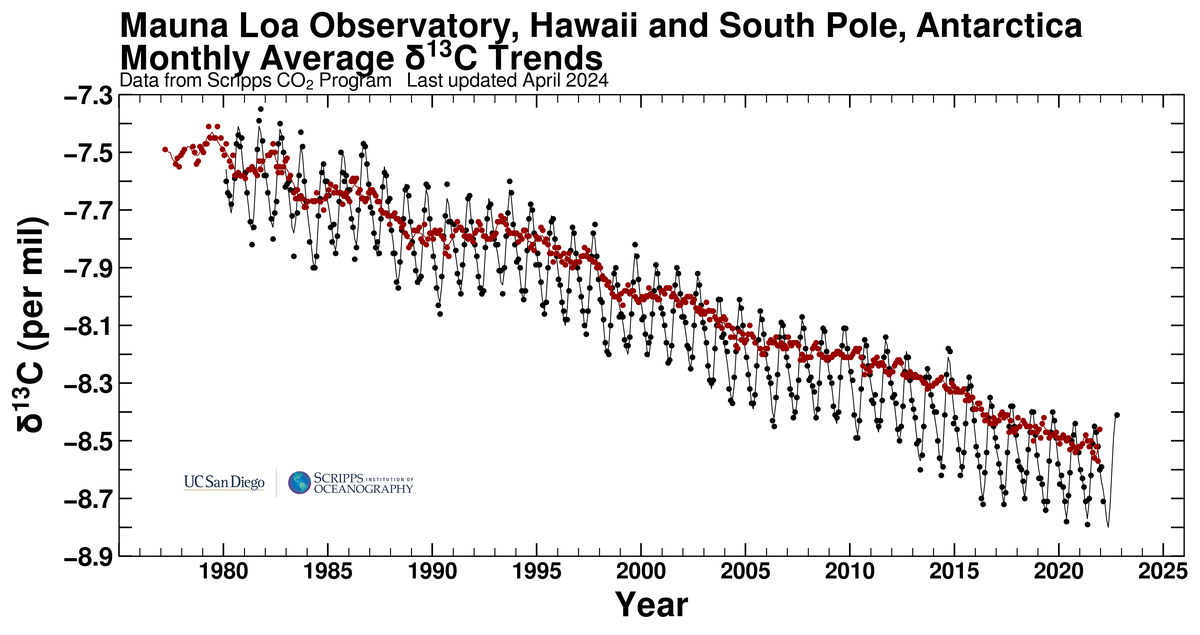
And to cap it all the the isotopic nature of CO2 concentrations increases the average 13C/12C ratio of the atmosphere decreases …..
 ?1632671749326
“CO2 produced from burning fossil fuels or burning forests has quite a different isotopic composition from CO2 in the atmosphere. This is because plants have a preference for the lighter isotopes (12C vs 13C); thus they have lower 13C/12C ratios. Since fossil fuels are ultimately derived from ancient plants, plants and fossil fuels all have roughly the same 13C/12C ratio – about 2% lower than that of the atmosphere. As CO2 from these materials is released into, and mixes with, the atmosphere, the average 13C/12C ratio of the atmosphere decreases.”
https://www.realclimate.org/index.php/archives/2004/12/how-do-we-know-that-recent-cosub2sub-increases-are-due-to-human-activities-updated/
That is an assumption that is questionable. The historical measurements were dismissed, and a computer model was used to generate an estimate of historical pH, which is used as a baseline to make the claim that pH is decreasing.
Even if the claim were true, it would probably be true for the colder waters only. OCO-2 showed dramatic outgassing in the tropics. One has to take into account the area and rate of outgassing for the tropics, compared to the colder waters where CO2 is more soluble, and compute the net difference, rather than just claim the pH is decreasing somewhere.
What the cited claim misses is that the deep ocean water that upwells, and is largely responsible for outgassing, is enriched from decomposition of photosynthetic phytoplankton, which prefers 12C just like land plants. Additionally, there is isotopic fractionation that selects for the lighter CO2 because it takes less energy for it to escape. There is still a lot of field work and laboratory analysis needed to be able to rely on the “realclimate” claim.
“The oceans are warming -so they are less able to absorb gases.”
Do you really believe oceans are not a CO2 source along with being a sink?
While your plot shows a general trend (red line) in δ13C of atmospheric CO2 that is certainly towards lower values, it does sometimes increase slightly (e.g. through the early 1990s – think Pinatubo), or drop more rapidly (see 1997-98 and 2015-16) so it is important to recognize the difference between the average trend and the fluctuations. Further, it is not a good idea, in my view, to average observations from two different locations (Mauna Loa and South Pole), because the true characteristics of these fluctuations are somewhat masked by the smearing effect of the averaging, due to any timing differences. A much better approach is to show the two sets of observations alongside each other and to analyse them separately (not least because the comparison provides evidence for what is signal and what may be noise).
It is a simple isotopic mass balance calculation to show that the incremental CO2 since the start of observations has had an average net δ13C of -13 per mil, whereas burning fossil fuels is estimated to generate CO2 with a δ13C of -28 per mil; i.e. a much lower 13C/12C ratio. In addition, the Law Dome ice core data also shows a δ13C of the incremental CO2 since 1750 (or thereabouts) to be -13 per mil. I find this remarkable and yet it does not appear to be discussed anywhere in the literature. Of course, the explanation might be complex, but I can find no recent published models that are able to replicate both the general (average) trend and, simultaneously, the short-term fluctuations that appear to be driven by ENSO and Pinatubo and which must form part of the explanatory model.
Did you not read what I said? If humans contribute 5% of the total, then the human portion is also 5% of the remainder. This is the physical reality. What you are claiming is not physical, it is manipulation to create a number important to you and that you can use for propaganda.
“the fact that we haven’t seen cooling like this for about 50 years”
You think?
If the projections are true we will not have seen cooling like this in 50 years. Is that better?
“This is besides the fact that we haven’t seen cooling like this for about 50 years.”
Really? Which data set and over what period?
For example using UAH and a 6 year trend window, the current rate of cooling would be 0.2°C / decade, but there have been several 6 year periods over the last 40 years with a much faster cooling rate, including a couple of periods last century with trends over 0.5°C / decade. And if you think 6 years is a meaningful length for a trend, note there have been times not that long a go with 6 year warming trends over 0.9°C / decade.
If the projections are true we will not have seen cooling like this in 50 years. Is that better?
Nobody said anything about La Ninas contributing to warming.
As for CO2, please provide proof that the extremely mild warming the earth has enjoyed over the last 150 years was caused by CO2. Especially considering the fact that CO2 levels only started rising about 70 years ago.
Oh well, not looking forward to another chilly winter but so be it, weather after all. At least I don’t have to worry about freezing in the dark like some in northern Europe might face.
You’ll jinx it if you carry on like that! Seriously though, I’m in that area and I’m not particularly looking forward to this winter, it might be quite harsh.
I have friends to the north and I will be concerned for them, you too! I can always take a road trip to the Algarve if it gets too bad. It is not that hard to stay warm in the Porto area, mostly I worry about the garden and the tender tropical plants that flourish here unless it drops down to 0C too many nights in a row.
Our winter on the West Pacific will be wet and cool again. This year’s winter was cold and wet. In El Niño years it is sunny and dry for months, with warm days but cool nights.
At least I’ll be able to be a Climate Refugee to southern Europe again like most years before they locked us up and refused to let us leave the country.
We in southern Europe do seem to just miss the worst of the cold, especially down in the Algarve. I guess I am a climate refugee too, we fled the cold of central Virginia for the much milder winters of northern Portugal!
Slight correction: “north-WEST” Portugal. For me, Lisbon dweller (better than Lisbon: Oeiras dwelling), it is not easy to survive harsh winters in the NE and central-East parts of the country. You go 150 km east from Porto and you know what I mean…
Joao, you are correct, I live less than a kilometer from the prias, definitely north-west Portugal. I shudder when I see the deep snows in the NE and am ever so thankful I live where I do. Nevertheless, it was a surprise to have to endure 0 and -1 temps a few nights last winter this far west. Braga got a lot colder!
Braga is in a small, relativelly closed depression. You understand Portuguese, I don’t know if you have already someone calling it sarcastically “O penico do Céu”, meaning not only the potty from the sky but also the potty from Heaven, as you know Heaven and sky translate to the same Portuguese word; and Braga has its traditionally conservative catholicism, etc. It seems that locally it is known as being more rainy than the places around, but I am not sure; one side of my family came from there but I have seldom visited the place and did not get acquainted with its ancestral traditions. Anyway, it is a kind of geomorphological potty, and that is the cause of some peculiarities of its weather.
Thank you for the information about Braga. I have friends who live in Taipas and we go to Braga for shopping often. But never stay long enough to be impacted by their weather. Now I will have to pay more attention!
A cold and getting colder Humboldt current is feeding these La Ninas
https://agupubs.onlinelibrary.wiley.com/doi/full/10.1029/2018GL080634
https://ptolemy2.wordpress.com/2021/09/24/ocean-news/
A lot of things are lining up to cool.
This does not agree with the ENSO meter. Could someone explain that?
No
Strong la nina from this
https://climateimpactcompany.com/weekly-enso-diagnostics-ncep-cfs-v2-la-nina-forecast-now-stronger-than-last-year-2-2/
And this
https://psl.noaa.gov/enso/mei/
The guy moving the needle quit inJune
Around the 11th of this month there was a notable shift in surface winds in the Eastern Pacific off of the west coast of South America. The shift meant that a large portion of the coastal winds moving north had a base around 55 S. So they are bringing cold air from the south all the way up close to the Equator. They also push colder surface waters to the north up the coast line. … https://earth.nullschool.net/#current/wind/surface/level/overlay=temp/orthographic=-72.96,-47.08,672/loc=-85.480,-40.647
The screenshot is from the 11th.
The enso meter on this blog page is stuck
Warmistas tell us that if it warms it is obviously necessary to reduce CO2 emissions to solve the problem, if it cools, it is obviously caused by some aspect of “Global Warming” and we need to reduce CO2 emissions to solve the problem. When it obviously cools, Warmistas adjust the data so that it still appears to warm even if people are freezing to death.
Winging snowflakes! Took forever for me to finally convince all my family members that the Climate Emergency was totally bogus. They either gave in to my constant lecturing or realized that if they wanted to vacation in the Casa Nova in Portugal they better come over to my side things….
Whatever happens, those in control of the narrative will insist manmade climate change is to blame. Only when people must chose between adapting to ‘climate change’, or dying in the dark and cold, will this charade be brought to an end.
For the UK and parts of Europe, that time could come as early as this winter.
La Nina: Globe Expected To Continue Cooling Into Next Year, Extending Cooling Streak To 7 Years.La Nina is a result of cooling conditions, not a cause.
Since no-one knows what the cloud cover will be in the next 6 months no one can predict whether a La Nina or El Nino will develop.
If one follows the trend and trends had definite inputs then one could make predictions but if there are causes for the trends we do not know how to work them out yet.
All one can say is that the current cooler conditions have a carryover cooling effect for 4 months which should be very pleasing to skeptics, if it eventuates.
No warmest year, will not even be close if the cooling persists.
The only way CAGW will be disproved is by a continual run of results in a cooling direction.
The previous pause showed this, that is why it is always attacked and not acknowledged.
The current pause of nearly 7 years could extend out to 10 years by 4 months time if we had 4 months of below top 10 monthly results.
Whatever one hopes for or predicts on hope always goes the other way so best to stop here.
Well, just based on current conditions in Europe, it has been cooler than usual for summer and fall. Last summer was similar but warmer and we had zero and below zero along the coast here. Only 40 km to the east they got heavy frost on some nights and single digits during the day. If this cool trend continues, I fully expect it to be a chilly winter!
“just based on current conditions in Europe, it has been cooler than usual for summer ……”
Sorry, but not the case …
https://www.ecmwf.int/en/about/media-centre/news/2021/heat-rain-floods-and-fires-european-summer-2021
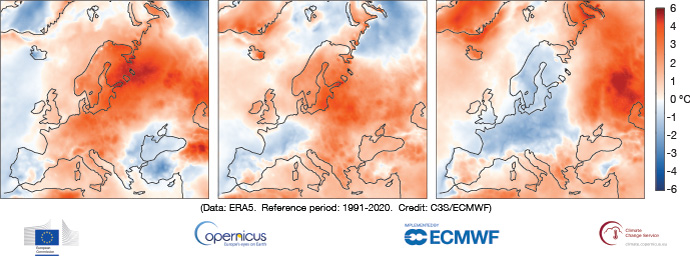
Surface air temperature anomaly for June, July and August 2021 (left to right) relative to the June, July and August averages for the period 1991–2020. Data source: ERA5. Credit: Copernicus Climate Change Service/ECMWF.
“Europe experienced its second warmest June on record this year, with temperatures 1.5°C higher than the average for 1991–2020, according to the Copernicus Climate Change Service (C3S) run by ECMWF.
It also experienced its second warmest July, with temperatures 1.4°C above the average, while August was close to the 1991–2020 average.
Overall, the period June–July–August ranks as the warmest European summer, although it is closely followed by the summers of 2010 and 2018. Particularly high temperature anomalies were recorded in the eastern part of the continent (see the plot at the top of the article).”
Do you live in Europe? I do and it has been wretchedly chilly all summer!
Which should I believe: the evidence of my own senses (Summer 2021 in the UK was mediocre apart from a couple of hot days) and your assertions that it was one of the hottest ever?
You should always prioritize observations over personal feelings. Also, the UK is not the same thing as Europe.
The chart shows a very striking drop from Sept. to Oct. The UAH Sept. update will be out in about 10 days or so. Then we can see how well UAH atmosphere correlates with this ENSO ocean prediction. Interesting.
UAH temperature data tends to lag ENSO by 4-6 months. All you will find out with the September data is what conditions were like last Spring. If you want to get more up to date information you need to look at SST data. Unfortunately, it is never updated as efficiently as the UAH data.
Cooling in reaction to warming?
This is what emergent thermal homeostasis looks like (term coined by Willis Eschenbach):
https://ptolemy2.wordpress.com/2021/07/08/emergent-thermal-homeostasis-a-new-paradigm-for-ex-pluribus-unum-climate-stability/
Get used to it.
It will help Judah Cohen also in his tortuous efforts to explain how global warming is causing colder winters.
And yet they tell us that each passing month is the hottest month ever recorded
Every month is warmer. Last month was warmer than this month, and this month is warmer than next month.
Who tells us that exactly?
NOAA said that July, 2021 was the hottest month ever, ToeFungalNail. When it was shown that no data set supported their (false) assertion, NOAA didn’t issue a correction. That speaks volumes about NOAA’s dishonest agenda.
Untrue.
July is the warmest month in the NOAA dataset. (Joint warmest with July 2019 if you include the CI). GISTEMP also has July 2021 and 2019 as joint warmest. HADCRUT has not reported July 21 yet and RSS and UAH measure a different quantity.
Last El Niño was in 2019. Last Super El Niño was in 2016. Remarkable that the cooling trend has held despite a strong El Niño in 2019.
John
The monster El Niño in 1997 was of the Bjerknes type. This means that Peruvian cold upwelling was cut off completely and the trade winds (west to east) stopped and briefly reversed. It left a lot of warm water at the east equatorial Pacific. The classical Bjerknes type El Niño – and only this type – is followed immediately by the counter-cycle, the reactive strong La Niña. The one in 1999-1999 following that El Niño was very strong indeed. This La Niña involves renewed strong cold upwelling off Peru and – as Willis Eschenbach explains in his “two-stroke” pump model, this responsive “part 2” La Niña literally pumps all that leftover hot water away from the equator, a lot of it northward toward the Arctic. This whole Bjerknes cycle impels a large bolus of warmer water poleward and is so powerful that global mean temperatures step upward by a significant amount. This happened in the early 2000’s.
By contrast the big El Niño in 2016 was of the “Modoki” type (“different but the same”) – please refer to Bob Tisdale’s comprehensive descriptions of the ENSO events. What this means is that the trade winds might weaken but they never stop, or reverse. The Peruvian upwelling might weaken a bit and move to a different location a bit to the south, but the upwelling doesn’t come close to stopping. (Checking the Peruvian anchovy fishery landings is the easiest way to check this, they are an index of upwelling.) Importantly, the region of equatorial Pacific warming is different in a Modoki El Niño, is is displaced to the west, happening in the mid Pacific rather than to the east off Peru. It’s a different beast altogether.
And the most important difference with the Modoki El Niño is that there is no immediate strong La Niña driving the warm water poleward. It doesn’t engage the Bjerknes transient positive feedback (lacks the element of excitability). So the mass of warmer water stays – just hangs around – at or just north of the equator and its heat slowly dissipates. In some areas this causes persistent warmth but crucially the heat leaves the climate system to space – in contrast to the Bjerknes type El Niño where the warmer water is circulated poleward and stays in the climate system, warming the climate as seen in the early 2000’s. Instead, the result of a Modoki (per Tisdale) El Niño is the opposite – a climate cooling due to loss of heat to space, rather than warming due to poleward heat transfer.
I remember (though I can’t back it up yet by finding the post) back in 2016 making this same point about the El Niño of that year that everyone was getting excited about. I predicted that “since this is a Modoki, not Bjerknes type El Niño, the end result is likely to be gradual cooling, not warming, of the climate. And so it has proved.
So it’s not enough just to say “El Niño” – it makes a huge difference which type of El Niño takes place: one type warms, the other cools, the climate.
Useful stuff, thanks to you, Willis and Bob.
In the end though, what matters most is the balance between La Ninas and El Ninos (of whatever type).
I contend that solar effects on global cloudiness, via changes in jet stream meridionalty are what most influences that balance due to the changs in solar input to the oceans.
Whereas we saw upward temperature steps from one ENSO cycle to the next during the 20th century (despite a cooling period during the 1960s) I expect that f the sun remains quiet we will soon see similar downward steps as a reult of La Ninas beginning to dominate over El Ninos.
A slow process, to be sure, and I will likely peg out before it all becomes clear.
Stephen
No doubt there is solar entrainment to ENSO on at least some time scales.
On short scales it is the annual cycle that entrains ENSO, thus El Ninos are always around Christmas (hence the name), as established originally by Tzipermann, Kane and Zebiak:
Locking of El Niño’s Peak Time to the End of the Calendar Year in the Delayed Oscillator Picture of ENSO in: Journal of Climate Volume 11 Issue 9 (1998) (ametsoc.org)
However on multidecadal scales there are as you say “seasons” of el Nino or La Nina predominance (or nothing in particular) and it’s likely there is solar entrainment involved in this. While meteorological phenomena such as the jet streams are invoked – no doubt correctly – the ocean itself plays a role, including the recent cooling of the Humboldt current which feeds Peruvian upwelling.
Bob Tisdale’s magisterial posts on ENSO remain highly relevant and should not be overlooked.
With about 1 million of these, we could speed up cool down:
https://news.yahoo.com/worlds-biggest-carbon-removal-plant-110600071.html
But not with my money…
While La Nina is effective in cooling the atmosphere at least temporarily it is not effective at all in cooling the climate system as a whole. Schuckmann 2020.

“Overall the globe has cooled substantially since the last El Nino ended in 2016,”
Is this correct.
I’m sure we have had more El Nino’s since 2016 plus a preponderance to near El Nino gor 5 of the last 7 years.
We are only starting to move to cooler temperatures.
Depends what is meant by “substantially”. Global temperatures are expected to cool for a period after a major El Nino, just as they are expected to warm after a big La Nina. GISS surface data shows cooling of -0.17 C/dec since 2016, but it’s not statistically significant, given the shortness of the time involved ( ±0.77 C/dec (2σ)). UAH (satellite, lower troposphere) shows -0.24 C/dec cooling; but again, nowhere near statistical significance (±0.90 C/dec (2σ)).
According to NOAA’s ENSO Index, since the 2016 El Nino ended there have been 3 periods of La Nina cooling and 1 of El Nino warming. The average 3-monthly Index value since the end of the 2016 El Nino is negative (-0.2).
Not necessarily. UAH typically lags ENSO conditions by around 6 months, so August’s temperature would have been affected by ENSO conditions around Feb/Mar. Likewise, September will reflect Mar/April and so on. The ENSO index rose slightly between Feb and Jun 2021, so we shouldn’t expect to see a big fall in UAH global temperatures before Feb 2022.
NOAA has changed the method used for computing the ENSO index and is no longer a valid indicator of ENSO. With each passing year it gets worse and worse. The result is fewer El Nino events and more La Nina events. Sorry.
I’m not at all “sure” where you got your “sure and for certain” information.
For me the SOI / ENSO indexes I’ve looked at recently (including the two selected for the graph below) were mostly in the “La Nada” (-0.5 to +0.5) range from mid-2016 until mid-2020, and have been “La Nina” since then.
– – – – –
Notes
1) GISS comes with a standard (WMO) Reference Period of 1951-1980. I’d already “offset” it to a 1991-2020 version for a separate “direct comparison” project.
UAH (V6) has used “RP = 1991-2020” since January 2021.
2) “avg.” = “13-month, centered, rolling averages”
3) All of these datasets are currently available up to August 2021 (as plotted below)
Interesting graph, shows melting ice has absorbed more ZJ than the warming atmosphere. Wonder where those ZJs go instead when that buffer is exhausted.Tipping point anyone? No thats right, its obviously cooling.
It is believed the PETM was 12C warmer than today. So…
Graph is fake. This is a seasonal change not a 30 year change. From late early spring to summer.
I did not photoshop or in anyway fake that graph. It comes from Schuckmann 2020 which I did cite in my post.
Oceans have retained more heat because net evaporation (evaporation minus ocean precipitation) is slowing down due to reduced sunlight over the oceans that has been in long term decline for the past 400 years. That slows the ocean circulation of cool water from high latitudes to the evaporation zones at lower latitudes. Hence the average temperature of the water increases because the rate of deep water circulation is slowing down.
And to put 400ZJ into perspective, it is 25 days of sunshine – just 0.1% of the sunshine reaching earth in the past 60 years. It is trivial with regard the climate system.
What are some observations that you believe could be used as falsification tests for those hypothesis?
Each watt is 161 Z(J). This years measurements.
Each watt is 161 Z(J). This years measurements.
Can you provide more details as to what is meant by each watt being 161 ZJ?
It’s always good to see that Climate “Scientists” can measure the temperature of every cubic meter of seawater at every depth everywhere in the oceans to +-0.001K in order to calculate enthalpy changes with this precision.
They obviously cant.
The world isn’t perfect, but we have to accentuate doubt don’t we?
Complication requires sampling.
Like even UAH samples a section of the atmosphere and 2 scientists (with sceptical bent) interpret it in the way they see fit.
Same data as RSS use, which better matches surface data tends.
No doubt as to who is correct though is there (sarc)
New South Wales mid north coast this year has been colder than usual and I have burnt twice the firewood in my wood heater than I did last year (2020).
The past several years have been colder.
advantage, slayers
What’s the forecast for Glasgow during the COP meeting?
Arr. darn ere in rooral suffack I done smelt the first wood smoke of the winter. There being no oil, electricity or gas to burn.
I done herd them powler bares bin migrating sarf to Essex – its gwin ter be a hard winter.
us’ll be eating the pig’s mangle wurzels by winter’s end. Mark My words.
One notices that Arctic ice bottomed at 4.7 Wadhams this year- well up. Save 2012 and 2019 that’s 15 years more than four Wadhams. Oh, what about the 2.4 million households in fuel poverty even before the UK governments present self induced catastrophe
The monster El Niño in 1997 was of the Bjerknes type. This means that Peruvian cold upwelling was cut off completely and the trade winds (west to east) stopped and briefly reversed. It left a lot of warm water at the east equatorial Pacific. The classical Bjerknes type El Niño – and only this type – is followed immediately by the counter-cycle, the reactive strong La Niña. The one in 1999-1999 following that El Niño was very strong indeed. This La Niña involves renewed strong cold upwelling off Peru and – as Willis Eschenbach explains in his “two-stroke” pump model, this responsive “part 2” La Niña literally pumps all that leftover hot water away from the equator, a lot of it northward toward the Arctic. This whole Bjerknes cycle impels a large bolus of warmer water poleward and is so powerful that global mean temperatures step upward by a significant amount. This happened in the early 2000’s.
By contrast the big El Niño in 2016 was of the “Modoki” type (“different but the same”) – please refer to Bob Tisdale’s comprehensive descriptions of the ENSO events. What this means is that the trade winds might weaken but they never stop, or reverse. The Peruvian upwelling might weaken a bit and move to a different location a bit to the south, but the upwelling doesn’t come close to stopping. (Checking the Peruvian anchovy fishery landings is the easiest way to check this, they are an index of upwelling.) Importantly, the region of equatorial Pacific warming is different in a Modoki El Niño, is is displaced to the west, happening in the mid Pacific rather than to the east off Peru. It’s a different beast altogether.
And the most important difference with the Modoki El Niño is that there is no immediate strong La Niña driving the warm water poleward. It doesn’t engage the Bjerknes transient positive feedback (lacks the element of excitability). So the mass of warmer water stays – just hangs around – at or just north of the equator and its heat slowly dissipates. In some areas this causes persistent warmth but crucially the heat leaves the climate system to space – in contrast to the Bjerknes type El Niño where the warmer water is circulated poleward and stays in the climate system, warming the climate as seen in the early 2000’s. Instead, the result of a Modoki (per Tisdale) El Niño is the opposite – a climate cooling due to loss of heat to space, rather than warming due to poleward heat transfer.
I remember (though I can’t back it up yet by finding the post) back in 2016 making this same point about the El Niño of that year that everyone was getting excited about. I predicted that “since this is a Modoki, not Bjerknes type El Niño, the end result is likely to be gradual cooling, not warming, of the climate. And so it has proved.
So it’s not enough just to say “El Niño” – it makes a huge difference which type of El Niño takes place: one type warms, the other cools, the climate.
We’re only talking about a period of ~5 years since the peak of the 2016 El Niño. If you look at the 1998 El Niño, the UAH data set was still in negative trend some 17 years after that peak. It was only the 2015/16 El Nino that bumped it into warming again.
Admittedly UAH is an outlier on the cold side compared to the other satellite data and surface stations, but even these persisted with cooling for several years following the 1998 El Niño. RSS has a negative trend for nearly 6 years post 1998. So it is not at all unusual for a prolonged period of cooling to follow a very strong El Niño event; on the contrary, it is widely expected.
An important point not to miss here is that, although temperatures have fallen since the peak of the 2016 El Niño, they remain historically very high overall. Such that when a 30-year linear trend is added to ‘before and ‘after’ the 2016 El Nino event, the long-term warming trend has quite often increased (UAH illustrated).
The consensus of most temperature records is a step up in global temperatures after 1997-2000, looking on a decadal scale. Moving all that El Nino warm water takes some time, as does everything in the ocean. So yes – it’s way to early to conclude anything for sure after 2016.
UAH_LT_1979_thru_September_2017_v6.jpg (2340×1350) (drroyspencer.com)
There is one active spot and a large coronal hole on the Sun. A strong geomagnetic storm is predicted in the coming days.
The 3.4 Niño Index will now fall below -0.5 C.
You don’t have to believe me. Observe reality.
http://www.bom.gov.au/archive/oceanography/ocean_anals/IDYOC007/IDYOC007.202109.gif
The current apparent increase in geomagnetic activity may result in more rapid movement of tropical storms in the Atlantic toward North America.
http://tropic.ssec.wisc.edu/real-time/mtpw2/product.php?color_type=tpw_nrl_colors&prod=natl×pan=24hrs&anim=html5
In my opinion, the coming winter will be snowy in eastern North America and also in Europe. Record amounts of snow may occur in the Alps.