Reposted from the NoTricksZone
By Kirye
and Pierre
Just a short post today about sea ice trends at Antarctica, a place that global warming alarmists don’t like talki9ng about

For some reason, the Japan Meteorological Agency (JMA) doesn’t add a trend line to the annual minimum and mean sea ice extent plot for Antarctica.
So we’ve added these trend lines:

Data source: JMA
Minimum sea ice extent has remained steady over the past 4 decades. But both the mean and maximum sea ice extents have risen, meaning more ice at the South Pole.
More ice of course only forms when the temperature drops. Global warming has yet to reach the South Pole. This is one of the most inconvenient regions on the planet for the global warming alarmists.
It will be ‘hidden ice’, you know, like all those penguins they discovered a couple of years ago that weren’t supposed to be there!
Jen Psaki says they weren’t stranded.
And besides, we have supplied our partners in the Antarctic Taliban with all the biometrics needed to make a positive id on the missing birds, who apparently aren’t interested in leaving.
attack the Woman! excellent tactic!!
You can’t deny them their fun. She’s a liar and a waste of space. I can’t think of anyone so deserving of our opprobrium, except her boss, his cabinet and the speaker of the House on down. They are what ad hominem was invented for.
What a sexist comment. What does her being a female have to do with anything? We would be just as critical if a male had given the same press briefings.
chris has no interest in anything other than distracting others. It’s not like he/she/it has the intellectual capacity to actually engage on the facts.
Psaki is the official ‘spokesbeing’ for the administration. Citing her is not an attack on her! It is simply acknowledging that she is the source. I think that you have your blinders on backwards.
Are you arguing that we should ignore liars, when they are women?
So is this what women’s’ lib is all about. Women are equal to men but if you say the truth about a LIBERAL woman, you are evil.
But Sarah Palin, now she is not a real woman, so all the attacks against her are perfectly acceptable to you Chris??
To grant someone special protection based on their gender is particularly patronizing and sexist. She is a public political figure, and one who tends to make some rather dubious claims.
To shield her from criticism is to reduce her to the level of an infant, imbecile or domesticated animal.
I think those 3 terms are all apt descriptions.
Defend the liar, how typical for a leftard such as you.
Did they circle back?
Always turning left
Jen Psaki says lots of things, most of them aren’t true or are complete fabrications. Any one who listens to her deserves to be corrupted by her lies.
grasping at straws?
when all else fails, focus on an irrelevant detail.
Well done, Richard
Richard’s comments were spot on. Losing several hundred thousand penguins and then blaming their disappearance on “climate change” (especially in a region where the “climate” hasn’t changed in millions of years).
Look who’s talking!
The only one grasping at straws here, is you chris. Like most socialists, you are desperate to change the subject because you know you can’t win on the facts.
I agree with you, chris is the only one grasping at straws to change the subject because they can’t win on the facts.
But why compere an ill- informed idiot with a socialist ?? You know nothing about his/her political leanings.
Abraham Lincoln was a socialist … “that government of the people, by the people, for the people, shall not perish from the earth” … are you saying Lincoln was wrong ???
I think that’s called Democracy, not Socialism. You need to go back to your political science reading.
So in your “opinion”, being permitted to vote for the government of your choice, makes one a socialist?
Socialism is the art of using government to take money from those who work in order to buy the votes of those who would rather not work.
And right on cue you start crying, again so typical for leftards like you.
You’ve got the wrong name. It’s Griff who grasps at straws focusing on irrelevant details. There was a heat wave somewhere. We’re all going to die.
Hidden, like the 2 degree C DROP in temp. since 1979.
And this:
https://scitechdaily.com/new-generation-of-climate-models-increased-snowfall-will-offset-sea-level-rise-from-melting-antarctic-ice-sheet/
Charles, it appears that the graph is missing in the actual article.
I am unable to get the graphs to post as well.
Something with their WordPress server. (Happening for all browsers.)
Click on the article, then refresh the page – may take several times before you can convince the server to cough it up.
I don’t use the commercial version, so can’t say that I’m right here – but it’s acting like a limit on how much the server is being allowed to send at one shot. That would explain the first one or two graphics coming up, and the rest not being served (the server knows what it has recently sent to an IP, so will skip sending all of the page again, just what it didn’t send previously).
That worked for me. Thanks WO.
I got it on reloading.
I went back to the article and pressed F5 and it showed up. This is a new ‘feature’ that I don’t appreciate.
Don’t look now, but the Arctic isn’t exactly helping their cause either!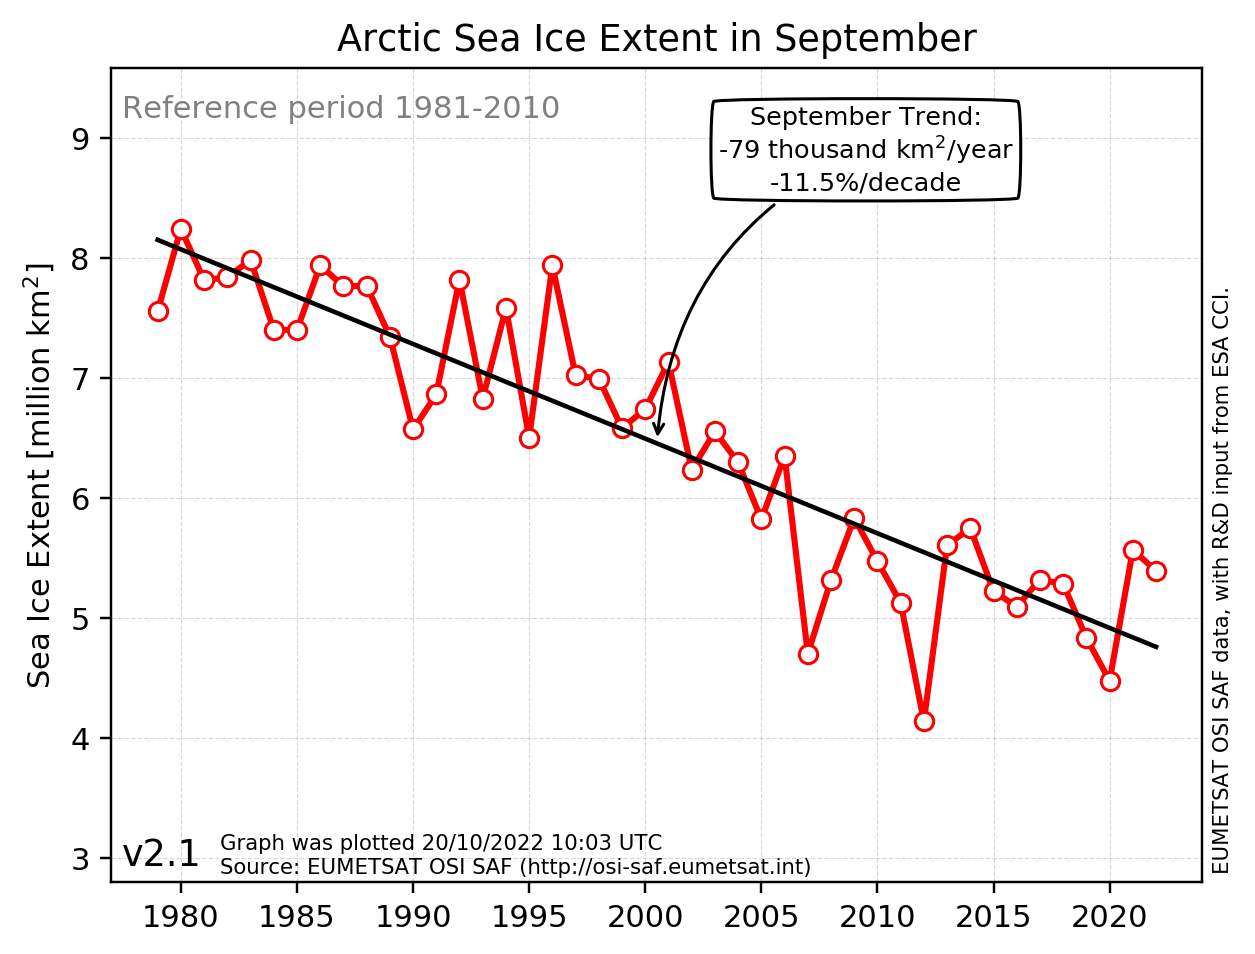
Antarctic actual:
http://nsidc.org/data/seaice_index/images/daily_images/S_stddev_timeseries.png
Arctic actual:
http://nsidc.org/data/seaice_index/images/daily_images/N_stddev_timeseries.png
Both well explained by orbital mechanics – since 1980.
55N sunlight up 0.4W/sq.m in April but down 0.3W/sq.m in September. Overall, a slight annual increase
55S up 0.4W/sq.m in March but down 0.5W/sq.m in October, overall a slight net annual decrease.
There is climate change. Always has been and always will be. Fortunately the ocean surface temperature is thermostatically constrained to upper and lower limits that regulate the energy flows.
has anyone told the BBC?
It seems to me that you have chosen a chart that exaggerates the Ice extent at the Arctic. Anthony gives us a more complete picture here:
ssmi_range_ice-ext.png (720×540) (wp.com)
That chart is from DMI. I suggest you contact them if you think it is wrong
BTW that chart only goes up to 2020. We are talking this year
You don’t read graphs very well. The last year LABEL is 2020, but the last datum is 2021. Even at 78 years old with bad eyes, I can see the graph is current.
My eyes can clearly see the data stops on the 2020 border.
Yes, however bad your eyes are, it would be difficult to graph 2021 minimum Arctic sea Ice extent, since it hasn’t happened yet.
It’s going to be well more than 1 whadam (1 Million sq kms) above 2012
Right of 2020 line, the next will be 2025 so the chart is absolutely correct. I offer a second pair of glasses 😀
I reralise the discussion is about 2 different charts.
Tom Johnsons chart ends 2020, that’s right, not that from rah
Maybe the fact that you admit your eyes are bad explains why you think the graph is current.
The text on the graph indicates the plotted date as of 29.8.21.10:00
Pair of glasses ? 😀
Sorry, was wrong, commented above about.
“That chart” should have been identified with the relevant link, much farther upthread, by others.
BTW
This is the latest NORSEX chart:
I’m surprised you tried to cover it up!
So arctic sea ice present date, is above every year since 2007 considerably.
According to NSIDC, yesterday’s extent was below that point in 2009, 2013 and 2014, and about tied with 2010.
https://nsidc.org/arcticseaicenews/charctic-interactive-sea-ice-graph/
So John is this a conflict of different data?
Could be. NOAA uses 15% ice coverage. Its satellites might also treat surface meltwater differently, too. Or maybe NOAA cooks the books.
Antarctic sea ice extent yesterday was higher than all but four years, ie 2006, 2010, 2013 and 2014. It was higher than the averages for each of the four decades in the dedicated satellite record.
…. yes, including 1979, the alleged first year of satellite data.
Starts 1972:
https://seaice.uni-bremen.de/data/amsr2/today/extent_n_19720101-20191231_amsr2.txt
https://seaice.uni-bremen.de/data/amsr2/today/extent_n_2020_amsr2_smooth.txt
https://seaice.uni-bremen.de/data/amsr2/today/extent_n_2021_amsr2_smooth.txt
Thanks.
Just check the years reported in ‘your’ graph.
Got the hint?
This year’s Arctic maximum was higher than 1974’s.
👍
A good graph but like all these the bottom part of data has been removed so the missing space from 2 down to zero, measuring ice extent, gives the impression of arctic ice close to being gone in the early autumn.
It gives the impression (to the impressionable) the politicians want to give. The goal is to convince, not inform.
The goal is to deceive, and not inform.
How interesting that you think a chart ending in 2020 is more apropos than charts showing 2021 data…
False information!
That is a graph of the moving decadal average. Not the actual ice extent. If you want to disprove something, you have to use the same data.
The artic loss of sea ice is due to ocean temperatures, not atmospheric temperatures. Care to explain how CO2 and its sole mechanism of radiating 13 to 18 micron LWIR can warm water? If you can’t explain how CO2 can warm water, you can’t claim it is causing the loss of sea ice. SImply look at the cloud cover over the oceans. Fewer clouds mean warmer oceans.
Same way IR warms the atmosphere.
By reducing heat loss to space.
The skin is warmed by IR.
Yes?
The skin is where the H2O photon leaves
Yes?
The skin receives it’s heat from below.
From the SW warmed water
Yes?
Now – 2nd LoT.
Heat moves from hotter to colder
Yes.
Most efficient when the cold body is colder
and/or the hot body is hotter
Yes?
So what happens when the skin is warmer.
There you go.
Simple thermodynamics
That scientists know and have observed
But you dont.
https://agupubs.onlinelibrary.wiley.com/doi/pdf/10.1002/2017JC013351
So you are saying that CO2 behaves exactly the same as IR radiation?
“Thus, more heat beneath the TSL is retained leading to the observed increase in upper ocean heat content.”
That research is absurd. They simply stated a hypothesis without any experimentation. Why is that research absurd?
1) Water Vapor saturates the air about the oceans and absorbs the same wavelengths as CO2. With or without CO2 the backreaction of 13 to 18 microns is a constant.
2) Where is the simple experiment showing that additional 13 to 18 microns will warm water. That is extremely easy to test, yet no one does it.
3) The additional IR at the surface most likley causes COOLING due to evaporation.
4) The thermal skin layer doesn’t stop radiation, it facilitates it.
5) They simply focused on LWIR and not the fact that fewer clouds have resulted in more warming visible radiation reaching the oceans.
6) El Ninos and La Ninas have nothing to do with CO2, and they control the ocean temperatures
I could go on and on and on, but that research is pure nonsense.
https://www.realclimate.org/index.php/archives/2006/09/why-greenhouse-gases-heat-the-ocean/
Is this a complete Joke? Real Climate? Really?
<b>”Clearly it is not possible to alter the concentration of greenhouse gases in a controlled experiment at sea to study the response of the skin-layer. Instead we use the natural variations in clouds” </b>
Newsflash, 1) clouds block incoming warming visible radiation which causes far more temp change than IR could ever hope to do
2) H2O absorbs the same wavelengths as CO2 and H2O saturates the atmosphere above the oceans, so with or without CO2 100% of those wavelengths get absorbed. You can test that in a gas cell.
3) Do you honestly think a microlayer can cause such a huge impact on temperatures? If it can, you wouldn’t need feet of insulation, you would just spray water on your house.
These Climate “Scientists” simply misattribute a cause to an effect.
“When clouds are present, they emit more infrared energy towards the surface than does the clear sky.”
You true believers are simply gullible and completely blinded by this false narrative. Simply read that above experiment assumption. The Graphic shows that as Net-IR decreases, so does the temperature of the Microlayer. No freakin duh. The oceans cool by radiating LWIR. What are clouds? Water in the sky. The oceans radiate LWIR to cool, but the clouds simply send the IR back. That certainly would slow cooling of the oceans. Problem is, clouds, ie H2O absorbs 100% of the LWIR emitted by the oceans. CO2 only impacts 13 to 18 microns, a negligatable amount of energy, energy that is also absorbed by H2O. Once again, they attribute the cause to CO2 when in reality it is H2O. In no way does that experiment isolate the impact of CO2 on Water Temperature. What a joke.
So how does it cause the increases in sea ice under discussion here ….?
Antarctica is above 1979 levels, and the Arctic ice sea loss turned the corner in 2007 and is now on the rise. CO2 has a bipole moment ??
“3.2. Infrared Radiation From Clouds Detecting changes in the downwelling IR irradiance resulting from increases in anthropogenic GHGs is difficult since consistent data sets with long timeframes and exceptionally good calibration are required to produce a significantly detectable signal”
Think about the insanity of this experimental design. LWIR energy is a fraction of the energy of visible radiation by a log scale. Just what do these Einsteins think block visible radiation from reaching the oceans? Clouds. They are blaming the altering of the ocean temps on LWIR and completely ignoring the fact that clouds block the warming visible radiation. Climate “science” is a joke. This is like doing an experiment on weight gain and having someone order a Big Mac Combo with a diet Coke, and claiming that the Diet Coke was the cause of the weight gain.
Take it easy on him 😉
Clouds provide for warming at nighttime. GHE, anyone?
Yep, but CO2, not so much, if any that can be measured – and that would be the contribution above 280ppm which is logarithmically less than “any that can be measured”.
It’s dead Jim
A doubling of CO2 concentrations to 800ppm should have negligible impact on global temperatures according to real physicists. Its lost in the noise of other energy flows.
Exactly, and that’s what we’ve seen in the half-doubling+ to date – not measurable above the baseline.
You have entirely missed the fact that the sun has near IR that H2O readily absorbs. The ocean surface doesn’t just warm from below. Evaporation occurs due to absorbed near IR.
Jim, I don’t know where you got the illustration, but it leaves some things to be desired. Visible blue light is nominally 400-500nm, green 500-600nm, and red is 600-700nm. Sodium yellow should be about 589nm.
The illustration shows yellow at about 500nm, what should be the boundary between blue and green.
There are probably better graphs, I have a couple. But this shows that there is a large amount of near IR entering the earth and that H2O absorbs a lot of it. It’s one of those water feedback problems that never gets discussed. CO2 is not the only nor the primary way water receives heat.
Here is one study that looks at H2O and O2 absorption of near IR.
https://agupubs.onlinelibrary.wiley.com/doi/pdf/10.1029/1999JD901153
Dr. Happer”s latest work is informative also.
Yet you never see any climate scientists address this issue with any detailed studies. Probably afraid that it will take away from water feedback generated by CO2.
Imagine that. There is research contradicting that research claiming CO2 caused the warming.
“Most warming comes from water vapour
In their study, the authors’ aim is to simplify the method reaching a figure for climate sensitivity not only for CO2, but also CH4 and N2O, and to do so by determining just how atmospheric absorption has resulted in the current 33K warming and then extrapolating that result to calculate the expected warming due to future increases of greenhouse gas concentrations.”
https://notrickszone.com/2021/08/29/new-atmospheric-science-publication-finds-quadrupling-co2-would-lead-to-only-1-0c-increase/
This paper needs to be looked at in detail by WUWT. It completely destroys the current climate narrative. Only 0.5 C of total warming going from 400 to 800 ppm of CO2. Also, only 0.24 C of recent warming as a result of going from 280 to 420 ppm.
Of course this graph has been decapitated as there is all the space from 4.5 to 0 on the ‘y’ axis. This creates an illusion of greater ‘loss’ or fluctuation. I’m afraid Darrell Huff warned about this in his book ‘How to Lie With Statistics’, published in 1954. It’s called the Gee-Whiz graph.
And all temperature graphs should start a 0 K.
Maybe the volcanoes are taking a break? At any rate, the news will treat more ice as weather, not to be confused with climate, which is changing and tipping.
Ron, as you are aware, this has always been a sociopolitical flim-flam. A plan cooked up by the faceless cultural and bureaucratic elite. With its origins at the central authoritarian loving United Nations, where they drew up a global vision to control the great unwashed masses with a globalist agenda to prevent third world industrialization and control the use of fossil fuel in industrialized nations.
In industrialized “democracies” they control the education system, at every level, and the Propaganda Press and now social media is run through a Ministry of truth. Disclose the truth and risk cancellation. Fear what comes next. Those who are paying attention have seen from the beginning of this grift, that when facts don’t fit the narrative that if they can’t obfuscate the facts they SPIN the narrative.
The alarmists like to talk about polar amplification in spite of the fact that there’s not much evidence that the Antarctic is displaying such a phenomenon.
The climate is inconveniently complicated and stalwartly resists folks’ attempts at theorizing.
They forget Antarcticas CO2 is cooling, not “warming” 😀
From the papers I’ve read, I think they made that up to try to continue the CO2 scam. It was an inconvenient truth, and continues to be.
Here’s a couple of papers on reverse CO2 warming (ie cooling) over Antarctica:
https://ptolemy2.wordpress.com/2021/05/16/negative-greenhouse-effect-over-the-high-and-cold-antarctic-plateau/
It’s winter!
What else would it do?
And sea ice is not ice cap.
Stupid comment, Schroeder. The graph shows a 4 decade trend of increasing Antarctic sea ice. Nothing to do with it being winter in the SH. You should stick to playing your toy piano.
Why “inconvenient”?
They say, it is an ice cream on a hot pavement.
It is extremely cold in Antartica even in Summer despite the nonsense in the media.
This station is on the coast and this icecream will freeze.
CASEY -STATIONS OPERATED BY AUSTRALIA
Lat.: 66.27 °S / Lon.: 110.52°E Height: 40(m)
Year/Month Mean Temp[degC]
2020-01 1.5
2020-02 -2.6
2020-03 -8.9
2020-04 -6.6
2020-05 -14.6
2020-06 -15.4
2020-07 -13.5
2020-08 -17.1
2020-09 -12.5 –
2020-10 -10.6
2020-11 -5.6
2020-12 -2.3
2021-01 -1.0
2021-02 -2.2
2021-03 -6.7
2021-04 -14.4
2021-05 -16.0
2021-06 -13.4
2021-07 -15.4
Antarctica is the ideal location to isolate the impact of CO2 on temperatures. There is no Urban Heat Island Effect, no Water Vapor Effect, and a near-constant albedo. When you control for all major exogenous factors, what do you find? CO2 does not materially impact temperatures. Here is the data. Every “credentialed” climate “Scientist” out there has access to this evidence and yet they remain silent.
Here are the charts.
https://imgur.com/a/CDasqHH
Maybe being dark half year at a time doesn’t make it an ideal temperature study location….
It can if anomalies are considered
Winter is the best time of the year to measure outgoing IR radiation.
…. not to mention the lack of interfering water vapor
https://ui.adsabs.harvard.edu/abs/2017AGUFM.C21D1139S/abstract
This guy has bored us all the time about his superficial CO2 ‘findings’, and was given lots of hints like yours.
That won’t change his meaning.
Nobody forces you to lurk around this site
Just like no one forces you to write such redundant stuff.
If CO2 cools the Antarctic Plateau, that still leaves the sea ice conundrum. Antarctic sea ice grew to its record high in 2014, while Arctic ice was falling from its near century high in 1979 until its low in 2012.
At the moment, Antarctic sea ice is fifth highest since 1979, and all prior highs were in this century.
It looks as if 2021 has a shot at beating 2010, but 2006 and 2013 less so, and 2014 not a chance.
No contrails, no warming..
I agree! We miss a lot of water vapor and carbon dioxide at 12,000 m 🙂
I definitely LOVE this downvoting.
Childish behavior at its best!
No you DON’T
No it isn’t
2021 Antarctic Ice Extent is currently the 5th largest in 41 years… oops..
Here we can see, using departures instead of absolute values, how the last years behaved:
2019 manifestly was uncommon. Nowhere did you see that year anywhere at (No)TricksZone.
2020 and 2021 follow 2019, but have few in common with it!
For some, 2012 might look a bit strange, as this year has been excessively mentioned by Warmistas due to the extreme melting in the Arctic in September.
Arctic and Antarctic ice Bindidon. That dog don’t hunt any more. In fact, it’s been put down due to losing its ability to be a useful idiot guide dog.
Thanks for the hyperintelligent remark.
You’re welcome. When you understand it and stop looking like a fool in public, you can thank me. Have a nice day.
So why do they only graph to 1981 to 2010 average, not to the full 40 years, or to the 1991 to 2020 average?
If they insist on 30 years ONLY and on the arbitrary time scale of calendar decades why not update? Because using the most current 3 decades would include all the recent lower ice extent years and would make them all closer to or above the mean.
Cherry pick much?
Ha. Your reply is more intelligent that that above yours.
” So why do they only graph to 1981 to 2010 average, not to the full 40 years, or to the 1991 to 2020 average? ”
Not ‘they’ did; I did that, using their absolute data and daily climatology:
ftp://sidads.colorado.edu/DATASETS/NOAA/G02135/north/daily/data/
ftp://sidads.colorado.edu/DATASETS/NOAA/G02135/south/daily/data/
Didn’t you look at the light blue line? it is the 2016-2020 average… and you can see that 2021 is way above!
I’m not sure that a 1991-2020 based graph would show that more clearly…
*
Did you ever compare UAH6.0 LT wrt 1981-2010 and 1991-2020?
I guess you didn’t. The only difference is that the anomalies now are lower because the mean of 1991-2020 is higher than that for 1981-2010.
Later on today, I’ll manage to find the comparison on my HD, and post a link to it.
Do you think a 30 year span defines a climate? Do you expect the poles to go from very low temps to very high temps in that time frame? 30 years is the time frame for noticing a significant change, not a point you can forecast from. 30 years is not even long enough to know what natural variation truly is. Maybe ten 30 yr periods would let you know, try that!
You don’t even seem to be interested about what I write, let alone why I write it.
You are only interested in producing your ego everywhere on this blog.
I’m replying to Drake, asking himself for similarly small periods.
Your reply to my comment is perfectly redundant, Mr Gorman.
I prefer to use departures from means, but I think you might prefer absolute data, no problem for me.
Last year I made a superposition graph out of absolute 1 degree global HadISST1 ICE data for the Arctic (going far earlier back in time):
And now I just made the same for the Antarctic (with less historical data):
As you can see, the austral corner behaves quite different!
There are now 9 years this century currently below 2021. What part of “that dog don’t hunt” can you not grasp?
Californian, your stoopid arrogance is a bit boring.
To you maybe, in your fake voice in head response. It doesn’t matter whether I’m arrogant or a wallflower, the data is the data and you didn’t present the whole data. Trying to pass yourself off as a real scientist on this site ain’t gonna be a success story.
You and griff may be unhappy to know that it could even get to twelfth highest minimum this century and you know what that means. Don’t soil your pants.
Drake
You asked above for a graph wrt the average of 1991-2020 instead of wrt 1981-2010.
I apologize: I didn’t update Colorado’s monthly stuff for the Antarctic; only the Arctic is up-to-date. But the same holds for the austral corner.
Here is a graph comparing Arctic sea ice extent for the two periods:
Caution: this NOT simply a shift of the 1981-2010 anomaly data by its own mean of the 1991-2020 average; the red plot comes from a time series entirely reconstructed out of Colorado’s absolute data.
Upon a closer look, you will discover tiny differences between the blue and the red anomaly plots.
But apart from the distance between the plots, everything keeps as it is. Both the blue and the red stuff have exactly the same linear estimate with the same SE: -0.549 +- 0.015 Mkm² / decade.
And just like UAH anomalies wrt 1991-2020 are lower than those wrt 1981-2010 because the first UAH mean is higher than the second one, the ice extent anomalies wrt 1991-2020 are higher then those wrt 1981-2010 because the first mean is lower than the second one (11.1 versus 11.7 Mkm²).
Thus, moving to a more recent reference period doesn’t change anything else than tiny bits.
So the poles swap about 10M K2 of sea ice every year and they’re worried about deviations of a few M K2 year to year?
I guess that this refers to sea ice extent? It’s a question of how far north the Southern Ocean has a sea surface temperature cold enough to freeze salt water. And I’d reckon that has a great deal to do with ocean currents.
At the same time, more ice forms on land if there is more snowfall. That is a function of water vapor in the air. There is less water vapor in colder air. In reality then, the most likely scenario for more ice to form on land is when air temperatures and sea surface temperatures are warmer. It is land ice that has an impact on sea level, not floating sea ice.
Rich,
The main driver for the formation of winter sea ice in the Southern Ocean is the strength, persistence and temperature of the katabatic down-slope winds coming north off the Antarctic icecap.
Ok, maybe so. That would argue that temperatures on the ice cap are colder than before, if winter extents are greater now. Katabatic or not, air coming down starting at -65c is still going to be mighty cold at sea level. It also argues for less mass gain on land because colder is drier.
On the other side we see lower summer minimum extents. To what do you attribute that? That’s where I imagine ocean currents bringing in “warm” water would play a role. A weaker circumpolar flow would allow warmer water in closer. But I am speculating.
I repeat though that sea ice extent tells us nothing about the mass balance on land as far as I can tell. And the mass balance on land is the only thing that matters relative to sea level rise.
Nope, more Persistence would do the job.
Yes, so again, we have no information about the mass balance from the sea ice extent. It could even be warmer but with more persistent winds. I do believe that I recall hearing that measurements were colder though.
So that is your argument?
Making sea ice is about temperature difference between the water and the wind. The physical strength of the wind (i.e the atmospheric mass being advected) and the duration of the wind. Three variables. Its complex. Focusing on just one variable is naive.
> More ice of course only forms when the temperature drops.
I don’t see that. The center of Antarctica is a desert. So cold almost no moisture is transported there. At temperatures this cold the correlation does not hold.
Yes, my thought as well. But they’re apparently only discussing sea ice extent.
In my view, that’s not very significant to any important question. It seems that Antarctic sea ice extent is in a period of greater variability, with minimum extents shrinking at the same time that maximum extents are growing. Neither has any effect on sea level unless the lower minimum extent increases iceberg calving.
The relevant question at least for sea level concerns, is whether land-based ice has a positive, negative, or neutral mass balance. Nothing in this article gives us any clues about that.
Don’t those extended ice shelves rely upon gaclaiation that starts deep inland?
Regardless, you are correct, this article fails to advancs sea level understanding.
I don’t know that glaciation is a requirement, just cold enough sea surface temperature which could be enhanced by a cold wind from the south. (Air colder than the water).
I think you’re missing the point Rob and Rich. Whenever I talk to a person who believes the BBC, Gore, climate liar and crackpot claptrap, the first thing they come back at me with is polar ice. One click later, they don’t even bother with the polar bear idiocy which was going to be second on their list. It’s going to be a slow rehabilitation for the ones who can’t admit it, like chris below with his torrent of verbal, or typed, diarrhea.
“almost no moisture is transported there.”
That’s just not true. There are many papers on this, going back to 1969, maybe even further. Here are two:
https://www.tandfonline.com/doi/abs/10.3402/tellusa.v21i3.10088
https://tc.copernicus.org/articles/13/413/2019/
Phil, You quoted Rob there. My only comment was that we don’t know if the recent mass balance is positive or negative from any information given here.
Somewhat counter-intuitively colder temperatures may bias toward a negative effect on the mass balance of ice. As mentioned in your first link, the amount of accumulation implied warmer excursions that had not been observed. In other words, the opposite case positing colder excursions would imply less accumulation. The obvious fact being that -65c air is pretty much bone dry.
So if larger ice extent really is due to colder winds coming off the continent, that probably means less precipitation, less accumulation, and maybe a negative mass balance.
You have to still ask why, if Antarctica is the pure test case of CO2 GHE (no appreciable competition from water vapor), why would Antarctica be getting colder even as CO2 continues its relentless rise?
Chris and like-minded victims of the propaganda-indoctrination industrial complex will not appreciate any of these nuances.
“Somewhat counter-intuitively colder temperatures may bias toward a negative effect on the mass balance of ice”
–
Whenever anyone mentions counter intuitive it needs a lot of reasoning, not just a supposition because it usually is wrong.
3 kilometer high masses of ice over North America in the ice ages show definitely that colder temperatures lead to a positive effect on ice mass balance.
This is akin to the argument that warming atmospheres create more snow.
Also counterintuitive and again wrong. The argument is more warming more water in atmosphere more snow. The fact that it does not snow at sea level in the tropics shows again why the argument is factually wrong.
Short term events are not long term effects.
My only comment has been that we can’t tell from the sea ice extent what the mass balance is on land. We don’t know how much snow is falling or how fast the ice is flowing into the sea.
Yeah, sorry, I’m glad I didn’t get on the guy ^^ up there’s case with the bad eyesight responding to the wrong comment.
You’re a warm weather guy, I’ll guess. In New England we know that there are times when it’s “too cold to snow”.
The heaviest, most damaging snowfalls we get often happen when air temperatures near the ground are slightly above freezing.
It’s a balance between a moist air mass and sufficient cold to stay frozen.
There’s definitely an optimum temperature for snowfall. If you read the first link that Phil sent, you’ll see that.
I’m not saying one way or the other what the mass balance is in Antarctica. I’m saying that we need to limit our claims based solely on maximum ice extent. We just don’t know anything about the situation on land based on ice extent.
In New England we know that there are times when it’s “too cold to snow”. The heaviest, most damaging snowfalls we get often happen when air temperatures near the ground are slightly above freezing.
It’s a balance between a moist air mass and sufficient cold to stay frozen.
There’s definitely an optimum temperature for snowfall.
All very true but just an apology for saying that warmer weather causes more snow which is just plain wrong.
While an optimum temperature exists and moves North or South with temp change the fact is that without having cold enough air you will never get snow. Hence the cooler it gets the more likely you are to get snow forming.
Once you reach that optimum there will be a decline from the maximum amount of snow but it still snows.
Because it is cold enough ..
Antarctica is a big bowl. If the land ice melts it will flow into the canyons.
Well sort of, but if it is, it’s an inverted bowl. You’re thinking of Greenland, right?
who cares about Antarctica when the US West is in “severe” drought, Greenland is melting like never before, etc.??
oh, more/less ice in Antarctica!
BFD. Deniers need to focus on Global temperatures, etc. to make their case. Stop cheery picking! Its become too obvious to all other than total
believersdeniers!The US West at this moment in time hardly tells us anything about where Global conditions are heading.
“Greenland is melting like never before” might mean something if true, but you are several years behind. Greenland is now gaining snow and ice, and the glaciers are growing.
However, chris is utterly convinced that we are the ones “cheery (sic) picking”.
All you’re doing is displaying your ignorance, child. When you use “denier” to describe a skeptic, you already show yourself to be an ignoramus. (I notice you criticized someone on this forum for the use of ad hominem so that makes you a hypocrite).
You’re confusing weather and climate, so you shouldn’t even be discussing the subject. Global temperatures have been rising, at the same rate, since the end of the Little Ice Age. There is no evidence of human causation … so you need to learn some science too.
What does “cheery picking” mean?
> What does “cheery picking” mean?
Any good news is plucked and discarded before processing.
I knew I’d find the answer to that here when google let me down.
Done with a smile!
Migrant farm workers who whistle while they work
We seem to have many of those around here … or maybe it’s migratory birds.
Come back when it occurs to you that this is about connecting it with CO2 increases., which is something you seem incapable of doing. Don’t feel too bad though, no has ever made the connection, except in their own heads.
chris, I give you the benefit of the doubt which you probably don’t deserve, but if you sincerely want to understand drought in California, you need to read up on ENSO. It has nothing to do with CO2.
Right on cue too, I just got my report from the East Bay Municipal Utility District telling me that this was the driest year since 1977. I came to live here in 1980 and it was seriously worse than this. I think carbon dioxide’s thrown in the towel (pun intended)
But look at me though:
Way to go, WaterSaver!
You ranked in the top 20%.
Why did the climate warm from the Little Ice Age and all the many cooling priods of the last 10000 years? We know it was definitely NOT CO2 ….so What Done It? No cheery pickin’ allowed.
What we have here is a failure to communicate.
Chris has been indoctrinated to deny climate change. He/she (remember those SNL skits about Chris and Pat back when SNL was funny?) no doubt would refer to the Hockey Stick graph if s/he even is aware of the controversy about warm and cold periods.
Anyone subjected to the propaganda would probably be completely unaware of any warm periods and, if anything, will be vaguely aware of the Little Ice Age as supposedly being the result of volcanoes.
We have no common ground for discussion. Sad really.
Your source for that claim? What happened during the Holocene Climatic Optimum?
chris
August 29, 2021 12:46 pm
who cares about Antarctica when Greenland is melting like never before.
Chris this year, yes a whole year, Greenland will be in positive ice balance.
The scientists will spin it to claim bottom melt, glaciers and icebergs are not measured properly,but the measurements take all this into account
The US is in severe drought?
Really, you know this for a fact?
Yes, some places are in drought, other places aren’t. Just as every other year. The US is a big place.
The ie that Greenland is melting like “never before” has been refuted before and apparently will have to be refuted again. The actual data does not show that. There were a couple of days during the past year when melting accelerated, but for the year as a whole, ice accumulated.
The only thing that is obvious is that you warmistas are willing to tell any lie in order to defend your religion.
He must have changed the meaning of the word “drought”. Driving through 12 inches of water on the surface streets and looking at a current flowing in the interstate “ditch”, I would say there is no drought where I live.
This behaviour of Antartica shows one key mechansim that the planet represents and is responsible for most of the recent ocean and planet warming.
Change in solar energy wavelengths/magnetic field ——> reduced albedo (low level clouds) gives increased solar energy penetrating the ocean surface causing warming. This change is easily enough to represent the warming of recent decades with the percentage albedo decrease.
This has been warming the planet and Antarctica is one of the main places that observe/confirm this mechanism. Thanks to the ocean circumpolar current that this increasing energy fails to reach the continent because it relies on water movement a bit like central heating to bring the energy to it.
The Arctic warms with this mechanism because this solar energy eventually reaches the heart of the Arctic ocean via the ocean currents (NAD, AMOC) that are absent on the opposite side of the world.
Increased CO2 in the atmsophere fails to show warming where energy from the ocean fails to reach it. World regions that show warming are also because of increased brigthening and annual sunshine hours.
There are other contributions like data manipulation, change in envirnoment and the minor role that CO2 plays that is difficult to observe if it has a presence or not. Greening of the planet one of the only representives of its presence.
Natural La Nina(s) and global cooling!
More to come into early next year!
https://www.cpc.ncep.noaa.gov/products/analysis_monitoring/lanina/enso_evolution-status-fcsts-web.pdf
Tony Heller’s video about Arctic sea ice extent shows how the IPCC no longer shows sea ice extent before 1979, even though satellite data was available throughout the 1970’s and other measures were used prior to the satellite era. 1979 was significant because it was one of the coldest years on record and Arctic sea ice was close to a historic maximum
1979 – The Beginning Of Time | Real Climate Science
Beginning 1972
https://seaice.uni-bremen.de/data/amsr2/today/extent_n_19720101-20191231_amsr2.txt
https://seaice.uni-bremen.de/data/amsr2/today/extent_n_2020_amsr2_smooth.txt
https://seaice.uni-bremen.de/data/amsr2/today/extent_n_2021_amsr2_smooth.txt
1977 was the highest extend
Lies, damned lies and government reports.
If the glaciers were flowing faster, you might expect Antarctic sea ice to increase ?
It’s seasonal ice that expands around the entire continent in the winter and mostly disappears in the summer. Glaciers don’t move that fast.
Thanks for the post Charles I think.
Quite often in the last 12 years a little out break of hope has been uniformly squelched.
I will keep my powder dry until we have a longer, incontrovertible breakout.
All your facts are good just not long enough . ENSO SO index is moving the wrong way.
You might like this or get Willard to explain blankets and warming again
Blankets stop Alpine glaciers from melting
Mount Titlis — In one of Switzerland’s most popular Alpine destinations, resort staff have been working over the summer months to limit the impact of warming global temperatures on its glacial slopes — by blanketing the ice to block the sun.
The 3,238-metre Mount Titlis has seen large swathes of ice disappear from its glacier over recent decades. Within the next half century, all of it is expected to melt.
“We lay the fleece over the glacier like a natural protective shield,” Gian Darms, who manages snow conditions and piste security for cable car operator Titlis Bergbahnen, told Reuters.
Declining snow cover as a result of climate change poses an existential threat to ski resorts throughout Europe. A glacier can provide some protection, preserving piles of snow year-round that can even be deployed on barer ski pistes elsewhere on the
Signs of Antarctic and Southern Hemisphere oceanic cooling are proliferating:
https://ptolemy2.wordpress.com/2021/05/13/southern-hemisphere-sea-ice-now-extends-80-km-farther-north-than-prior-estimates/
https://ptolemy2.wordpress.com/2020/09/12/widespread-signals-of-southern-hemisphere-ocean-cooling-as-well-as-the-amoc/
That is going to be a real climate crisis.
This fits quite well with the changes in ToA insolation due to orbital changes since 1980.
Since 1980, the March insolation over 55S is up 0.4W/sq.m but October is down by 0.5W/sq.m. So slightly less sunlight over a year but more in autumn increasing the melt and less in spring increasing the formation of sea ice.
The slight increase in sea ice area is an energy regulating process that reduces ocean heat loss when it has reduced exposure to sunlight.
As multiple actually science based papers etc have shown, this is NOT because it is getting colder, nor does it invalidate global warming: it is a change in currents…
Really, Watts is clutching at straws lately.
We already postponed the next ice age by a millenium.
Yes it’s a tragedy that humanity has been denied the joys of glacial inception.
That CO2 has a lot to answer for.
So after we decarbonize, glacial inception will resume and that’s a good thing?
If you’re Canadian, Inuit, Finn or Siberian, or are particularly into ice skating and cold weather skiing, what’s the problem ?? Glacier skiing in July – bring it on.
“multiple actually science based papers etc have shown,”
References please, or did you just cut and paste that?
“We already postponed the next ice age by a millenium.”
So oil company executives should be getting the Nobel Peace Prize by the droves? Is that what you’re saying? Or are you too stupid to actually know what you’re saying? A simple yes or no answer will be accepted, I’m sure.
Griff
this is NOT because it is getting colder, nor does it invalidate global warming: it is a change in currents…
Cause-effect inversion as always.
Change in currents is what causes climate change.
Not CO2.
The oceanic isolation of Antarctica along with joining of the Americas to make the Atlantic a wider and meridionally bounded ocean, adding in Himalayan uplift – these are what have caused the profound cooling after the dinosaur demise at the K-T boundary 66 Mya.
Any place where it’s warming, ocean currents are irrelevant. It’s CO2 because the models have proven it.
Any place where it’s cooling, it’s just weather, or it’s just ocean currents. Any excuse in a storm.
Is this increased range in ice are reflected in the temperature data?
If not is it due more ice coming off the land in winter, ie glacier flow, caused by increased snowfall?
I’ll ‘splain it again for all the college educated that have such a hard time understanding climate and weather. Ice increases during winter and decreases during summer, even in the Antarctic and Arctic. If you really can’t figure this out you need to sue to get back all that money your parents wasted sending you to that overblown daycare you pissed away so many years at.