Guest “Ya think?” by David Middleton
U.N. climate panel confronts implausibly hot forecasts of future warming
By Paul Voosen Jul. 27, 2021Next month, after a yearlong delay because of the pandemic, the U.N. Intergovernmental Panel on Climate Change (IPCC) will begin to release its first major assessment of human-caused global warming since 2013. The report, the first part of which will appear on 9 August, will drop on a world that has starkly changed in 8 years, warming by more than 0.3°C to nearly 1.3°C above preindustrial levels. Weather has grown more severe, seas are measurably higher, and mountain glaciers and polar ice have shrunk sharply. And after years of limited action, many countries, pushed by a concerned public and corporations, seem willing to curb their carbon emissions.
But as climate scientists face this alarming reality, the climate models that help them project the future have grown a little too alarmist. Many of the world’s leading models are now projecting warming rates that most scientists, including the modelmakers themselves, believe are implausibly fast. In advance of the U.N. report, scientists have scrambled to understand what went wrong and how to turn the models, which in other respects are more powerful and trustworthy than their predecessors, into useful guidance for policymakers. “It’s become clear over the last year or so that we can’t avoid this,” says Gavin Schmidt, director of NASA’s Goddard Institute for Space Studies.
[…]
Science! (as in, “she blinded me with”)
These have to be the funniest, most internally self-contradicted two sentences ever written in the English language:
Many of the world’s leading models are now projecting warming rates that most scientists, including the modelmakers themselves, believe are implausibly fast. In advance of the U.N. report, scientists have scrambled to understand what went wrong and how to turn the models, which in other respects are more powerful and trustworthy than their predecessors, into useful guidance for policymakers. “It’s become clear over the last year or so that we can’t avoid this,” says Gavin Schmidt, director of NASA’s Goddard Institute for Space Studies.
Science! (as in, “she blinded me with”)
Apart from being wronger than past models, the new models “are more powerful and trustworthy than their predecessors” and the modelers “can’t avoid this.”
“Warming by more than 0.3°C to nearly 1.3°C above preindustrial levels”

Wood For Trees
Considering that the “preindustrial levels” were during the Little Ice Age, the coldest climatic episode of the Holocene Epoch, 1.3 °C of warming should be welcomed. It certainly beats the Hell out of this:
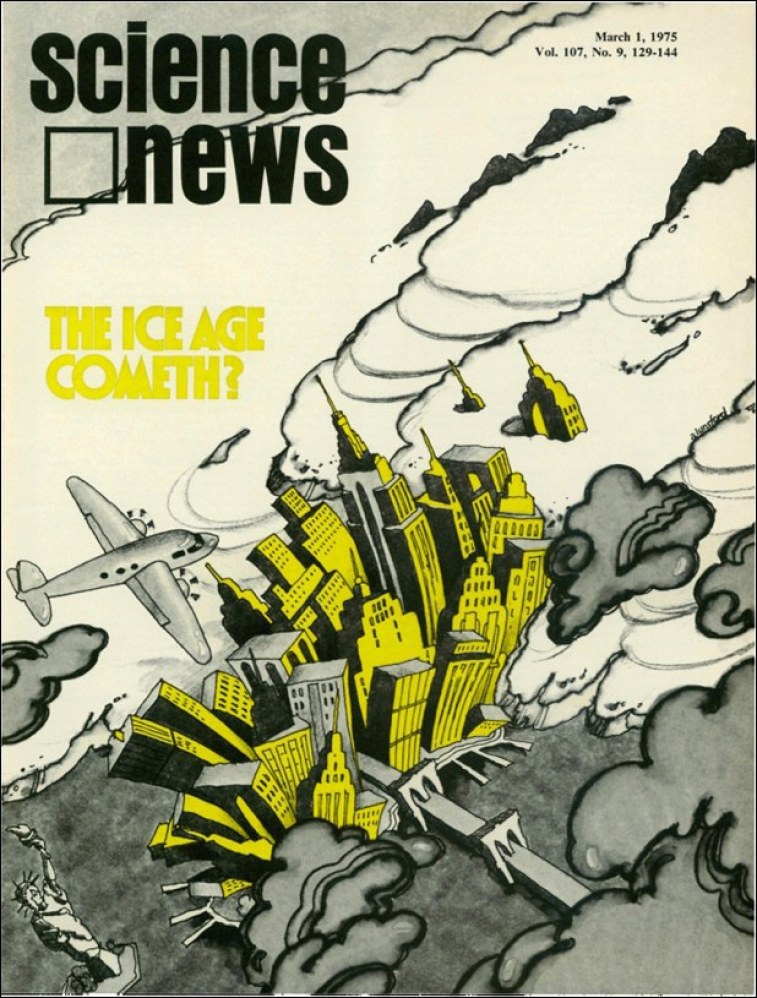
Particularly since all of the warming prior to “The Ice Age Cometh” can be explained by the natural forcing mechanisms the climate modelers are aware of.

The modelers can only account for the warming warming since 1975 by blaming fossil fuels. That said, the modelers only incorporate known, reasonably well-understood, forcing mechanisms. Judith Curry illustrated this concept quite well…

“Weather has grown more severe, seas are measurably higher, and mountain glaciers and polar ice have shrunk sharply.”
Since 2013?
“Weather has grown more severe”?

Global Tropical Cyclone Activity Dr. Ryan N. Maue

Global Tropical Cyclone ActivityDr. Ryan N. Maue
“Seas are measurably higher”
Than 2013?
Yes… It can be measured.

Sea level has risen $0.25 since 2013.
We can also measure the standard deviation of those measurements.

Sea level has risen $0.25 +/- $1.00. The rate (GIA applied) is about 3.4 mm/yr. The standard deviation of the monthly GMSL altitude measurement is about 88 mm. The sea surface constantly moves up and down, they make ~40,000 measurements each month, hence the large standard deviation.
“Mountain glaciers and polar ice have shrunk sharply.”
I don’t have a handy measurement for global changes in mountain glaciers. However, it is better for them to retreat rather than advance.
THE LITTLE ICE AGE
By Alan Cutler August 13, 1997
The year was 1645, and the glaciers in the Alps were on the move. In Chamonix at the foot of Mont Blanc, people watched in fear as the Mer de Glace (Sea of Ice) glacier advanced. In earlier years, they had seen the slowly flowing ice engulf farms and crush entire villages.They turned to the Bishop of Geneva for help, and he made the journey to Chamonix. At the ice front he performed a rite of exorcism.
Little by little, the glacier receded.
But before long the threatening ice returned, and once again the bishop was summoned. The struggle against the glacier continued for decades.
Similar dramas unfolded throughout the Alps and Scandinavia during the late 1600s and early 1700s, as many glaciers grew farther down mountain slopes and valleys than they had in thousands of years. Sea ice choked much of the North Atlantic, causing havoc with fisheries in Iceland and Scandinavia. Eskimos paddled their kayaks as far south as Scotland. At the same time in China, severe winters in Jiang-Xi province killed the last of the orange groves that had thrived there for centuries.
[…]
The Washington Post… Back when it was a rea newspaper.
But we do have pretty good measurements of recent polar ice changes.


It gets even better!
In the past, most models projected a “climate sensitivity”—the warming expected when atmospheric carbon dioxide (CO2) is doubled over preindustrial times—of between 2°C and 4.5°C. Last year, a landmark paper that largely eschewed models and instead used documented factors including ongoing warming trends calculated a likely climate sensitivity of between 2.6°C and 3.9°C. But many of the new models from leading centers showed warming of more than 5°C—uncomfortably outside these bounds.
The models were also out of step with records of past climate. For example, scientists used the new model from NCAR to simulate the coldest point of the most recent ice age, 20,000 years ago. Extensive paleoclimate records suggest Earth cooled nearly 6°C compared with preindustrial times, but the model, fed with low ice age CO2 levels, had temperatures plummeting by nearly twice that much, suggesting it was far too sensitive to the ups and downs of CO2. “That is clearly outside the range of what the geological data indicate,” says Jessica Tierney, a paleoclimatologist at the University of Arizona and a co-author of the work, which appeared in Geophysical Research Letters. “It’s totally out there.”
Science! (as in, “she blinded me with”)
It’s unclear as to whether or not Mr. Voosen is discussing equilibrium climate sensitivity (ECS) or transient climate response (TCR). It’s an important distinction.
Transient and Equilibrium Climate Sensitivity
Projections of the severity of anthropogenic climate change are strongly dependent on our estimates of climate sensitivity, traditionally defined as the global average warming at the Earth’s surface due to a doubling of the carbon dioxide from pre-industrial levels. This importance arises not because global temperature change directly causes all of the impacts of major concern, but because many effects of climate change are predicted to increase in severity with larger global warming.
An important distinction is made between the equilibrium sensitivity — the temperature change realized after allowing the climate system to equilibrate with a higher value of CO2 — and the response on shorter time scales, before the deep oceans have had time to equilibrate, that is of more direct relevance to the changes we are likely to see in the 21st century. The latter is often quantified by raising the carbon dioxide in a model at the rate of 1% per year and examining the response at the time when carbon dioxide concentration has doubled, referred to as the transient climate sensitivity or response. (At a rate of 1% per year, doubling requires 70 years.)
Equilibrium sensitivities in global climate models typically range from 2 to 5K, while the transient climate responses are smaller, in range of 1.0-2.5 K, due to the cooling influence of ocean heat uptake.
[…]
The ratio of transient to equilibrium sensitivity varies from 1/3 to 1/2 in this group of GFDL models indicating significant variation of the transient cooling influence of the ocean. The relationship of the ocean’s cooling influence to ocean heat uptake and circulation changes has been an ongoing thread of GFDL research. For example, He et al (2017) noted that stronger deep ocean circulation prior to forcing reduced the magnitude of transient warming in a GFDL model.
Cloud feedbacks are widely considered to contribute the largest uncertainty to climate sensitivity. Simulated climate sensitivity varies considerably with choices made about cloud parameterizations that are not well constrained by observations (Zhao et al 2016). Simulated cloud responses depend on the pattern of surface temperature change, not just its global magnitude (Silvers et al 2018). Because of the importance and complexity of the interactions of clouds and climate GFDL is focusing effort on a cloud climate initiative.
[…]
GFDL
Here’s a graphical illustration from IPCC TAR, 2001:

TCR occurs simultaneously with the rise in atmospheric CO2. While, the difference between ECS and TCR occurs over the next several hundred years and would likely be indistinguishable from background noise.
I am not claiming that this is correct or empirically verifiable. I’m just explaining the concept. These are the sensitivities of the GFDL climate models:
| Model | Transient Climate Response | Equilibrium Climate Sensitivity |
|---|---|---|
| CM2.1 | 1.5 K (Randall et al 2007) | 3.4 K (Stouffer et al 2006) |
| ESM2M | 1.3 K (Flato et al 2013) | 3.3 K (Paynter et al 2018) |
| ESM2G | 1.1 K (Flato et al 2013) | 3.3 K (Krasting et al 2018) |
| CM3 | 2.0 K (Flato et al 2013) | 4.8 K (Paynter et al 2018) |
| CM4 | 2.1 K (Winton et al submitted) | 5.0 K (Winton et al submitted) |
| ESM4 | 1.6 K (Dunne et al in prep) | 3.2 K (Dunne et al in prep) |
In the ESM4 model, the average temperature would rise 1.6 °C over a period of about 70 years as atmospheric CO2 and then another 1.6 °C over the subsequent 430 years. This doesn’t strike me as particularly catastrophic, considering that the first 1.0 °C or so has already occurred.
This graph is a favorite of mine:

Our buddy Zeke Hausfather was kind enough to “debunk” it on the Carbon Brief blog:

He also kindly provided a link to the Excel file for his graph. I downloaded the file and plotted only the instrumental estimates of ECS (I “eschewed models and instead used documented factors”).
| ECS study | year | min | max | ECS mean |
| Harvey and Kaufmann 2002 | 2002 | 1.0 | 3.0 | 2.0 |
| Gregory et al. 2002 | 2002 | 1.6 | 10.0 | 2.1 |
| Kaufmann and Stern 2002 | 2002 | 2.0 | 2.8 | 2.6 |
| Knutti et al. 2002 | 2002 | 2.0 | 9.2 | 4.8 |
| Frame et al. 2005 | 2005 | 1.2 | 5.2 | 2.3 |
| Tsushima et al. 2005 | 2005 | 3.1 | 4.7 | 3.8 |
| Forster and Gregory 2006 | 2006 | 1.0 | 4.1 | 1.6 |
| Forest et al. 2006 | 2006 | 2.1 | 8.9 | 4.1 |
| Stern et al. 2006 | 2006 | 4.4 | 4.5 | 4.4 |
| Chylek et al. 2007 | 2007 | 1.1 | 1.8 | 1.6 |
| Schwartz 2007 | 2007 | 0.9 | 2.9 | 1.9 |
| Lindzen and Choi 2009 | 2009 | 0.4 | 0.5 | 0.5 |
| Murphy et al. 2009 | 2009 | 0.9 | 10.0 | 3.0 |
| Lin et al. 2010 | 2010 | 2.8 | 3.7 | 3.1 |
| Lindzen and Choi 2011 | 2011 | 0.5 | 1.1 | 0.7 |
| Aldrin et al. 2012 | 2012 | 1.2 | 3.5 | 2.0 |
| Schwartz 2012 | 2012 | 1.5 | 6.0 | 3.0 |
| Lewis 2013 | 2013 | 1.0 | 3.0 | 1.6 |
| Otto et al. 2013 | 2013 | 0.9 | 5.0 | 1.9 |
| Bengtsson and Schwartz 2013 | 2013 | 1.5 | 2.5 | 2.0 |
| Otto et al. 2013 | 2013 | 1.2 | 3.9 | 2.0 |
| Skeie et al. 2014 | 2014 | 0.9 | 3.2 | 1.8 |
| Loehle 2014 | 2014 | 1.8 | 2.3 | 2.0 |
| Lewis 2014 | 2014 | 1.2 | 4.5 | 2.2 |
| Kummer and Dessler 2014 | 2014 | 1.6 | 4.1 | 2.3 |
| Lovejoy 2014 | 2014 | 2.5 | 3.7 | 3.1 |
| Donohoe et al. 2014 | 2014 | 3.1 | 3.2 | 3.1 |
| Urban et al. 2014 | 2014 | 2.1 | 4.6 | 3.1 |
| Monckton et al. 2015 | 2015 | 0.8 | 1.3 | 1.0 |
| Loehle 2015 | 2015 | 1.5 | 1.6 | 1.5 |
| Lewis and Curry 2015 | 2015 | 1.1 | 4.1 | 1.6 |
| Cawley et al. 2015 | 2015 | 1.8 | 4.4 | 2.0 |
| Johansson et al. 2015 | 2015 | 2.0 | 3.2 | 2.5 |
| Johansson et al. 2015 | 2015 | 1.6 | 7.8 | 3.1 |
| Bates 2016 | 2016 | 1.0 | 1.1 | 1.0 |
| Lewis 2016 | 2016 | 0.7 | 3.2 | 1.7 |
| Loeb et al. 2016 | 2016 | 0.8 | 10.0 | 2.0 |
| Forster 2016 | 2016 | 1.1 | 5.3 | 3.0 |
| Armour 2017 | 2017 | 1.7 | 7.1 | 2.9 |
| Lewis and Curry 2018 | 2018 | 1.2 | 3.1 | 1.8 |
| Average | 2.3 | |||
| σ | 0.9 | |||
| -2σ | 0.4 | |||
| +2σ | 4.2 |
The average ECS was 2.3 °C. This would translate to a TCR of 1.2-1.6 °C.

Multiple estimates published in the same year is why several years appear multiple times.
Scatter plots of the other methods demonstrate that the problem is models, “all the way down”…

Paleo methods produce a higher sensitivity because, almost invariably, the CO2 proxies are of much lower resolution than the temperature proxies. This is particularly true of ice core data.
What’s the solution to the hot model problem?
The climate scientists say, “Put more PhD’s on the payroll!”
A cadre of researchers dedicated to the task of translating the models into useful projections could also help, says Angeline Pendergrass, a climate scientist at Cornell University who helped develop one technique for weighting the model results by their accuracy and independence. “It’s an actual job to go between the basic science and the tools I’m messing around with,” she says.
Science! (as in, “she blinded me with”)
At least Gavin Schmidt sees that there might be a problem…
Already scientific papers are appearing using CMIP’s unconstrained worst-case scenarios for 2100, adding fire to what are already well-justified fears. But that practice needs to change, Schmidt says. “You end up with numbers for even the near-term that are insanely scary—and wrong.”
Science! (as in, “she blinded me with”)
However, with the prospects of even more “insanely scary—and wrong” climate “science” papers on the horizon and the even more insanely scary and wronger media reporting of these papers, the second half of 2021 will be a target rich environment…
Closing Notes
- Some of this post was directly copied from a previous post of mine: Climate Sensitivity Estimates: Declining or Not? Is it possible to plagiarize yourself?
- Yes. I realize that the instrumental climate sensitivity estimates rely on models. All measurements rely on models.
References
Terando, A., Reidmiller, D., Hostetler, S.W., Littell, J.S., Beard, T.D., Jr., Weiskopf, S.R., Belnap, J., and Plumlee, G.S., 2020, Using information from global climate models to inform policymaking—The role of the U.S. Geological Survey: U.S. Geological Survey Open-File Report 2020–1058, 25 p.,
https://doi.org/10.3133/ofr20201058.
Sea level has risen $0.25 since 2013. – article
Okay, so when is Africa’s Sahara going to “green up” again? Just askin’ because if it goes green and Death Valley fills in and the lake in the Black Rock area gets all wet and full, that means that the Great Lakes might reconnect into a single water body and — well, gee whiz, guys, all that housing is at stake there, too.
Great article! Thank you, David, for a well-referenced, devastating hammer-down of some of the major memes fronted by AGW/CAGW alarmists, which obviously includes the IPCC.
I’ll just note the following related to the second graph in the above article, the Wood for Trees plot of temperature anomaly versus calendar year since 2013:
— since 2013, stated l.s. regression slope = +0.015 °C/yr
— since 2014, eyeballed slope = zero °C/yr
— since 2016, eyeballed slope = – 0.09 °C/yr
— since 2018, eyeballed slope = +0.08 °C/yr
— since 2020, eyeballed slope = – 0.21 °C/yr
I realize the graph was constructed for the specific purpose of rebuking the Paul Voosen claim of “. . . in 8 years, warming by more than 0.3°C . . .”, which it certainly does, but one really needs to be careful in extracting any trends claimed to be meaningful from data having a relative high signal-to-noise ratio, such as that presented in this graph.
I would need to be careful if it was a criticism of a coherent claim.
The r2 is around…
http://www.climate4you.com/images/MSU%20UAH%20GlobalMonthlyTempSince1979%20AndCO2.gif
+42×1042
Ooops, my bad . . . in the last sentence of my comment above, I stated “. . . having a relative high signal-to-noise ratio . . .” whereas I actually meant to say “. . . having a relative low signal-to-noise ratio . . .”
The fossilized Chuck Schumer, leader of the US Senate, claims:
Chuck Schumer Says Climate Crisis Will Be Worse Than COVID Unless Dems Pass Infrastructure Bill
Note another fossil in close proximity is Nutter Nanc Pelosi of Kookifornia, #2 in line for POTUS.
Just about all the higher prices we are seeing now comes from Democrat over-spending.
We may be able to hold them to just the porkbarrel Infrastructure bill, which is over a Trillion dollars. There is a chance that one or more Democrats will vote against the $3.5 Trillion Green New Deal bill, so it may not pass the U.S. Senate.
But Nancy Pelosi says if the $3.5 Trillion (really $5.5 Trillion) Green New Deal doesn’t pass, then she is not going to allow a vote on the Infrastructure bill.
So maybe we won’t get either bill.
And I see where the Democrats have increased the money for the Civilian Climate Corps from $10 billion to $100 billion! Now just think what a bunch of political activists could do with $100 billion dollars and 1.5 million Civilian Climate Corp workers. Why, they could beseige every Republican/conservative in the country.
We definitely don’t want a Civilian Climate Corp controlled by radical Democrats and funded sufficiently to make life miserable for their political opposition. And that’s just what the Democrats would do with these 1.5 million Brownshirts, if given the chance.
In my comments of late, I simply state that all climate scientists know that things changed drastically for them in the first decade of the new millennium. The “Dreaded Pause^тм” was a wrecking ball relieved temporarily by the 2015 el Niño.
The last six years of cooling has the consensus deeply worried. Reconnection with the pre el Niño “Pause” is a looming horror for the faithful, an extended 30yr so-called pause that would result, following only 18yrs of false alarm warming in 1980s-90s.
The massive waste in research and education – two generations of graduate PhDs that have useless skills, miseducated K-12-BS/BA- MSc, the trillions wasted has destroyed economies, even half dismantled our civilization, 100s of millions of mentally traumatized children and adults, all universities, institutions, governments at all levels burdened with global warming infrastructure, employees….
And the de*th count from impoverishment over two generations caused by these wasted resources is colossal. Climate scientists and governments perhaps honestly believed there was a crisis looming in the 1980s and 90s, but they knew they were wrong over the last 20yrs and they cooked the data to keep the show alive. They changed from scientists to dishonest activists in the new millennium. All this is on their conscience.
Conscience? I suspect many lack one.
“Never appeal to a man’s conscience. He might not have one.”
-Robert A. Heinlein
The Notebooks of Lazarus Long
Time Enough For Love
That’s why it always irks me when I see conservatives appealing to the Leftwing Media to report the facts. They don’t seem to understand that the Leftwing Media is not interested in reporting the facts. All they are interested in is advancing the cause of the radical Left. You are wasting your time trying to reform/shame Leftwing journalists.
In fact, Tom, you can actually see them blatantly REJECT facts, directly (Cuomo is especially adept at this) when those facts go against their narrative.
They have no conscience because they believed their actions whether correctly diagnosed or not were in aid of their ‘greater good’ of a destruction of capitalism and the appointment of a global socialist elite.
Intellectually corrupt authoritarians always resort to the ends justifying the means.
Not at all. They saw it coming and have an answer. In January 2018 James Hansen & Gavin Schmidt wrote the following:
A second 15-year pause will pose less of a problem than the first one. They already have the answer: “It will end just as the first one ended.”
Yes, the alarmists covered all the rhetorical bases.
Still, they are going to have to answer if the temperatures continue to cool while CO2 continues to increase. In that case, CO2 would not be doing what they claim it is doing, which is raising the Earth’s temperature.
No doubt they will have plenty of excuses, but none of them will hold up any better than the excuses they have been making all along.
Arctic sea ice has declined slightly since 2013. But that’s cherry pick because it neatly avoids noticing that sea ice volume increased by 65% in the single year 2012-2013.
Last year was marginally higher than 2012, basically ZERO trend in a decade. That is totally INCONSISTENT with the never ending claims or run away melting, tipping points etc.
“That is totally INCONSISTENT with the never ending claims or run away melting, tipping points etc.”
That’s not what the IPCC project, and so any “never ending claims” do not come from the science … just from idiots mouthing off to ever credulous media in search of sensation …..

From the above article’s quoted text from Paul Voosen:
“In advance of the U.N. report, scientists have scrambled to understand what went wrong and how to turn the models, which in other respects are more powerful and trustworthy than their predecessors, into useful guidance for policymakers. ‘It’s become clear over the last year or so that we can’t avoid this,’ says Gavin Schmidt, director of NASA’s Goddard Institute for Space Studies.” (my underling emphasis added)
Well, I’m pretty certain the graph above the top of the above article is a cutout of the graph posted by Dr. Roy Spencer way back in 2013 (original available at: http://www.drroyspencer.com/2013/06/still-epic-fail-73-climate-models-vs-measurements-running-5-year-means/ ). Being so, the graphed data actually begins on the left side at around year 1977 (it’s unfortunate that the x-axis was not included in the image above).
Consulting Dr. Spencer’s original graph, one sees that the divergence between model predictions and balloon & satellite data was quite evident by 1983-1984. By 2005, this difference had grown to a whopping 0.5 C. And the divergence has continued to increase since then.
Yet despite this well-publicized graph from 2013, Gavin Schmidt, being the poser that he his, has the chutzpah to recently state “It’s become clear over the last year or so that we can’t avoid this [difference -GD].“
Why Schmidt is still Director of GISS is beyond understanding.
I think the Schmidt quote would more accurately described as ‘we can’t avoid acknowledging what we have known for decades, our previous lies have become manifest.’
The problem is the CMIP6 models are even worse than the previous incarnations. Rather than correcting the worst models they made them even more exaggerated.
All the talk about 1.3C warming being bad – but I have yet to hear anyone state what the RIGHT temperature is. Is the RIGHT temperature LIA levels? MWP? Holocene Optimum? Last Glacial Maximum?
Another, possibly more accurate way of putting that might be,
“Help! We don’t know what we’re doing!”
Also, if a model was ever supposed to produce true results, it should be able to be run further than the next 100 odd years. Try running the model for another 100 years, another 1000 years, etc. I am pretty sure that the model biases will predict that we are all doomed in any scenario.
In a nutshell: all the models have been wrong (over-shot the mark).
Yes, 1970’s “the coming cold” until that dog wouldn’t hunt no more… thus, flip the script to runaway warming.
This is all Club of Rome ‘doomerism’.
This is actually not correct David:
Nobody has been able to explain the Early 20th Century Warming. They can only explain about half of it. It is a failure for them and you shouldn’t help them get off it easy.
http://www.euanmearns.com/wp-content/uploads/2015/02/hadcrut4.png
All they are doing is polishing a turd. That’s right, get it nice and shiny for Glasgow. They only pretend to care about science.
“Sea level has risen $0.25 since 2013”
“Sea level has risen $0.25 +/- $1.00”
I can’t believe Anthony let’s this clown post.
Mostly to encourage total fracking retards to make totally fracking retarded comments like yours…
So every weather event is attributable to climate change .
And climate change is caused by human CO2 emissions according to politically paid for ‘scientific investigations ‘ .
Mis-spent money buys a lot of votes and likes until people realise who’s paying for it .
I’m really not sure why they bother with the models any more. Practically the whole western world has committed to wrecking their energy supplies (and all the rest) come hell or high water, in large part because of the crazy predictions of the models, so they’ve served their purpose. The more they hang around the more we can see just how wrong their predictions really are. How would making them do a decent job help the cause in any way?
The media and govts have worked out that all they need to do to ‘prove’ climate change is to cherry pick some bad weather from around the globe, and there’s always plenty of that. The hard of thinking buy into it hook, line and sinker.
Where would all the money they save go? Maybe into the ‘correction’ of historical temperature and sea level records. Maybe into purging old news articles about bad weather before CO2 started causing it. Maybe into expanding the ideas that warming causes cooling, higher farming production outputs leads to less profits, that sort of thing. This sort of effort would be money well spent because then they can show us actual evidence of how much the climate has changed, and how bad things really are.
/s
What they’re missing is that CO2 can do both catastrophic warming, and catastrophic cooling. This is going to require far more climate tax than anyone expected.
0.3 C increase in 8 years? On which world?
That is 3.75c per century.
What exactly is that based on, certainly not satellite readings?
In this current phase of inflation is it wise to use a monetary value to record sea level rise? By my calculations $0.25 will be up to $1.45 by the end of the year. 😉
David, as a long time reader of WUWT, I always enjoy what I learn from your articles and specially your sense of humor.
😎🍻
Here in calgary we are enjoying a warm dry summer, first in a long time.
Is that climate change?
If it continues, maybe.
But all I’m seeing is a return to hot dry summers in the 90s and early aughts
Before it got cold and wet
Seems to be a pattern or cycle at work here.
Hmmm
Whatever happened to the idea that if the observations don’t agree with the predictions then the theory is WRONG! End of story!
A more damning failure, one that scuttles the entire fleet:
https://rclutz.com/2021/07/30/co2-changes-follow-temp-changes-not-the-reverse-2021-update/
“Seas are measurably higher”
I often tell people they’ve been of immeasurable help. 😉
We are going to have a lot of fun with AR6 once it is out. I’ve read most of the second order draft and it is hilarious! Did you know that now feedbacks have feedbacks? In AR7 I predict that feedbacks of feedbacks will have feedbacks. 😉
+42×1042