Guest “Ya think?” by David Middleton
U.N. climate panel confronts implausibly hot forecasts of future warming
By Paul Voosen Jul. 27, 2021Next month, after a yearlong delay because of the pandemic, the U.N. Intergovernmental Panel on Climate Change (IPCC) will begin to release its first major assessment of human-caused global warming since 2013. The report, the first part of which will appear on 9 August, will drop on a world that has starkly changed in 8 years, warming by more than 0.3°C to nearly 1.3°C above preindustrial levels. Weather has grown more severe, seas are measurably higher, and mountain glaciers and polar ice have shrunk sharply. And after years of limited action, many countries, pushed by a concerned public and corporations, seem willing to curb their carbon emissions.
But as climate scientists face this alarming reality, the climate models that help them project the future have grown a little too alarmist. Many of the world’s leading models are now projecting warming rates that most scientists, including the modelmakers themselves, believe are implausibly fast. In advance of the U.N. report, scientists have scrambled to understand what went wrong and how to turn the models, which in other respects are more powerful and trustworthy than their predecessors, into useful guidance for policymakers. “It’s become clear over the last year or so that we can’t avoid this,” says Gavin Schmidt, director of NASA’s Goddard Institute for Space Studies.
[…]
Science! (as in, “she blinded me with”)
These have to be the funniest, most internally self-contradicted two sentences ever written in the English language:
Many of the world’s leading models are now projecting warming rates that most scientists, including the modelmakers themselves, believe are implausibly fast. In advance of the U.N. report, scientists have scrambled to understand what went wrong and how to turn the models, which in other respects are more powerful and trustworthy than their predecessors, into useful guidance for policymakers. “It’s become clear over the last year or so that we can’t avoid this,” says Gavin Schmidt, director of NASA’s Goddard Institute for Space Studies.
Science! (as in, “she blinded me with”)
Apart from being wronger than past models, the new models “are more powerful and trustworthy than their predecessors” and the modelers “can’t avoid this.”
“Warming by more than 0.3°C to nearly 1.3°C above preindustrial levels”

Wood For Trees
Considering that the “preindustrial levels” were during the Little Ice Age, the coldest climatic episode of the Holocene Epoch, 1.3 °C of warming should be welcomed. It certainly beats the Hell out of this:
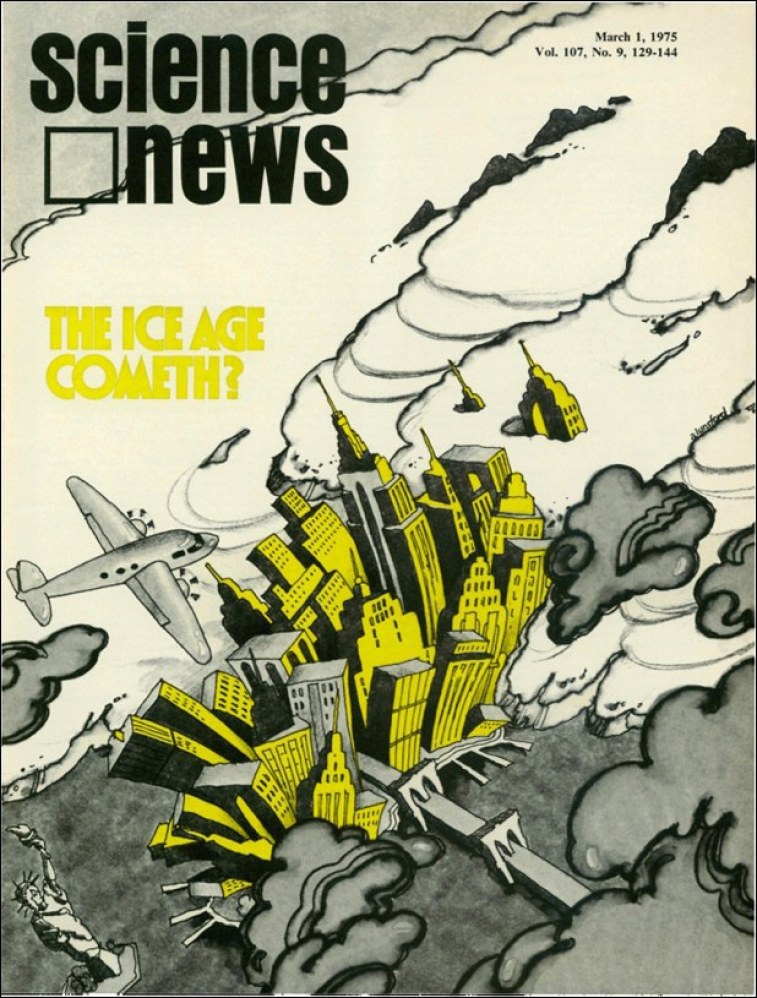
Particularly since all of the warming prior to “The Ice Age Cometh” can be explained by the natural forcing mechanisms the climate modelers are aware of.

The modelers can only account for the warming warming since 1975 by blaming fossil fuels. That said, the modelers only incorporate known, reasonably well-understood, forcing mechanisms. Judith Curry illustrated this concept quite well…

“Weather has grown more severe, seas are measurably higher, and mountain glaciers and polar ice have shrunk sharply.”
Since 2013?
“Weather has grown more severe”?

Global Tropical Cyclone Activity Dr. Ryan N. Maue

Global Tropical Cyclone ActivityDr. Ryan N. Maue
“Seas are measurably higher”
Than 2013?
Yes… It can be measured.

Sea level has risen $0.25 since 2013.
We can also measure the standard deviation of those measurements.

Sea level has risen $0.25 +/- $1.00. The rate (GIA applied) is about 3.4 mm/yr. The standard deviation of the monthly GMSL altitude measurement is about 88 mm. The sea surface constantly moves up and down, they make ~40,000 measurements each month, hence the large standard deviation.
“Mountain glaciers and polar ice have shrunk sharply.”
I don’t have a handy measurement for global changes in mountain glaciers. However, it is better for them to retreat rather than advance.
THE LITTLE ICE AGE
By Alan Cutler August 13, 1997
The year was 1645, and the glaciers in the Alps were on the move. In Chamonix at the foot of Mont Blanc, people watched in fear as the Mer de Glace (Sea of Ice) glacier advanced. In earlier years, they had seen the slowly flowing ice engulf farms and crush entire villages.They turned to the Bishop of Geneva for help, and he made the journey to Chamonix. At the ice front he performed a rite of exorcism.
Little by little, the glacier receded.
But before long the threatening ice returned, and once again the bishop was summoned. The struggle against the glacier continued for decades.
Similar dramas unfolded throughout the Alps and Scandinavia during the late 1600s and early 1700s, as many glaciers grew farther down mountain slopes and valleys than they had in thousands of years. Sea ice choked much of the North Atlantic, causing havoc with fisheries in Iceland and Scandinavia. Eskimos paddled their kayaks as far south as Scotland. At the same time in China, severe winters in Jiang-Xi province killed the last of the orange groves that had thrived there for centuries.
[…]
The Washington Post… Back when it was a rea newspaper.
But we do have pretty good measurements of recent polar ice changes.


It gets even better!
In the past, most models projected a “climate sensitivity”—the warming expected when atmospheric carbon dioxide (CO2) is doubled over preindustrial times—of between 2°C and 4.5°C. Last year, a landmark paper that largely eschewed models and instead used documented factors including ongoing warming trends calculated a likely climate sensitivity of between 2.6°C and 3.9°C. But many of the new models from leading centers showed warming of more than 5°C—uncomfortably outside these bounds.
The models were also out of step with records of past climate. For example, scientists used the new model from NCAR to simulate the coldest point of the most recent ice age, 20,000 years ago. Extensive paleoclimate records suggest Earth cooled nearly 6°C compared with preindustrial times, but the model, fed with low ice age CO2 levels, had temperatures plummeting by nearly twice that much, suggesting it was far too sensitive to the ups and downs of CO2. “That is clearly outside the range of what the geological data indicate,” says Jessica Tierney, a paleoclimatologist at the University of Arizona and a co-author of the work, which appeared in Geophysical Research Letters. “It’s totally out there.”
Science! (as in, “she blinded me with”)
It’s unclear as to whether or not Mr. Voosen is discussing equilibrium climate sensitivity (ECS) or transient climate response (TCR). It’s an important distinction.
Transient and Equilibrium Climate Sensitivity
Projections of the severity of anthropogenic climate change are strongly dependent on our estimates of climate sensitivity, traditionally defined as the global average warming at the Earth’s surface due to a doubling of the carbon dioxide from pre-industrial levels. This importance arises not because global temperature change directly causes all of the impacts of major concern, but because many effects of climate change are predicted to increase in severity with larger global warming.
An important distinction is made between the equilibrium sensitivity — the temperature change realized after allowing the climate system to equilibrate with a higher value of CO2 — and the response on shorter time scales, before the deep oceans have had time to equilibrate, that is of more direct relevance to the changes we are likely to see in the 21st century. The latter is often quantified by raising the carbon dioxide in a model at the rate of 1% per year and examining the response at the time when carbon dioxide concentration has doubled, referred to as the transient climate sensitivity or response. (At a rate of 1% per year, doubling requires 70 years.)
Equilibrium sensitivities in global climate models typically range from 2 to 5K, while the transient climate responses are smaller, in range of 1.0-2.5 K, due to the cooling influence of ocean heat uptake.
[…]
The ratio of transient to equilibrium sensitivity varies from 1/3 to 1/2 in this group of GFDL models indicating significant variation of the transient cooling influence of the ocean. The relationship of the ocean’s cooling influence to ocean heat uptake and circulation changes has been an ongoing thread of GFDL research. For example, He et al (2017) noted that stronger deep ocean circulation prior to forcing reduced the magnitude of transient warming in a GFDL model.
Cloud feedbacks are widely considered to contribute the largest uncertainty to climate sensitivity. Simulated climate sensitivity varies considerably with choices made about cloud parameterizations that are not well constrained by observations (Zhao et al 2016). Simulated cloud responses depend on the pattern of surface temperature change, not just its global magnitude (Silvers et al 2018). Because of the importance and complexity of the interactions of clouds and climate GFDL is focusing effort on a cloud climate initiative.
[…]
GFDL
Here’s a graphical illustration from IPCC TAR, 2001:

TCR occurs simultaneously with the rise in atmospheric CO2. While, the difference between ECS and TCR occurs over the next several hundred years and would likely be indistinguishable from background noise.
I am not claiming that this is correct or empirically verifiable. I’m just explaining the concept. These are the sensitivities of the GFDL climate models:
| Model | Transient Climate Response | Equilibrium Climate Sensitivity |
|---|---|---|
| CM2.1 | 1.5 K (Randall et al 2007) | 3.4 K (Stouffer et al 2006) |
| ESM2M | 1.3 K (Flato et al 2013) | 3.3 K (Paynter et al 2018) |
| ESM2G | 1.1 K (Flato et al 2013) | 3.3 K (Krasting et al 2018) |
| CM3 | 2.0 K (Flato et al 2013) | 4.8 K (Paynter et al 2018) |
| CM4 | 2.1 K (Winton et al submitted) | 5.0 K (Winton et al submitted) |
| ESM4 | 1.6 K (Dunne et al in prep) | 3.2 K (Dunne et al in prep) |
In the ESM4 model, the average temperature would rise 1.6 °C over a period of about 70 years as atmospheric CO2 and then another 1.6 °C over the subsequent 430 years. This doesn’t strike me as particularly catastrophic, considering that the first 1.0 °C or so has already occurred.
This graph is a favorite of mine:

Our buddy Zeke Hausfather was kind enough to “debunk” it on the Carbon Brief blog:

He also kindly provided a link to the Excel file for his graph. I downloaded the file and plotted only the instrumental estimates of ECS (I “eschewed models and instead used documented factors”).
| ECS study | year | min | max | ECS mean |
| Harvey and Kaufmann 2002 | 2002 | 1.0 | 3.0 | 2.0 |
| Gregory et al. 2002 | 2002 | 1.6 | 10.0 | 2.1 |
| Kaufmann and Stern 2002 | 2002 | 2.0 | 2.8 | 2.6 |
| Knutti et al. 2002 | 2002 | 2.0 | 9.2 | 4.8 |
| Frame et al. 2005 | 2005 | 1.2 | 5.2 | 2.3 |
| Tsushima et al. 2005 | 2005 | 3.1 | 4.7 | 3.8 |
| Forster and Gregory 2006 | 2006 | 1.0 | 4.1 | 1.6 |
| Forest et al. 2006 | 2006 | 2.1 | 8.9 | 4.1 |
| Stern et al. 2006 | 2006 | 4.4 | 4.5 | 4.4 |
| Chylek et al. 2007 | 2007 | 1.1 | 1.8 | 1.6 |
| Schwartz 2007 | 2007 | 0.9 | 2.9 | 1.9 |
| Lindzen and Choi 2009 | 2009 | 0.4 | 0.5 | 0.5 |
| Murphy et al. 2009 | 2009 | 0.9 | 10.0 | 3.0 |
| Lin et al. 2010 | 2010 | 2.8 | 3.7 | 3.1 |
| Lindzen and Choi 2011 | 2011 | 0.5 | 1.1 | 0.7 |
| Aldrin et al. 2012 | 2012 | 1.2 | 3.5 | 2.0 |
| Schwartz 2012 | 2012 | 1.5 | 6.0 | 3.0 |
| Lewis 2013 | 2013 | 1.0 | 3.0 | 1.6 |
| Otto et al. 2013 | 2013 | 0.9 | 5.0 | 1.9 |
| Bengtsson and Schwartz 2013 | 2013 | 1.5 | 2.5 | 2.0 |
| Otto et al. 2013 | 2013 | 1.2 | 3.9 | 2.0 |
| Skeie et al. 2014 | 2014 | 0.9 | 3.2 | 1.8 |
| Loehle 2014 | 2014 | 1.8 | 2.3 | 2.0 |
| Lewis 2014 | 2014 | 1.2 | 4.5 | 2.2 |
| Kummer and Dessler 2014 | 2014 | 1.6 | 4.1 | 2.3 |
| Lovejoy 2014 | 2014 | 2.5 | 3.7 | 3.1 |
| Donohoe et al. 2014 | 2014 | 3.1 | 3.2 | 3.1 |
| Urban et al. 2014 | 2014 | 2.1 | 4.6 | 3.1 |
| Monckton et al. 2015 | 2015 | 0.8 | 1.3 | 1.0 |
| Loehle 2015 | 2015 | 1.5 | 1.6 | 1.5 |
| Lewis and Curry 2015 | 2015 | 1.1 | 4.1 | 1.6 |
| Cawley et al. 2015 | 2015 | 1.8 | 4.4 | 2.0 |
| Johansson et al. 2015 | 2015 | 2.0 | 3.2 | 2.5 |
| Johansson et al. 2015 | 2015 | 1.6 | 7.8 | 3.1 |
| Bates 2016 | 2016 | 1.0 | 1.1 | 1.0 |
| Lewis 2016 | 2016 | 0.7 | 3.2 | 1.7 |
| Loeb et al. 2016 | 2016 | 0.8 | 10.0 | 2.0 |
| Forster 2016 | 2016 | 1.1 | 5.3 | 3.0 |
| Armour 2017 | 2017 | 1.7 | 7.1 | 2.9 |
| Lewis and Curry 2018 | 2018 | 1.2 | 3.1 | 1.8 |
| Average | 2.3 | |||
| σ | 0.9 | |||
| -2σ | 0.4 | |||
| +2σ | 4.2 |
The average ECS was 2.3 °C. This would translate to a TCR of 1.2-1.6 °C.

Multiple estimates published in the same year is why several years appear multiple times.
Scatter plots of the other methods demonstrate that the problem is models, “all the way down”…

Paleo methods produce a higher sensitivity because, almost invariably, the CO2 proxies are of much lower resolution than the temperature proxies. This is particularly true of ice core data.
What’s the solution to the hot model problem?
The climate scientists say, “Put more PhD’s on the payroll!”
A cadre of researchers dedicated to the task of translating the models into useful projections could also help, says Angeline Pendergrass, a climate scientist at Cornell University who helped develop one technique for weighting the model results by their accuracy and independence. “It’s an actual job to go between the basic science and the tools I’m messing around with,” she says.
Science! (as in, “she blinded me with”)
At least Gavin Schmidt sees that there might be a problem…
Already scientific papers are appearing using CMIP’s unconstrained worst-case scenarios for 2100, adding fire to what are already well-justified fears. But that practice needs to change, Schmidt says. “You end up with numbers for even the near-term that are insanely scary—and wrong.”
Science! (as in, “she blinded me with”)
However, with the prospects of even more “insanely scary—and wrong” climate “science” papers on the horizon and the even more insanely scary and wronger media reporting of these papers, the second half of 2021 will be a target rich environment…
Closing Notes
- Some of this post was directly copied from a previous post of mine: Climate Sensitivity Estimates: Declining or Not? Is it possible to plagiarize yourself?
- Yes. I realize that the instrumental climate sensitivity estimates rely on models. All measurements rely on models.
References
Terando, A., Reidmiller, D., Hostetler, S.W., Littell, J.S., Beard, T.D., Jr., Weiskopf, S.R., Belnap, J., and Plumlee, G.S., 2020, Using information from global climate models to inform policymaking—The role of the U.S. Geological Survey: U.S. Geological Survey Open-File Report 2020–1058, 25 p.,
https://doi.org/10.3133/ofr20201058.
Well, at least, the science on the mask and the Covid vaccines are settled.
Two weeks to flatten the curve.
And another two weeks now. Mask mandates coming back (local county just added one), vaccination status irrelevant. More lockdowns on the horizon. They didn’t get enough of it last time.
This is socialism – rapidly becoming fascism.
You knew they weren’t going to give this up.
Absolutely, Joel. What we’re seeing right now is exactly what I said would happen over a year ago (where’s MY grant money, I actually get predictions right). They’re pushing hysteria about the Delta variant (check out the “massive outbreak” in Vermont). Nobody can EVER get sick.
If/when this covid insanity ever breaks, look forward to the same thing being repeated every flu season.
I was a sociology major – I’ve been calling this trend out for the last couple decades. Fear and hate are powerful, fast-burning tools – especially when enabled by media-control and censorship. The ‘climate crisis’ was just one head of the hydra.
But now even some of the sheep are catching on and starting to baaaaa!
“Well, at least, the science on the mask and the Covid vaccines are settled.”
As Fauci will tell you. Though which version he’ll tell you depends on what mood you catch him in.
You put your covid mask on
You take your covid mask off
You put your covid mask on
And shake it all about
Do the freaking Fauci
And turn yourself around
That’s what it’s all about!
😆
When the writer of the original of this song died it took 3 hours to get him in his coffin.
Hey, sickness and death are bad things mostly not caused by humans.
Climate change is neither good or bad and also mostly not caused by humans. It just is.
Death and climate change are both inevitable, cannot be avoided, and we are rarely prepared for either.
However, without an enemy to defend against. there is little reason for human endeavor beyond selfish pleasures.
I vote for selfish pleasures.
Except it isn’t ‘selfish’ – it’s simple.
And basic. And natural.
A couple of typos:
Sea level has risen $0.25 since 2013.
Sea level has risen $0.25 +/- $1.00
Sorry, you still have a mistake re conversion of units:
Sea level has risen $0.25 since 2013.
Sea level has risen Metal$0.25 +/- Paper$1.00
If the Buck is the range, wouldn’t it be +/- half a buck?
modeled inflation?
I would not give 2 cents for it.
That wouldn’t be satirical.
Wouldn’t it? . . . in would then be entirely consistent with bucking the trend.
No typo. It’s satirical.
David, surely the 3.4mm sea level rise is only from satellite data with it’s dodgy corrections. My understand is that tide gauges around the world support a much lower figure 1-2mm. Willis has lots to say about this.
Yep…
But it appears to fluctuate.
Rock hammer for scale…
Thanks, Dave
I do however question your use of the Estwing. I have three sizes of blue Estwing. I always thought I should commission a mini one, maybe 30mm long so I could show clients the photos of the HUGE gold veins I discovered! Or maybe find a mini-girlfriend to photograph alongside immense coal seams!
In that case, you’ll need by suite of resource economic analysis software…
😎
“observed” now means “recorded + adjustment to fit theory”
How much is that in new pence?
What’s that range in bitcoin? I think that price is about as stable as the output of the models.
Since 2013, 2 bits +/- 4 bytes
Good comment. Whatever happened to bytecoin?
Each model would become immensely more accurate (closer to reality) if they would simply reset each model run’s starting point to the current observed balloon and satellite datasets. In other words, incorporate realtime feedback like they do with hurricane track forecasting, where each model run starting point is reset to current hurricane position. Their method of starting model runs from 30-50 years ago is just ridiculous. It’s not tied to reality and therefore serves no practical purpose. It’s basically theoretical science, which should not be a key determinant in real-world policy determinations.
Changing the start point of a model run is not the same as incorporating realtime feedback into the model. Restarting a bad model that calls for 4 degrees of warming per century in 2020 still results in predicting 4 degrees of warming in the next 100 years, there’s just less total divergence from the start point – all that does is hide the divergence between the model and reality. Incorporating the last 20 years of data would mean changing the model to predict less than a degree of warming over the next 100 years, and they’re not about to do that.
If resetting each model run start point to current conditions is not feedback, what do you call it? Every year the starting point reflects reality instead of this crazy divergence that gets progressively worse year after year and show the models don’t work. Year after year the observed data become the graphed data, and reveal the model forecasts for what they are – garbage.
Every model run start that doesn’t reset to observed data is pretending that the previous model run was accurate, compounding error upon error every year.
Modeling is more than just software. It’s also involves execution methodology.
With apologies to Lewis Carrol-
Red Queen: Speaking of “execution methodology”, off with her head!
Physical modeling involves physics first and foremost, icsil. Physics that is presently unavailable. Your advice will do nothing to improve model accuracy.
And we all know that climate model accuracy is a chimera of false precision.
If you look past the first few years the models essentially become linear projections of the form y = mx +b. If you change “b”, i.e. the current start point, you still wind up with the same projection value increases, “mx”. If the model projects 5C increases over the next 100 years you will still get the same 5C increase no matter your starting point – i.e. the earth is turning into a cinder and we are all going to die!
It’s why so much of CAGW is couched in terms of anomalies. It’s the *increase” the alarmists depend upon for its fear factor. Changing the start point won’t change the anomaly projections of the models.
No, of course they won’t. But making observed = start point for each run creates a historical trend that is quite different from forecasted trends, showing them to be unrealistic. Imagine forecasting hurricane paths the way climate models are run. It would be utter nonsense.
Your idea changes nothing, icsil. Projections would remain utter nonsense.
If the 10 year accuracy doesn’t change, it doesn’t matter when they set the start date to.
Say you want to walk from the south end of a football field to the north end. You have a compass on your phone that points you in a direction-that’s your model. You walk half the distance, then look down and realize you’re 20 feet to the left of the chalk line. So you move back to the chalk line and start again. You finish 20 feet to the left of the end point because you didn’t change the model. Sure, you would have finished 40 feet away if you had not restarted, but the difference isn’t that the model is improved, you just have a smaller test. If you went back to the beginning and started again, a full test still results in 40 feet of error.
Incorporating feedback would mean changing the program of the compass, so that the direction you walk has less angular difference. When you can take the new program, go back to the start, and only have 10 feet of difference instead of 40; then you have incorporated feedback into the model.
Models are more than just software. The way they are executed matters greatly. Consider hurricane forecasting. The models don’t change, but they eventually get very accurate over the course of a hurricane because they reset model run start points to observed locations. Imagine if they didn’t do that. They would basically look like CMIP graphs with actual landfall nowhere near forecasted landfall position..
We need a reality TV show where hurricane forecasters and climate modelers swap roles for a season. Now that would be funny.
“Uh gee, Gavin, the hurricane you forecast to hit NYC hit Key West”
I watch hurricane model results quite closely living in FL. The projected track is often off from the model results. The people doing the forecasting at the National Hurricane Center are more accurate than the models.
The models are reset and re-run because the forecasts fall apart quickly. Climate models aren’t supposed to fall apart.
The point of hindcasting is to suggest the climate models are accurate. Have you ever seen a hurricane hindcast model? Lol.
That would be the way to go. Adjust the next run to account for the error in the first run. Just remember to move 20 feet to the right before you start.
Trouble is, as the IPCC says, “The climate system is a coupled non-linear chaotic system, and therefore the long-term prediction of future climate states is not possible.”
So you end up in the wrong place anyway!
And btw, updating a program is not realtime feedback. It is model development feedback.
Models are based on cherry-picked science. Models ignore many 1) natural factors, such as solar changes, and 2) negative feedbacks to greenhouse gas forcing.
Why is it science if they are playing computer games? The models do not model reality so there is no science involved at all.
Right on Trying to Play Nice. David has convinced us that models running in bikinis are more reliable than models run by climate alarmists. Nice job!
Sorry, icisil, you can’t do that. Individual UN IPCC CliSciFi GCMs start with a global average temperature differences of up to 3 C. They are each modeling different “physics.” The real world has no influence on UN IPCC CliSciFi modeling. Model outputs have been deviating from observations for decades (see hindcasts vs observed) but the paid modeling gamers won’t change their models. It’s laughable that Gavin Schmidt says its only been the last year or so that it has become obvious the models are running hot.
That was my whole point. Resetting model run start points to observed data would help anchor them in reality.
Icisil, you must not be following the mainstream discussions of the UN IPCC CliSciFi GCMs. It is acknowledged by everyone involved that the GCM do not reflect the actual climate. Just one example (of many) prove that: The GCMs have average global temperature difference of 3 C. The use of anomalies covers up the basic fact.
Want another? The lack of a measured tropical tropospheric “hot spot” proves the 3X water vapor amplification of CO2 warming hypothesis is wrong. Amazingly, the UN IPCC CliSciFi CMIP6 GCM’s smear the hotspot throughout the troposphere. And no “reputable” scientist says a word.
It’s science fiction
If the model is faulty, it’s not going to get better because you cheat and input real data instead of model results. The fact that the models diverge from reality shows that they are worthless for climate prediction and especially for government planning.
Right. I think there are several people (you know who you are and most of us also know who you are) who owe apologies for rabid and vitriolic attacks in defence of these indefensible error-ridden excuses for computer models.
Well? We’re waiting?
Nick has his thermostat set so low his shivering is preventing him from hitting send
But, but…
These models are more powerful and trustworthy than their predecessors!
They’re still completely wrong, but more powerful and trustworthy!
“In advance of the U.N. report, scientists have scrambled to understand what went wrong and how to turn the models …”
They know exactly what went wrong because they built them and TUNED THEM and massively adjusted temperature readings precisely to reflect their preconceived radiative forcings to declare a phoney crisis.
I’ve already defined the reasons before. In the last 2 decades of the twentieth century, before they became a ‘consensus’, climate scientists were reasonably honest, perhaps not the brightest of lights and naive about the politics behind it all.
With the wrecking ball “Pause” in the new millennium, the honest ones, in shock, fell ill with the career ending “Climate Blues”. Those remaining ceased (trying) to do science and became ruthless activists, trashing the temperature record by adjusting them massively to create an ersatz forcing to yield ‘forecasts’ of disaster in the offing and to remove former steep warming and steep cooling trends that sceptics debunked their science with – how could they happen before CO2 emissions were significant? Then Climategate revelations, then smearing and threatening of sceptics, gatekeeping their attempts at publication, having editors and sceptics dismissed from their jobs, yellow journalism, yellow clisci publications….
I pointed out the crushing worry for cliscis over the present 6yr (and counting) cooling trend that could join up with and add another decade to the Pause – a 30yr trend! following a piddling 18 years of warming that caused all this hype, cost, mass hysteria and impoverishment of hundreds of millions of people. Yeah they know the jig is up.
We need an updated chart with the certainties from Roy Spencer. Ideally in a higher resolution so it can be printed off the computer and not get pixelated. I will be willing to bet that the claimed certainty will be up to 97% (97% chance of being somewhere in the range of guesstimates,) The further away the models are, the higher the certainty reported. Alas, it is 100-the percentage they put out. Thus, it is 100-95 % – 5% certainty that the actual temperature will be the modelled prediction.
We can be 100% certain that lying liars are gonna lie, even after their lying lies are exposed.
It only requires two and a half brain cells to notice when looking at the graph “CO2 climate sensitivity estimates declining” that in 2000 the estimates range between 3 and 6 but in 2015 around 1.5. This is huge! So much for the science being settled. We will now see a torrent of garbage, disingenuous explanations of why we can still trust the experts.
0.8 TOPS.
Again, hypothetically.
We have had an entire year of disingenuous explanations of why we can or should still trust experts, and the trust is lower than ever, for all kinds of experts.
And just to be clear, that’s still nothing but a hypothetical effect, which assumes all other things held equal. Once you account for this:
With the fact that (as indicated elsewhere) a small change in cloud cover, alone, can completely offset the hypothetical effect of a doubling of atmospheric CO2, and it’s clear that “TCR” “ECS” is little more than an “academic” exercise.
All things considered, the actual, as opposed to hypothetical, effect of CO2 on temperature will not be distinguishable from zero.
Which is why numerous episodes of reverse correlation exist (50s-70s “Ice Age Cometh” cooling in the face of rising CO2 levels, reverse correlation repeatedly in the ice core reconstructions every time temperature “trends” change direction), and other evidence that the alleged “sensitivity” to CO2 is hogwash (no “runaway greenhouse effect” occurred when atmospheric CO2 was 17.5x what it is today, temperature plummeted from a “hot house” period into an “ice house” period with atmospheric CO2 at 10x what it is today).
Clearly, after feedbacks are “applied,” the hypothetical CO2 “climate driving power” is nonexistent. While “correlation does not equal causation” is an essential principle of science, reverse correlation pretty much excludes causation, and the fear mongering about CO2 kicking off some “runaway effect” is clearly nonsense in the context of the Earth’s climate history.
AGW
I merely quoted this statement to prove the value of the scientific “certainty” and not the merits of “CO2 climate sensitivity”
As I pointed out in another post recently, understanding climate is massively complicated because it is not only so complex but also needs an enormous number of inputs from various sciences. To use an analogy, it is like a huge jigsaw picture with a million pieces but we only have a few thousand and no picture on the box. We may find some fit with other pieces but left with so many gaps we can at best guess what the single pieces portray. Estimates may be close to reality but guestimates no better than gambling – a tiny number of winners but multitudes of losers. The alarmists fall in the latter group but massively enrich a tiny number of greedy exploiters.
It is a sad fact that academic and governmental employees have become paid mouthpieces for the politicians. Ask any old Soviet or Eastern European citizen how to view official governmental pronouncements, including those that are supposed to be scientific. For example, the U.S. National Climate Assessments are farcical jokes.
M in D: Good comment. I wonder how soon the scientific establishment will get to retracting all the peer reviewed published papers that relied on the now recognized to be flawed models. Certainly every paper the refers to RCP8.5 should be immediately canceled. Maybe we could get Google Scholar to add a note to any search results that include RCP8.5 references saying “Determined to be invalid by the climate modeling community”.
I’m willing to wait a week or two.
We have an entire continent known as Antarctica wasted, not a thing can be grown on it and it’s uninhabitable by any conventional standard. The only useful purpose might be to provide mankind with an unlimited source if ice for Gin & Tonics.
But that’s good according to the climate l00nies.
SLR large enough to make any meaningful impacts on coastal regions will take hundreds, if not thousands of years to manifest itself, yet the public are mislead into believing the world is going to endure some sort of global tsunami very, very, very soon. ‘Very’ remaining unquantified.
Personally, I think the answer to it all lies in Maricopa County. If that is resolved and found to have been subject to considerable voter fraud, and it must be considerable to be decisive, every county in every swing state will demand it’s own audit. If that all goes badly for Biden, again with considerable fraud demonstrated, the Democrats will remain unelectable for decades, if they survive at all.
There will be millions of honest Democrats politically homeless, and left wing woke, identity and divisive politics will be extinguished overnight. That’s the tsunami, and it will hit the UK, Australia, Canada etc. and, to a lesser extent, Europe.
The coming year may prove to occupy peoples mind more than covid and climate change, the two great left wing vectors for ‘The New World Order’.
The Great Reset may well happen, just not in the way people expect.
Minus 2 degrees C since 1980.
Antarctic sea ice has been forming very rapidly. It is almost 2 standard deviations above the 30 year average.

Hot Scot
The Fraud Olympics (climate, covid, elections, males participating in female events) must be really lucrative with no adverse consequences for those getting caught. The media do not fulfil their public watchdog role but growl at those who point out the fraud. How many politicians are banned from politics for life or merely given a slap on the wrist and perhaps a few years before being recycled after promoting fraud? Any wonder many decent people hate politics.
It would be great is you were right, but things are playing out as if Orwell’s Animal Farm is the blueprint. Here’s an analysis of the book LINK. We are at about the stage where The pigs introduce the dog police force. In case you haven’t noticed the Capitol Police seem to be above the law. Wikipedia tells us:
They are charged with the protection of members of Congress, officers of Congress, and their families…While performing protective functions, the Capitol Police have jurisdiction throughout the entire United States.
“millions of honest Democrats”?
Please, name one. And that includes the voters who knew what they were voting for and will soon pretend they were mislead, they thought they were voting for “centrists”.
I think hotscot is correct. There are millions of reasonably honest well intentioned well indoctrinated democrats.
Democrat county functionaries refuse to release the routers, and the AZ senate is one or two votes shy of voting them in contempt.
Let’s hope so, but I don’t share your optimism. While the leftists may be outraged if the perception was that election fraud favored Republicans, election fraud that favors Democrats will be viewed among the deluded as a “success” in the “any means necessary” mindset to shove their agenda down everyone’s throats.
HotScot posted: “We have an entire continent known as Antarctica wasted, not a thing can be grown on it . . . ”
Please look into penguins. There are 18 species of penguins, 5 of which live in Antarctica.
Please look into other birds of Antarctica. Many species of flying birds, lay and hatch eggs on the rocky/sandy beaches of Antarctica. “Each spring, over 100 million birds breed around the rocky Antarctic coastline and offshore islands. These include albatrosses, petrels, skuas, gulls and terns.”—source: https://www.antarctica.gov.au/about-antarctica/animals/flying-birds/
Please look into seals. Antarctica fur seals and southern elephant seals breed in dense colonies on beaches.
I could go on and on, but need I?
Don’t forget the whales and the krill they feast on!
HotScot’s OP statement was “. . . grown on it . . .”
Of course, I forgot about the agriculture,technology and industry penguins, flying birds and seals contribute to humanity……..
Hmmmm . . . I could swear that your OP above had these specific words in it: “We have an entire continent known as Antarctica wasted, not a thing can be grown on it . . .”
Maybe agriculture, technology and industry—you know, “things that contribute to humanity” (your words)—are the only things of value of life growing anywhere on Earth . . . but, then again, maybe not.
I disagree. I think it’s the perfect ‘asylum’ for Climate Worriers!
David:
I know the reports are beastly, but surely you meant beats?
Fixed. I’ll add Homer Simpson later.
A few years back, a Roman era copper mine was melted out of the ice in the Alps.
This means that the glaciers were higher than they are now during the Roman Warm Period long enough for the mine to be found and developed.
Yet, despite empirical evidence that the past was warmer than today, Climatistas will still insist the contrary.
“Climatistas will still insist the contrary”
Thay have to deny history, otherwise it blows up their claim that we are living in the hottest time in human history.
empirical, or imperial?
Not to mention the bodies of ancients that are found today when glacier ice melts. One must surely wonder how they crawled under the ice to die.
Mark that’s very interesting…I’ve heard it before. Do you happen to have a link to photos of the site?
Here’s one
https://climateaudit.org/2005/11/18/archaeological-finds-in-retreating-swiss-glacier/
Thanks Mark,
The Otzi museum in Boltzano, South Tyrol is wonderful…well worth a day to explore if you ever get there (Covid permitting).
Bravo, Middleton, bravo !!!
Climate models are the equivalent of the Oracle of Delphi for the Church of Warming.
The Oracle was far more reliable.
Heck, even Oracle (the database software) is more reliable!
I have two pedantic questions here relating to this which bug me and would be grateful for an explanation; for It is a matter of the IPCC logic which appears to be inherent in all these models.
(Note: I am long in the tooth so think imperial!! Convert the units as you wish. I’ll not clutter up the post with equivalents.)
The IPCC Logic:
The IPCC defines Radiative forcing (RF) as a force in units of Lbs force.
It then converts this into a flux with units of ft Lbs; but I don’t know how this was done. (We are given here a figure of around 1.6 Watts/sq.m.)
This is later converted to a temperature value (deg C) via the Planck equation using a calculated climate sensitivity coefficient. But again I do not know how this has been calculated and from what I see there are various views on how this is done, judging by the wide results on offer.
In my book, in order to convert a Force into a Flux you need to know the sensitivity/resistance/etc. of the circuit in question. The analogy being in electrical terms as needing to know the resistance of a circuit in order to calculate the current and hence the Flux.
This raises my two pedantic questions:
First: How was the original sensitivity obtained? And secondly: Is it valid to use the resulting flux value in any subsequent calculations involving different circumstances? This being done if you use the original flux value to calculate the temperature via the Planck equation.
I don’t know whether this could be described as a form of circular logic; but it does appear to me that there is something wrong here.
Can anyone put me right on this? For indeed it is bugging me and maybe, perhaps?, it is bugging the Models too?
Our climate is totally controlled by changing amounts of SO2 aerosols in the atmosphere, primarily from random volcanic eruptions, and consequently can NEVER be modeled.
I’d agree it can never be modeled, in particular when the “model” assumes any significance of atmospheric CO2 which has no demonstrable effect, only a hypothetical one that would only apply in the absence of other changes.
But you can’t ignore solar activity, orbital variations, movement of the solar system through the “arms” of the Milky Way, cosmic ray intensity, and a host of other “factors.” Any attempt to pin the “driver” of climate down to any one thing is doomed to fail, because the Earth’s climate is driven by many things, and we haven’t even identified them all yet, much less have the forces we have some awareness about been adequately observed, measured, and considered in the context of all the others.
In the “stages of learning” (about the climate), as follows:
Humanity is solidly at Stage 1, but the so-called “climate scientists” act as if they’re at Stage 3 or 4. Therein lies the problem. Until the “CO2 fetish” gets binned, “climate science” will remain on the level of “sacrificing virgins to the volcano” to improve the weather.
AGW is Not Science:
The other factors which you mention do NOT show up in a careful analysis of average anomalous global temperatures, at least since 1850.,
ALL observed temperature changes for that period are coincident with increasing or decreasing levels of SO2 aerosols in the atmosphere,,If they have any effect, it is too small to be detectable..
https://www.skepticmedpublishers.com/article-in-press-journal-of-earth-science-and-climatic-change/
This article has been re-written with even more supportive information, but I can’t provide a link to it at this time
The logic goes like this: We can’t account for the warming since 1975 any other way so obviously it’s caused by anthropogenic CO2.
That’s not a proof it’s a logical fallacy. Actually, it fits several logical fallacies: argument from ignorance fallacy and single cause fallacy among them.
We can account for it by considering contrails btw.
We could easily account for it by working out how much we’ve reduced aerosols by cleaning up our emissions since the 70s. It’s become massively cleaner.
“We can’t account for the warming since 1975”
They could account for it if they looked at a regional surface temperature chart, which shows a similiar warming from 1910 to 1940, where CO2 was not a major factor, according to the IPCC.
So, Mother Nature warmed from 1910 to 1940 at the same magnitude as the warming from 1980 to the present, and the high temperatures were equally warm.
The alarmists have the example, they just refuse to acknowledge it, and with good reason since it blows up their Human-caused Climate Change narrative.
Hansen 1999:
Mother Nature caused the warming from 1910 to 1940. There’s no reason why Mother Nature is not the cause of the warming from 1980 to the present day: Same magnitude of increase, and the same temperature highpoint in both cases.
David,
The use of rulers, quarters and dollar bills to show scale is confusing to the layman. Please use a rock hammer in future. Thanks!
It’s too small for a rock hammer and I figured a hand lens would be even more confusing… 😉
Brunton compass!
There’s an old joke that the only time a geologist takes a photo of a person, the person was only there for scale… 📏⛏️⚒️😎
My dad had a one-foot piece of a survey stick in his office for quite a few years, the note attached to it read: “For surveying coal mines with low roofs”.
I still have it.
Yes, that’s very true…girlfriends and wives don’t seem to understand the real reasons we bring them along on field trips!
It will be important to see how the forthcoming IPCC AR6 handles this hot model problem. Given that ScienceMag acknowledges it the IPCC may well do so too. We can capitalize on that.
1. Don’t bother reading the scientific report. The Summary for Policymakers, SfPM, will be released beforehand. In the past, key sections of the scientific reports were edited, just before publication, to reflect what politicos had decided in the SfPM. By reading the much shorter SfPM the most important ‘findings‘ of the Scientific Reports are available.
2. “climate models that help them project the future”
Translates as climate models to make up the future. How they can call this a projection, or even a prediction, when no model has ever been right, is a mystery to me. Political representatives project a future “net zero“. Look at the models as propaganda to bully us into accepting “net zero“.
“models are now projecting warming rates that most scientists, including the modelmakers themselves, believe are implausibly fast“. In other words they don’t believe their own models. A bigger problem for them could be too many of the public are no longer taken in by the scam. Nor will any “climate scientist” defend the scam in a public debate. The only ones defending climate alarmism, outside the IPCC’s own closed circles, are brain-dead green activists; who’ll ‘believe‘ anything they’re told they need to believe to influence policy. Much like good salesmen believe their latest product is the best thing in the world.
We should be worrying more about the clearly observable climate effects we see right now, everywhere this summer.
Germany and China and India and the baking Middle East and Canada etc etc don’t need to worry about the ‘if’ of climate damage – they already have had it.
Are you able to prove your words ?
Certainly not.
You never can’t prove your words und you even didn’t learn the difference between weather and climate.
griff, like a the good bulldog that he is, once he gets hold of a lie, just won’t let go.
There was nothing unusual about the storms in Germany, such storms happen almost every year. The only difference was this time they hit in a mountainous region with limited drainage. Also that area gets massive floods every hundred years or so with records going back to the 1300’s. Heat waves are also not unusual.
griff also hangs on to his precious ignorance with the desperation of a drowning man about to lose his last paycheck. When people talk about 1000 year events, they are talking about a specific point on the planet. Since their are millions of such “points” on the planet, there is nothing unusual about having thousands of once in a 1000 year events, every year.
The German floods were damaging because the dam operators didn’t release water to make room for the forecast rain. Human incompetence, not climate change.
If the storms had been a dozen miles or so in almost any direction, they would have been a less damaging.
Still not climate change.
“We should be worrying more about the clearly observable climate effects we see right now, everywhere this summer.”
That’s not climate, that’s called weather.
“That’s not climate, that’s called weather.”
It’s all absolutely terrifying to the thermophobic Grifter Troll.
Griff STILL can’t get his brain(?) around the difference between weather and climate, regardless of how many times he’s told.
I guess he’s clueless on what statistics are and how they’re used.
Griff is just parroting the latest propaganda mantra. The masses have already figured out that the climate is changing little and within normal bounds of variability. So the new approach to scare the masses is to highlight every weather event and natural disaster and attribute that event to global warming. Somewhere in the bowels of the CAGW machine, the warmistas have determined and signaled that this is the new approach. Griff is just doing what he is told. Notice that most of his recent posts have been hysterical rants about bad weather, something new for Griffy. He used to mostly blather on about the wonders of renewable energy.
You talking about the brutal cold and snows in Brazil and Argentina this southern hemispheric winter where it froze out the coffee and corn crops? Or the heavy snows in South Africa? This site which processes tens of thousands of weather stations hourly says it isn’t warming. http://temperature.global/
Snow on the ground in Brazil right now. Chile has had at least two unusually cold winters in a row. Antarctic sea ice extent third highest since 1979 yesterday. Near record cold on Antarctica last month, more than cancelling out the western North American heat wave.
Hi John, although I grant the start of winter was pretty cold in Chile, July has been exceptionally warm and dry. Hope it changes and we don’t have a year as dry as 2019 again…
Plus the vinyards in France destroyed by cold last winter. Of course, griffter will lie once again (as he did before) and falsely claim that this is a predicted consequence of CAGW.
Global warming predicts everything. That’s the beauty of the scam.
Without your models to back you up you’ve got nothing but fresh air and your personal delusions, Griffy. What you say is demonstrably supported by bugger all – even Gavin Schmidt has turned his back on you. Dasvidaniya Ivan, for you the war is over.
Griffy-poo: I will say this one — no wait, three — more times: Historical perspective, historical perspective, historical perspective.
Unless you can show that the meteorological events of today that you reference in your comment are historically unprecedented and more frequent than in the past, you have no case here. The Grauniad is not some Holy Book on infallible and unquestionable truth. Far from it.
Look at MarkW’s comment above at July 30, 2021 3:59 am about a Roman Era copper mine obscured by a glacier (for who knows how long) that recently retreaded recently and uncovered the mine. What does that tell you about Roman Times climate? Similar reports exist abut tree stumps uncovered by glaciers that are carbon dated back to the MWP. The tree line is now at a considerably lower altitude than those stumps.
Europe’s LIA history has records of plenty of really nasty meteorological events that caused a lot of crop failure, damage and death. All you have to do is take the time to research and read it.
As I always say, one of the worst things about being in a cult is not knowing you are in one. Wake up and smell the bovine dung from the alarmist camp Griffy-poo.
I’m aware of some newsworthy weather events. However, I don’t recollect anything Earth shattering with respect to climate. Oh yes, I forgot. You don’t know the difference between weather and climate!
“We should be worrying more about the clearly observable climate effects we see right now, everywhere this summer.”
I think they are just the climate effects that *you* see, Griff.
You are seeing what you want to see, not what is actually there.
I know, you have a need to maintain the false reality you live in.
griff,
You claim “clearly observable climate effects we see right now, everywhere this summer”. Where I live in Southern Ontario, we are having a perfectly normal and pleasant summer. So do maintain that normal and pleasant is the result of man made climate change? Or does the “nobility” of your cause allow hyperbole to the point of outright lying.
That is good news – Canadians have been hoping to get some of the Global Warming.
OK, everybody, whether paid or not, the “Griff” persona is an obvious Trolling Device (TD). I think that one should respond to the misdirection and lies in the comments posted by the device, not directly to the “Griff” persona. We are trying to provide information to counter ideologically-driven lies and exaggerations, not to attack a TD. If one attacks the “Griff” persona it detracts from the intended message, while having no impact on the TD; it is wasted effort no matter how good or superior it may make one feel.
The best approach is to ignore it. It will then probably go away, because it feeds on replies.
Ignore the Trolling Device (TD), but address the TD’s lies in a scientific manner. In this case the TD persona “Griff” does not deserve attention-grabbing derision.
Hi – please explain the rapid warming shown in the previous graph – from 1910 to 1940 ish. It wasn’t carbon dioxide. This is a genuine question. Why can’t this present warming be regarded as the same?
(BTW I think Co2 should be monitored and limited – but it seems that the current situation is being over egged…)
I don’t think they can clearly explain it… But it falls into the margin of error of the model hindcast; so the model “explains” it statistically. They can’t explain the mid-20th century cooling either and are mostly ignorant to the the fact that it caused a drawdown of atmospheric CO2. And, yep, the recent warming is very similar to the early 20th Century.
An objective scientist would say that there is no anomaly in need of explanation.
I agree that atmospheric CO2 should be monitored and economically viable ways of reducing emissions should be pursued.
Thanks – I appreciate that answer. (I wonder what griff thinks…) And yes I agree with your last sentence – cheers.
Well, again, here is the reason why all these models are rotten in their core. Should be easy enough to understand.
http://climatemodels.uchicago.edu/modtran/
If you use US standard atmosphere (close to 288K!), remove all other GHGs except CO2, then double it from 400ppm to 800ppm, emissions drop by 3.768W/m2. If you apply that forcing to about 240W/m2 of current emissions TOA, you get 288 – ((240-3.768)/240)^0.25*288 = 1.14K warming for 2xCO2. Note, this is totally consistent with all the models and ECS estimates.
The problem is this: in reality the surface is not a perfect emitter, CO2 is overlapped with vapor and most of all clouds. In modtran just bring back other GHGs (reload) and add some clouds (stratus …. Top 2.0km), so that emissions are somewhat realistic 242.91W/m2. Now if we double CO2, emissions drop to 240.618W/m2, only 2.292W/m2 less.
It means 1.476W/m2 (=3.768 – 2.292) of the original 3.768W/m2 are overlapped with other GHGs and clouds and so they do not make any difference, as you can not block emissions twice. I mean not with having an additional effect.
And that is why all these models are so toxic, because they combine the purely theoretical result for 2xCO2 with unreal preconditions, and then apply this figure to the real world, including clouds and everything. I mean even if we would stick to the theoretical CO2 only situation, where emissions where more like 345W/m2, you would only get 288 – ((345-3.768)/345)^0.25*288 = 0.79K for 2xCO2.
Instead.. 288 – (240.618/242.91)^0.25*288 = 0.68K
If you try the “temperature offset” in modtran, you will find that 0.61K are actually enough to get back up to 242.91. That is because modtran holds the lapse rate constant and so percentage wise temperatures increase more strongly higher up the atmosphere, and less at the surface. And then of course, this figure is still too high since we did not correct surface emissivity, and 242.91 emissions TOA are a little too high as well. Realistically what you get for 2xCO2 is about 0.55K
The same thing, though way more severe, is also true for vapor. The difference is that a) vapor is more strongly overlapped with clouds and b) vapor is a kind of feedback loop. I mean if you have 1K warming (due to CO2 for example) and you get a feedback of 0.5K by vapor, then you are not done. You will have to add a feedback for those 0.5K, let us say 0.25, and then a feedback to it as well..
1 / (1-x) helps to cut this short. If x = 0.5, then you get 2 in the end, meaning vapor would double the effect of CO2. If x = 1, then you get indefinite feedback and a division by 0. If x = 0.2, then you only get 1.25, or just +25% including the feedback loop.
Climate models like to assume some 0.5-0.55K primary feedback, which is accurate for non-overlapped vapor. In reality, this primary feedback allowing for real conditions is only 0.15-0.2K. After the loop vapor feedback is exaggerated by about a factor of 5. And the real vapor feedback is actually smaller than lapse rate feedback, which of course is negative in nature, so that vapor is negative feedback all over.
The low res GCMs must remain GIGO computer games until and unless played upon devices with orders of magnitude more power, capable of modeling clouds and evaporative cooling.
As pointed out in my years ago guest post here ‘The trouble with climate models’, it is roughly a 7 orders of magnitude computational problem, for which there is no solution but,parameterization, tuned by hindcasting, which drags in the attribution problem, which why even the climatariat now says CMIP6 runs hot.
I looked up our article, but could not find any claim of a “roughly 7 orders of magnitude computational problem”.
Anyhow, as I pointed out above, it is not about the complexity of modelling, it is about trivial blunders on radiative effects given overlapping of GHGs and clouds.
But in the real situation the water vapour is already there. And it is there in large amounts (about 100 times the amount of CO2), such that an increase in water vapour due to an air temperature increase of, say, 25 K, has a negligible increase in feed back temperature increase. So there is no point in including a large feed back due to water vapour as a result of increase of CO2 – it does not exist.
I used to love all those photos of power stations showing smoke coming out of the chimneys, and also showing large plumes of something from the cooling towers. Look! How Dreadful!!!. Now we get beaut photos of nuclear power stations with the same plumes coming out of the cooling towers. Quite true, these are the ones emitting a greenhouse gas – water vapour.
Fossil fuel plants also emit water vapor in their combustion reactions:
CH4 + 2O2 —> CO2 + 2H2O.
Two water molecules per carbon dioxide molecule in the case of natural gas.
It seems the arse-covering has begun
I like to think of it as rats deserting a sinking ship, but hey, it’s all good.
Now then, who gets the job of telling Greta the good news?
How dare you!
Most reliable scientific models are subjected to rigorous validation feedback in order to achieve more accurate results. Where are the rigorous climate model validation studies and consequent feedback attempts to improve the models?
Instead, many climate modelers rush to produce ever more alarming results for a variety of non-scientific reasons.
The last three pages of the Terando, et al., report is a PLEASE DON’T FIRE US, even talk about the Bureau of Indian Affairs. Of course their last section is–
Ongoing Efforts by the U.S. Geological Survey to Improve Understanding
and Communication of Climate Science
Climate hyperboles have grown more hyperbolic.
scientists have scrambled to understand what went wrong and how to turn the models, which in other respects are more powerful and trustworthy than their predecessors, into useful guidance for policymakers. “
OK, learned savants, HOW DO YOU KNOW THEY’RE WRONG, and why weren’t those models fixed the minute that became clear? Where were the headlines announcing model exaggeration? Where were the apologies to the ‘denialists’ and ‘climate skeptics’? Why haven’t the fanatic protesters gone home?
But they’re more powerful and trustworthy!
From the Article: “Next month, after a yearlong delay because of the pandemic, the U.N. Intergovernmental Panel on Climate Change (IPCC) will begin to release its first major assessment of human-caused global warming since 2013. The report, the first part of which will appear on 9 August, will drop on a world that has starkly changed in 8 years, warming by more than 0.3°C to nearly 1.3°C above preindustrial levels.”
Wrong!
NASA Climate and NOAA say that the high temperature of 2016, was 1.0C warmer than the pre-industrial baseline.
The Earth is currently 0.6C cooler than 2016, so their 1.3C figure is way off-base.
Alarmists have it in their heads that it is warming, but it is actually cooling right now. The alarmists are living in the past.