Guest “climate sensitivity explaining by David Middleton
- ECS: Equilibrium Climate Sensitivity (AKA equilibrium sensitivity)
- TCR: Transient Climate Response (AKA transient sensitivity)
- AKA: Also Known As
Here’s how the folks a the Geophysical Fluid Dynamics Laboratory (GFDL) explain the difference:
Transient and Equilibrium Climate Sensitivity
Projections of the severity of anthropogenic climate change are strongly dependent on our estimates of climate sensitivity, traditionally defined as the global average warming at the Earth’s surface due to a doubling of the carbon dioxide from pre-industrial levels. This importance arises not because global temperature change directly causes all of the impacts of major concern, but because many effects of climate change are predicted to increase in severity with larger global warming.
An important distinction is made between the equilibrium sensitivity — the temperature change realized after allowing the climate system to equilibrate with a higher value of CO2 — and the response on shorter time scales, before the deep oceans have had time to equilibrate, that is of more direct relevance to the changes we are likely to see in the 21st century. The latter is often quantified by raising the carbon dioxide in a model at the rate of 1% per year and examining the response at the time when carbon dioxide concentration has doubled, referred to as the transient climate sensitivity or response. (At a rate of 1% per year, doubling requires 70 years.)
Equilibrium sensitivities in global climate models typically range from 2 to 5K, while the transient climate responses are smaller, in range of 1.0-2.5 K, due to the cooling influence of ocean heat uptake.
[…]
The ratio of transient to equilibrium sensitivity varies from 1/3 to 1/2 in this group of GFDL models indicating significant variation of the transient cooling influence of the ocean. The relationship of the ocean’s cooling influence to ocean heat uptake and circulation changes has been an ongoing thread of GFDL research. For example, He et al (2017) noted that stronger deep ocean circulation prior to forcing reduced the magnitude of transient warming in a GFDL model.
Cloud feedbacks are widely considered to contribute the largest uncertainty to climate sensitivity. Simulated climate sensitivity varies considerably with choices made about cloud parameterizations that are not well constrained by observations (Zhao et al 2016). Simulated cloud responses depend on the pattern of surface temperature change, not just its global magnitude (Silvers et al 2018). Because of the importance and complexity of the interactions of clouds and climate GFDL is focusing effort on a cloud climate initiative.
[…]
GFDL
Here’s a graphical illustration from IPCC TAR, 2001:

- IPCC: Intergovernmental Panel on Climate Change
- TAR: Third Assessment Report
TCR occurs simultaneously with the rise in atmospheric CO2. While, the difference between ECS and TCR occurs over the next several hundred years.
I am not claiming that this is correct or empirically verifiable. I’m just explaining the concept. These are the sensitivities of the GFDL climate models:
| Model | Transient Climate Response | Equilibrium Climate Sensitivity |
|---|---|---|
| CM2.1 | 1.5 K (Randall et al 2007) | 3.4 K (Stouffer et al 2006) |
| ESM2M | 1.3 K (Flato et al 2013) | 3.3 K (Paynter et al 2018) |
| ESM2G | 1.1 K (Flato et al 2013) | 3.3 K (Krasting et al 2018) |
| CM3 | 2.0 K (Flato et al 2013) | 4.8 K (Paynter et al 2018) |
| CM4 | 2.1 K (Winton et al submitted) | 5.0 K (Winton et al submitted) |
| ESM4 | 1.6 K (Dunne et al in prep) | 3.2 K (Dunne et al in prep) |
In the ESM4 model, the average temperature would rise 1.6 °C over a period of about 70 years as atmospheric CO2 and then another 1.6 °C over the subsequent 430 years. This doesn’t strike me as particularly catastrophic, considering that the first 1.0 °C or so has already occurred.
This brings me to the reason I wrote this post. Andy May’s post from yesterday featured this graph from Scafetta et al., 2017:

A couple of commentators posted rebuttals of the decline in climate sensitivities featuring this graph from Carbon Brief:

I think, but I’m not certain, that the climate sensitivities in the Scafetta paper were all based on instrumental data (observations). The climate sensitivities in the Carbon Brief article were derived by multiple different methods:
- Models (GIGO (Garbage In Garbage Out))
- Constrained models (higher quality GIGO)
- Instrumental (actual observations)
- Paleo (reconstructions of past climate based on proxies)
- Combined approaches (whatever)
The author, Zeke Hausfather, very kindly provided a link to the Excel file in the article. I downloaded the Excel file and plotted only the instrumental estimates of ECS, the real data.
| ECS study | year | min | max | ECS mean |
| Harvey and Kaufmann 2002 | 2002 | 1.0 | 3.0 | 2.0 |
| Gregory et al. 2002 | 2002 | 1.6 | 10.0 | 2.1 |
| Kaufmann and Stern 2002 | 2002 | 2.0 | 2.8 | 2.6 |
| Knutti et al. 2002 | 2002 | 2.0 | 9.2 | 4.8 |
| Frame et al. 2005 | 2005 | 1.2 | 5.2 | 2.3 |
| Tsushima et al. 2005 | 2005 | 3.1 | 4.7 | 3.8 |
| Forster and Gregory 2006 | 2006 | 1.0 | 4.1 | 1.6 |
| Forest et al. 2006 | 2006 | 2.1 | 8.9 | 4.1 |
| Stern et al. 2006 | 2006 | 4.4 | 4.5 | 4.4 |
| Chylek et al. 2007 | 2007 | 1.1 | 1.8 | 1.6 |
| Schwartz 2007 | 2007 | 0.9 | 2.9 | 1.9 |
| Lindzen and Choi 2009 | 2009 | 0.4 | 0.5 | 0.5 |
| Murphy et al. 2009 | 2009 | 0.9 | 10.0 | 3.0 |
| Lin et al. 2010 | 2010 | 2.8 | 3.7 | 3.1 |
| Lindzen and Choi 2011 | 2011 | 0.5 | 1.1 | 0.7 |
| Aldrin et al. 2012 | 2012 | 1.2 | 3.5 | 2.0 |
| Schwartz 2012 | 2012 | 1.5 | 6.0 | 3.0 |
| Lewis 2013 | 2013 | 1.0 | 3.0 | 1.6 |
| Otto et al. 2013 | 2013 | 0.9 | 5.0 | 1.9 |
| Bengtsson and Schwartz 2013 | 2013 | 1.5 | 2.5 | 2.0 |
| Otto et al. 2013 | 2013 | 1.2 | 3.9 | 2.0 |
| Skeie et al. 2014 | 2014 | 0.9 | 3.2 | 1.8 |
| Loehle 2014 | 2014 | 1.8 | 2.3 | 2.0 |
| Lewis 2014 | 2014 | 1.2 | 4.5 | 2.2 |
| Kummer and Dessler 2014 | 2014 | 1.6 | 4.1 | 2.3 |
| Lovejoy 2014 | 2014 | 2.5 | 3.7 | 3.1 |
| Donohoe et al. 2014 | 2014 | 3.1 | 3.2 | 3.1 |
| Urban et al. 2014 | 2014 | 2.1 | 4.6 | 3.1 |
| Monckton et al. 2015 | 2015 | 0.8 | 1.3 | 1.0 |
| Loehle 2015 | 2015 | 1.5 | 1.6 | 1.5 |
| Lewis and Curry 2015 | 2015 | 1.1 | 4.1 | 1.6 |
| Cawley et al. 2015 | 2015 | 1.8 | 4.4 | 2.0 |
| Johansson et al. 2015 | 2015 | 2.0 | 3.2 | 2.5 |
| Johansson et al. 2015 | 2015 | 1.6 | 7.8 | 3.1 |
| Bates 2016 | 2016 | 1.0 | 1.1 | 1.0 |
| Lewis 2016 | 2016 | 0.7 | 3.2 | 1.7 |
| Loeb et al. 2016 | 2016 | 0.8 | 10.0 | 2.0 |
| Forster 2016 | 2016 | 1.1 | 5.3 | 3.0 |
| Armour 2017 | 2017 | 1.7 | 7.1 | 2.9 |
| Lewis and Curry 2018 | 2018 | 1.2 | 3.1 | 1.8 |
| Average | 2.3 | |||
| σ | 0.9 | |||
| -2σ | 0.4 | |||
| +2σ | 4.2 |
The average ECS was 2.3 °C. This would translate to a TCR of 1.2-1.6 °C.
Then I graphed it up two ways:
- A stock chart, similar to a candlestick plot.
- A simple scatter plot.

Multiple estimates published in the same year is why several years appear multiple times.

We can clearly see that ECS estimates derived from instrumental observations have indeed declined from around 3.0 °C in 2001 to around 2.0 °C in 2018.
Scatter plots of the other methods demonstrate that the problem is models, “all the way down”…

Paleo methods produce a higher sensitivity because, almost invariably, the CO2 proxies are of much lower resolution than the temperature proxies. This is particularly true of ice core data.
Thank you Dave.
Without going in to their comments about water vapour effects on atmospheric temperatures and dealing with the saturation of the ability of CO2 to change temperatures,up or down somewhat from the present temperature, what do you derive from the van Wijngaarden & Happer preprint released in mid-2020?
Surely if CO2 is saturated with respect to it being unaffected by more infra-red, or leess infra-red, there is no significant way for it to change atmospheric temperatures of itself, so climate sensitivity is now either zero, or in need of re-definition? Geoff S
Agree it appears that the logarithmic nature or saturation ofCO2 warming is most often missing from these calculations, as explained so elegantly by William Happer in this video.
Figure 1 is clearly illustrating this error as 4 times CO2 gives twice the warming.
Very interesting. Too bad Trump didn’t appoint him to a scientific panel to bring some real scientific light to the general public. Small point – one would expect the moderator would know that Princeton University is in Princeton, New Jersey, not “in Pennsylvania”. The Ivy League school in Pennsylvania is the University of Pennsylvania, in Philadelphia.
Also, Fig. 1 lower right says calculations based on 1% per year increase of CO2. The Keeling curve for the last 20 years shows the increase is only about 0.56% per year, so that error alone rings alarm bells louder than warranted.
Yep. That’s the standard… It didn’t even occur to me to criticize it.
I haven’t read it. But, earlier efforts to assert 100% CO2 of the IR bandwidths have been refuted.
The purpose of this post was simply to explain the concepts and demonstrate the general validity of the Scafetta plot.
Here is a piece that links to the preprint:
https://www.cfact.org/2020/09/26/study-suggests-no-more-co2-warming/
The breakthrough is line by line spectral analysis. Better than bands.
“demonstrate the general validity of the Scafetta plot.”
“the climate sensitivities in the Scafetta paper were all based on instrumental data”
The first study I checked, Schwartz 2012, said: “using observationally based data and output of current global climate models (GCMs)”.
Did Scafetti just made this schist up by cherry-pruning?
I think you’ve done a good job separating out Knutti’s observationals but all you’ve really shown is that, given certain temperatures and CO2 levels, ECS *may* be closer to 2C than 3. We’re probably already half way there so I’m guessing closer to 3C than 2.
Sorry, reading it through I’ve unintentionally misquoted your meaning.
What I should have quoted: “…I’m not certain, that the climate sensitivities in the Scafetta paper were all based on instrumental data
”Btw, there is as much evidence for CO2 caused global warming as CO2 caused global greening. It’s warmed, it’s greened, you wants one you gotta has the other.”
How the hell do you expect to be taken seriously? Seriously!
“so I’m guessing”
ie you are making wild, anti-science, unsupportable mantra fantasy conjectures….
….. based on NOTHING except your utter cluelessness of any science whatsoever.
Do you have any actually real scientific evidence that atmospheric CO2 causes any warming at all ??
Or are you just going to keep up your mindless, non-science, regurgitated nonsense.
All of these calculations rely on vague correlations between atmospheric CO2 and temperatures.
They ASSUME that CO2 causes the temperature
But that has NEVER been proven or measured.
The opposite causation, that warmer oceans release CO2, is proven.
They should be looking at the “sensitivity” the other way around.
Thank you Fred.
I recommend Ed Berry’s new book
“Climate Miracle: There is no climate crisis Nature controls climate”
https://www.amazon.ca/Climate-Miracle-climate-crisis-controls-ebook/dp/B08LCD1YC3/
My review:
An excellent, readable book that destroys the scary global warming / climate hypothesis.
Reviewed in Canada on November 11, 2020
Verified Purchase
Author Dr. Edwin Berry demolishes the IPCC’s very-scary catastrophic man-made global warming hypothesis. Ed proves from basic principles that the growth of CO2 in the atmosphere is primarily natural, not man-made. Berry’s analysis is consistent with my 2008 publication that atmospheric CO2 cannot significantly drive temperature, because changes in CO2 lag temperature changes in the modern data record, as they do in the longer-term ice core record. Kuo et al (1990) and Keeling (1995) made similar observations in the journal Nature, but have been studiously ignored by global warming propagandists. “The future cannot cause the past.”
Let’s assume that nature primarily drives temperature and hence atmospheric CO2 concentrations. CO2’s concentration today is increasing at levels lower than would expected based on anthropogenic emissions alone.
I’m having trouble reconciling this. It likely has something to do with increasing productivity of the biosphere, i.e. all things are not equal. Otherwise, it would appear that CO2 would be falling without mankind’s contributions and, therefore, either temperature is falling or the initial assumption is not true. (Henry’s law is true.)
The what you are looking for is The Conservation Equation. Take a look at Dr. Murry Salby’s lecture of July 2016 University College London England. See what you think.
“Ed proves from basic principles that the growth of CO2 in the atmosphere is primarily natural, not man-made”
And Salby’s tripe is even more laughable. You guys are still actually denying the CO2 is ours? FFS. Where did ours go?
This nonsense is soo crazy it doesn’t even make crazy Roy Spencer’s craziest top ten and Roy is no alarmist…
https://www.drroyspencer.com/2014/04/skeptical-arguments-that-dont-hold-water/
But where is May? Where is Middleton? Where is Eschenbach? Where are all the so-called skeptics? Tacit agreement? Or just letting the water muddy where you can?
Loydo, I do NOT think that the CO2 growth is primarily natural. I think it’s man made. I also think the increased CO2 doesn’t affect things much except for the greening of the planet. See Gavin’s Falsifiable Science.
w.
I don’t really care where the extra CO2 is coming from..
SO LONG AS IT GETS COMING !!
With China and friends continuing to build Coal fire power stations at a great rate,
…emissions will continue to increase,
and there will be more and more CARBON in the CARBON CYCLE ..
…that all life on this CARBON-BASED Earth of ours depends on for its very existence.
(I suspect we gave the carbon cycle a kick with our CO2 emissions, and it woke up, also increasing the natural release of CO2)
And if so.. THAT IS A VERY GOOD THING !!
Thankyou for responding.
Yes, despite crank claims to the contrary, carbon consumption and emission numbers and their contribution to atmospheric concentrations are well known. Since you mentioned your hypothesis, I agree, the effects increasing CO2 and the risk of those effects are of course subject to uncertainty and debate, however the uncertainty reduces each decade energy content makes a further abrupt rise, when by rights neoglaciation should see us gradually falling.
Btw, there is as much evidence for CO2 caused global warming as CO2 caused global greening. It’s warmed, it’s greened, you wants one you gotta has the other.
So sad that loy-dumb doesn’t have the intelligence to comprehend Salby.
Salby has several magnitudes more scientific nous than loy-dumb will ever have.
Poor confused little loy. !
“there is as much evidence for CO2 caused global warming ”
Poor Loy-dumb….. LYING through your teeth, yet again.
Or just regurgitating your anti-science brain-hosed propaganda pap and nonsense.
Your continual YAPPING about it, is NOT evidence
You have never been able to ever produce one single piece of this FANTASY EVIDENCE of yours.
You remain TOTALLY EMPTY…
1… Do you have any empirical scientific evidence for warming by atmospheric CO2?
2… In what ways has the global climate changed in the last 50 years , that can be scientifically proven to be of human causation?
Slither and ooze away in your abject cowardice and ignorance, Loy.
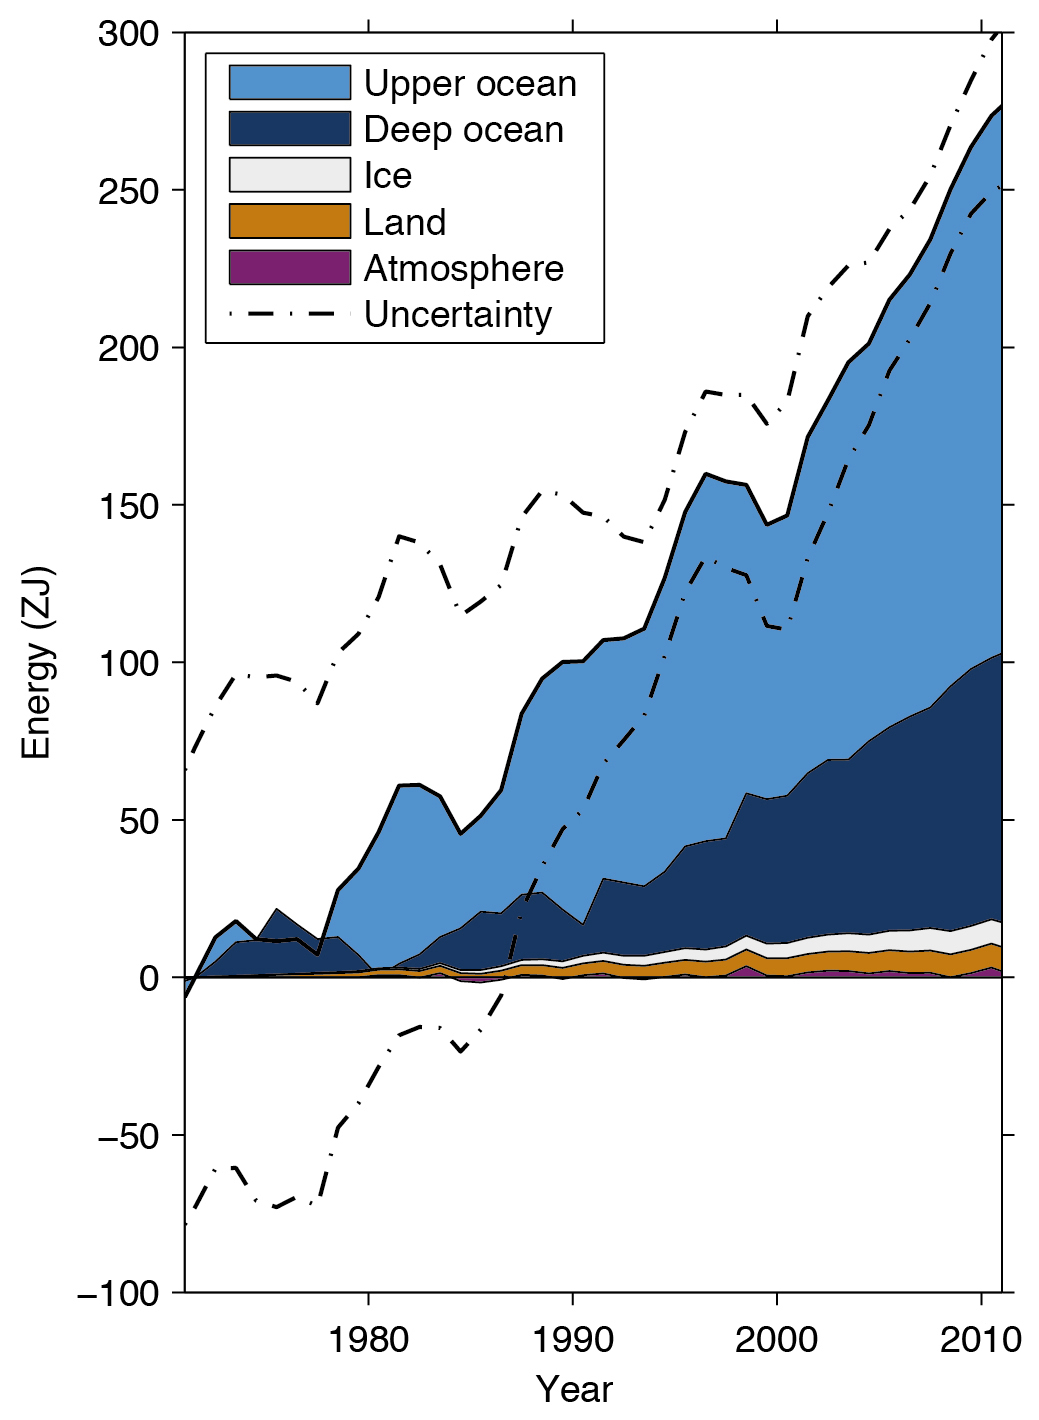
And loy yet again id STUNNED by big numbers
That little graph represents a TINY amount of ocean warming.
Thing is , he KNOWS that now, but still keeps posting it.
Can’t access images at the moment, but in the scheme of things it represents a TINY little squiggle after a highly beneficial warming out of the COLDEST period in 10,000 years..
The warming that SAVED THE PLANET from dropping down into a deep Ice Age.
Perhaps that is what Loy thinks would be desirable !
The STUPID from loy …burns like a beacon. !
The COVID shutdown reduced man’s emissions of CO2 by about 20%. Yet the growth of CO2 in the atmosphere then was almost EXACTLY what it was during preceding years.
What didn’t change was natural emissions. So much for Loydo’s propaganda, Willis’ “it’s man made”, and settled science.
I agree Scissor – Berry’s hypo is complicated, and somewhat counter-intuitive.
The world is a big place, and the carbon cycle is never in equilibrium – it chases gradients as they occur, all over the planet. Henry’s Law does work – but locally.
Note the people who contributed strongly to Berry’s paper: Ed Berry, Richard S Courtney, Will Happer, Murry Salby, Hermann Harde and others – I know most of them, and they are certainly among the most intelligent people on the planet. It would be foolish to dismiss their conclusion without doing the work and locating a fatal flaw – which I suggest none of the detractors have done.
It is too easy to shoot-from-the-hip and miss the target. Many years ago, someone called this remarkable relationship “spurious correlation”. It supports Berry’s hypo and is not spurious.
http://www.woodfortrees.org/plot/esrl-co2/from:1979/mean:12/derivative/plot/uah6/from:1979/scale:0.22/offset:0.14
Regards, Allan
Definitely, that plot is not spurious.
Nail on head, Fred.
The whole dispute about TCS and ECS has about as much grounding in physical reality as the arguments in the Middle Ages about how many angels could dance on the head of a pin.
Bingo! “How many climate scientists can dance on the head of Al Gore’s . . . ”
OK, that was crude – sue me.
Family-friendly version:
How many climastrologists can dance on Algore’s pinhead?
Al Gore – Climate Pin Head
Climactically insane
PS: The following comment is not a criticism of David Middleton who wrote an excellent summary of the subject, with good charts, for those who think it is an important subject. I just don’t believe the ECS and TCS guessing games are important. I wouldn’t want Mr. Middleman to think this is criticism, causing him to go berserk. You know how he “is”. Considering the batch of articles on this subject in the past few months — this one is the best. By the way, I happen to have an ECS number that I have been working on for 24 years. It has three decimal palaces — three decimal places is REAL SCIENCE — for some reason, it was not highlighted in the article?
Ditto Fred250:
I will add that all TCS and ECS numbers are wild guesses, and wild guesses don’t become more accurate if they are averaged, or displayed on a pretty chart. They have to be wild guesses because there are no global temperature data. The closest is UAH satellite data since 1979. Near global, little infilling, measured in a consistent environment, and measured where the greenhouse effect takes place. UAH has the potential to be accurate, especially because the scientists involved are not climate alarmists.
Temperature numbers before 1920 are almost entirely Northern Hemisphere, US and Europe.
Temperature numbers from 1920 to 1950 include too few Southern Hemisphere data.
Temperature numbers from 1940 to 1975, that once showed a -0.3 to -0.5 degree C. cooling, have been repeatedly “adjusted” to now show only -0.1 degree C. cooling, or a flat trend. there are hundreds of “adjustments” (revisions) every month !
Temperature numbers since 1979 (UAH) do show warming as CO2 rose, but surface numbers from 1940 to 1975 DO NOT show warming as CO2 levels rose. And there was a flat trend from 2003 to mid-2015 as CO2 levels rose rapidly. I’m assuming all that “bad news” for climate alarmists has not been “adjusted” away as I am typing this !
Sea surface “measurements” using buckets in shipping lanes are a bad joke, not real science: Wood buckets, canvas buckets, engine cooling water intakes, buoys, etc. are five different measurement methodologies. Have you ever seen an experiment where all five methodologies were used to measure the sea surface temperature in the same place, to find out exactly what changes in measurement methodologies did to the numbers. I’d like a URL, if anyone has one.
Temperature data before 1979
are not anywhere near accurate enough to use
for ECS and TCS guessing games:
(CO2 levels are accurate only after 1958)
Guess the ECS, win a prize !
Guess the TCS, win a prize !
Everyone is entitled to their own guess, I suppose.
We can average them and present them with two decimal places.
Hundredths of a degree C. is “real science”.
Tenths of a degree C. is malarkey, for losers.
You may be thinking we have to work with the temperature data we have.
No we don’t. The ECS and TCS guessing games are mathematical mass-turbation.
Sometimes the right answer is simple: — We don’t know TCS and ECS, and we can live happy lives if we never know!
End of ranting and raving, for now !
Mean Richard Greene,
This is excellent.
+1.5 to 4.5
Michael Moore (Nov. 14, 10:09am)
It took me a few minutes, about 125 of them, to realize what +1.5 to +4.5 meant.
Amazing that we have been hearing that range since 1979. Repetition is key to climate change propaganda. I prefer to say +3.0 degrees C. +/- 50 percent. My own TCS calculation has THREE decimal places, and is only +/- 0.001 percent. I have a 105 percent confidence level — way above 97 percent. Sorry that after 24 years of climate science reading, I have lost the ability to take climate change astrology seriously.
”Temperature data before 1979
are not anywhere near accurate enough to use
for ECS and TCS guessing games:
(CO2 levels are accurate only after 1958)”
Yeah but because we know co2 went up for the 40 years starting 1940 and the temps went down for the same period, they are accurate enough to say guessing the ECS is like guessing the second coming.
Yes indeed Fred250,
It all fell apart when people realized Callendar cherry picked his historical CO2 levels.
ECS and TCS are both what we call “confused concepts” in the logic of science. The confusion is between a prediction and an abstraction.
If they are predictions then they assume, as has been pointed out, that temperature is uniquely determined by CO2 level, which is known to be very false. Even the IPCC lists about ten different forcings, CO2 being just one.
If they are “all else being equal” abstractions then they are worthless because all else is very far from equal. In fact climate is a far from equilibrium system.
In reality they are abstractions treated as predictions, which is a deep confusion indeed.
Wohick
So, you are saying ECS and TCS are “confused” “worthless” “abstractions” !
You COMPLETELY FORGOT to mention that’s perfect for goobermint work.
Good posting, David. From your summary comment “…ECS estimates derived from instrumental observations have indeed declined from around 3 (deg) C in 2001 to around 2 (deg) C in 2018,” This appears to suggest that in 36 years after 2018 the ECS will be zero (0). So, in the year 2054 the Greenies and associated enablers will have to find another cause to advance socialism. I wonder what that cause will be?
“The author, Zeke Hausfather, very kindly provided a link to the Excel file in the article. I downloaded the Excel file and plotted only the instrumental estimates of ECS, the real data.”
instrumental estimates ALSO USE MODELS and data from models.
Typically energy balance models.
you fail.
hey how are covid cases in texas doing?
Thermometers rely on models. Pretty well all observations rely on models for measurements and characterization.
This doesn’t make models observations.
but all the observations show it is warming…
Define “observations” and “warming” the statement as it stands is layman stupid.
So what that warming is occurring?
There is no proof of cause. So far, all we have is proof of change, proof of more observations, proof of more interest in a subject. However, correlation is far from causation.
Griff, drink a different kool-aid from time to time, you’ll find less indigestion.
Griff,
How about elaborating on that fact. Like how it has been warming since the end of the little ice age long before CO2 was a “thing”. But we do not wish to muddy the narrative with facts, do we Griff?
Of course observations show that it is warming (slightly), griff. That’s why TCR estimates are positive (and small). This is why “climate crisis” predictions have little (or no) credibility.
I see that griff is still stuck on stupid.
Yes it is warming. The problem is that it was warming prior to the time when CO2 started rising.
It is up to you to PROVE that CO2 caused the warming. Models are not proof. Especially when the models predict much more warming than has actually occurred.
“but all the observations show it is warming…”
Observations that are NOT pure fabrications or twisted and tortured compilations of GIGO surface data…
…. show that warming has only happened around El Nino events
Local warming from Urban heat effects are evident in areas of expanding population
Furthermore, NH temperatures are similar to the 1940s in any actual real data,
Same in many places in the SH. Unadjusted temperature records show 1930s/40s probably warmer than current in South Africa
Some places show long periods of basically ZERO warming eg Japan 1950-1990 then a slight step again no warming from 1998-2018
There are NO REAL OBSERVATIONS that are consistent with warming by atmospheric CO2.
Do you have any empirical scientific evidence for warming by atmospheric CO2?
but all the observations show it is warming…
For how long, Griff?
Mosh just reads off the same cue cards pretending he’s a scientist. Can you imagine being at a party with this guy? Ughh.
I was once. Talked to him a lot. He’s actually alright in real life.
Had the pleasure of meeting Leif too at the same party.
Please stop you are both mixing terms and butchering science in the process.
Can I suggest you start by looking up Empirical Science which I suggest is what you are trying to describe but neither of you know the correct term. In Empirical research in hard science fields no models are allowed and only a limited set of statistics. The bar is set a lot lower in some ecology and biology fields because they would struggle under the stricter conditions.
https://en.wikipedia.org/wiki/Empirical_research
You can’t use strict Empirical Research with Climate Science because it fails a couple of the central tenets. The “causal relationship” would cause hi-jinx because of controls and the “look elsewhere effect” would certainly rule it out.
“Thermometers rely on models”
Also on “regional expectations” ! 😉
ie what the person doing the modelling wants the temperature to be.
especially true of Zeke horsefather. !
The more you homogenise, torture, and twist it to your expectations, the less information is left to do anything with….
…. until you get to the stage where surface FABRICATIONS like GISS, BEST et al are basically MEANINGLESS..
….. or in fact is WORSE than meaningless because they tell a FAKE, intentionally constructed story of climate.
Thermometers rely on very simple physical models that are empirically verified, as in calibration procedures. That is in contrast to extremely complex digital computer models that rely on the solution of partial differential equations that have to be approximated by algorithms, and replaced by parameterizations. It is the numerous assumptions and tuning of digital computer models that make ‘models’ problematic.
“hey how are covid cases in texas doing?”. Don’t mess with Texas, unless you are in a safe, dark location, like maybe under your bed? In your mothers basement?
” Don’t mess with Texas ” is an anti-littering slogan, not some macho thing: https://en.wikipedia.org/wiki/Don%27t_Mess_with_Texas
PS, Texas is the state with the highest number of COVID infections.
Hey I thought the election was over, why are you still talking about covid?
What’s the case fatality rate for covid in Texas?
bethan456@gmail.com, I spent a fair amount of time in Texas, especially going to charm schools for CONOCO, and have my own opinion about messing with Texas, and it does not have anything to do with the littering slogan. I also checked the data, before I commented, and Texas does have the most Covid infections. Guess what I’m thinking.
Texas has the highest number of COVID infections of any state in the USA: https://www.worldometers.info/coronavirus/country/us
.
Also:
bethan456,
“PS, Texas is the state with the highest number of COVID infections.”
Infections or cases?
There is a difference — infection implies a clinical assessment to confirm an infection. Cases are just the results of the flaky PCR test, a test known to be of dubious accuracy.
PS. Where does worldofmeters get it numbers from? Or should they really be called worldofguesstimates
TomOmason, examine the column labeled “Source” to see where the data comes from.
bethan:
Compared with NJ, the state with the highest deaths per million your point is what?
Texas is #22 in the Union for deaths/million, versus NJ at #1. The top 2 states for deaths/million in the Union are NJ and NY, the most deaths of which so far (33,975) are attributable to Governor “Dr. Death” Andrew “Senior Slayer” Cuomo, your typical loving, compassionate, defender of the weak and powerless (unless you happen to be 70+) progressive liberal.
Can you imagine how contrite Dr. Death must be feeling right now with his one state responsible for 13.5% of ALL deaths in 50?? Can you imagine?
https://tinyurl.com/y33dvcwq
Wait . . . I’m sorry . . . what was I thinking. It was Trump all along:
It’s also the state with the highest number of people.
It never ceases to amaze me how innumerate your average progressive is. (And wants to be.)
Mark W.
Excluding California.
No, Texas is the state with the highest number of positive tests for COVID. Finding someone who is actually ill with COVID is as rare as anywhere else. Most medical doctors have been screaming this information, literally thousands have signed documents to that effect. Many researchers are saying that the tests are at best 50% accurate art detecting something.
This is purely anecdotal, but two of my acquaintances who were worried about COVID went to get tested. They signed in, but after waiting 45 minutes to get tested, they gave up and went back to work. Three days later they were notified their tests came back positive. I reiterate this is anecdotal, and the two people are Kalifornia Democrats, so their veracity is really questionable.
Ron, cases don’t matter, 99.9% of the people recover. The number of cases is mostly due to the number of people tested. The death rate does matter. In Texas it is 68 people per 100,000 population, which places the state 21st. New Jersey is first with 186, New York second with 172, Massachusetts has 149. The complete list can be downloaded as a spreadsheet here:
https://andymaypetrophysicist.files.wordpress.com/2020/11/covid_death_rates.xlsx
Cases do matter, because death is not the only negative outcome from this virus. It can damage your lungs, your heart and other organs, leaving you with a newly acquired “preexisting condition.”
Tell that to China
Cases do matter, Mr. Maybe, not only deaths:
About 40 percent have no symptoms, or mild symptoms
About 60 percent have ordinary flue symptoms, or worse
with a far higher need for hospitals and ICU thamn ordinary influenza
About 0.1 percent will die, rarely under age 40.
That’s adds up to 100.1 percent
Of the five people I know who were COVID infected (determined by testing), two had very serious flu symptoms for 2 weeks, and 3 weeks , while the other three had loss of smell and taste only, and one of those was age 70 !
The friends very sick were in March. The three week patient was a sixty-something retired doctor. Her son, also a doctor, wanted to care for her at home, claiming his hospital was not treating the patents correctly (with ventilators). She survived the worst three weeks of her life, and then her son got sick too … but with mild symptoms!
Another friend was very sick and tested positive for COVID. We told her we didn’t trust the tests. She got tested twice more and was negative both times. She WAS very sick with flu symptoms. She had ordinary seasonal influenza. Great to know how inaccurate the COVID 19 tests can be, and I wonder about the statistics for COVID infections !
Too the extent it’s relevant to the subject… Cases and deaths are only relevant when normalized for population.


>96% of Texans have not tested positive. 98% of those testing positive have died.
Apart from having to wear a mask in stores, restaurants and other businesses, I’m now free to do just about everything I was doing prior to the ChiCom-19 hostage crisis, including working in the office.
I think the odds of me dying in an auto accident on the way to and from stores, restaurants and the office are just a little higher than the 0.08% chance of dying from ChiCom-19.
” 98% of those testing positive have died. ”
..
You are full of shit.
Might be a typo.
Definitely a typo. Should have been, “have not died.”
Another way of looking at Texas is that of the 29M population, 4% have tested positive, leaving 27.8M susceptible to infection. If half of the catch the virus 14M will get sick, and at a 2% fatality rate Texas is facing about 278,000 more deaths.
By 2030… Assuming no effective vaccines or treatments become available.
No Middleton, you are mathematically clueless. Your claim of 2030 is bogus. Texas is currently experiencing over 10,000 new cases per day. That’s 3.6M per year and will hit 14M infections in 3.8 years (2024.)
…
That assumes we continue at the current rate of infection which is not a sound assumption. It has been rising since October 6th.
…
Treatments have lowered the fatality rate significantly since this thing hit, but widespread vaccinations won’t be happening until Q2 of 2021.
…
But you don’t have to worry, Texas has plenty of space available to bury the dead.
David,
In 2019 there were 3610 fatalities in Texas due to auto accidents. This year so far there has been over 20 000 fatalities due to COVID (with another 200 or so every day). Thus your chances of dying in a car accident are considerably lower than your chances of dying from COVID.
Due to going to work?
Speaking of failures, hey how’s that lying thing coming along?
https://twitter.com/BradPKeyes/status/1261806031560036352
Is there a mask for that?
Steven, Instrumental estimates use observational data and then model the measurements. The model estimates that David is referring to use made-up-sh*t, excuse me, I mean “adjustable parameters,” to derived their ECS and TCS. I think you know that and are just trying hard to be contrary.
Once again for the clueless, just because some models are worthless, is not evidence that all models are useless.
Just because some models are useful, is not evidence that all models are uselful.
Demonstrating that the models used to build thermometers are useful, does not prove that the GCMs are perfect and can’t be questioned, no matter how much steve is paid to say otherwise.
MorkW
I think you’re described climate “models” perfectly:
“clueless”
“worthless”
“useless”
Thermometers are not models, nor do they rely on them. They are proxies that respond in the same was as what they are proxies for. If mercury in a tube rises to a certain level when in water that’s beginning to boil, it is not modeling anything; it is just a proxy (substitute) for showing the energy of water boiling. It does not model the water at all. It does not model anything.
Thermometers rely on models to translate what they actually measure into temperature values.
Models are essential tools… But they aren’t observations.
“you fail.”
Poor mosh, your WHOLE LIFE is one big FAILURE
Pretend scientist. FAILED at that…
From your writing, .. a FAILED literary student
Frontman for a group of pseudo-scientific con-men.
Credibility and integrity in the sewer…
So SAD that you chose to be such a FAILURE.
The inane comment of the day by Mosher.
Since he knows David is right, he turns the discussion about his excellent article on climate sensitivity into a COVID fight.
David has put Reto Knutti to shame, but you put yourself to shame without any help.
Group A and Group B. We can do that. Semantics. Boring.
I am waiting for a response to Geoff Sherrington because he has expressed my thoughts almost exactly. I expect that Wijngaarden & Happer will be crawled over by hundreds of PhDs fearful for their jobs. That is somethingW&H would have expected so they would have been extra careful to check their process. If they are right it will mean, after some delay and the inevitable backlash, the disbandment of the useless and corrupt IPCC, the abandonment of most wind and solar and the spending of most of the money released (e.g. $80 trillion for the Paris Agreement) on useful things. The Chinese will be very angry and the Unenvironmental NGOs like Greenpeace, WWF, FOE etc will be saturated in dispair. The four horsemen of the apocalypse, BBC, Guardian, CNN and NYT will lay in pools of tears but learn nothing. All good news then. So, how is Wijngaarden & Happer?
I am reminded of previous environmental disasters (not) such as Saccharin, Dioxin, Agent Orange, Nitrites, Love Canal, Asbestos, Alar, PCBs, Acid Rain, DDT, CFCs, Ozone Depletion, Superfunds, Cranberries. They all went away eventually when the superilliterate journalists and activists got bored and lost arguments.
I am thinking of buying a disused windmill to grind corn. That would be nice.
Nobody’s going with a drop, due to a grand solar minimum?
That ‘carbon’ must be magical…
I have reproduced the Radiative Forcing (RF) values for CO2. The result was 2.12 W/m2 for 2*CO2 when Myhre et al. have reported 3.71 W/m2. The Climate Sensitivity Parameter (CSP or lambda) is according to my studies 0.27 K/(W/m2) when the IPCC uses 0.5 K//W/m2), Therefore, my TCR value is 0.6 C.
https://www.climatexam.com/single-post/2015/01/27/climate-sensitivity-06-degrees-calculated-by-three-different-methods
That’s a very reasonable estimate.
So to be clear you are saying that there are in fact two (2) different specific heat, Cp, of dry air or CO2 depending on whether IR is involved in the energy input?
Are you also saying that if I heat a quantity of dry air without IR involved that the temperature could be up to 33 C less than if IR is involved with the same joule input and the same quantity?
Lastly, are you saying that thermodynamics is wrong in the statement that the energy can be in “any form”?
This something I’ve been studying. It seems the folks involved in AGW delve into radiation only. They ignore the effect that conduction has on thermometers measuring the air temps at 3m. Most will simply not admit that conduction has any relativity to measured air surface temperature.
I am not sure what did you mean by your comment. I have more than one empirical evidence that there is no positive water feedback system in the atmosphere. During the period from 1982 to 2002, the temperature increased but the absolute water amount (absolute humidity) decreased. That is enough. It means that the climate sensitivity parameter value is only 0.27 and not 0.5 K/(W/m2) as applied by IPCC.
My latest simulation shows that the model calculated temperature value after 2014 is very close to the observed temperature by using value 0.27 but the error is huge by applying 0.5 for the shortwave radiation anomaly.
Antero, I also have my doubts that TPW (total water vapor) increases with temperature and relative humidity stays constant. The data seems to contradict this common assumption. Thanks for your post, it is very good.
Antero, I think they are understandable questions, but let me try again.
For dry air or CO2 at a specified temperature do you think there are two Cp’s depending on whether IR is present in the input?
If I have two separate but equal masses of dry air and one is heated without IR and one is heated by the same amount with IR will the without mass be colder?
Thermodynamics says that he energy required to cause a temperature increase can be in “any form”. Is thermodynamics wrong!
Arterial O.
If there was really a water vapor positive feedback, then the high levels of CO2 in the air in most of earth’s history would have cause runaway global warming, and none of would be alive today to debate runaway global warming. The only life left on our planet would be amoebas and ants. Nothing can get rid of ants.
Disagree
Borax and icing sugar took care of my ants.
My aunt is another matter
I have no complaint with your math. I just wish to point out that it is n “all other things being equal” estimate.
It is my belief, backed up by lots of data, that the world is dominated by negative feedbacks. As a result, the actual TCS will end up being lower than the “all other things being equal” TCS.
I’ve been saying 0.3 to 0.5C for years.
Given the huge sensitivity ranges on offer for all sorts of reasons from many different studies, all from countless highly-qualified experts, isn’t it anti-scientific (not to mention utterly laughable) for anyone to declare ‘the science is settled’?
That, which is close to being the same that something must be true because any overwhelming proportion of scientists believe it to be true, is as unscientific as it can get.
Perfect.
Sorry to go off topic but Biden is considering Wind Scammer, Angus King as Director of National Intelligence.
https://www.centralmaine.com/2020/11/13/biden-reportedly-considering-sen-angus-king-for-top-intelligence-post/
This is a truly excellent ‘guest explaining’ David, you’ll be accused of sensitivitysplaining for sure.
Just a few quick questions came to my mind when I loked at that TAR figure:
– what is year zero in Figure 1. ECS vs TCR (IPCC AR1, 2001)
– and how does this graph compares to “we had about 1K warming in the last 150 years”?
– did they compress the timeline somewhat to overstate the cause? (also if you give the ocean more time more CO2 will be removed from the biosphere-a 4x280ppm level of atmospheric CO2 seems doubtful)
(and I am not criticizing your article which is clear and great.. just came up with questions looking at that graph.. it seems “unreal”!?)
There’s this quote from above:
“…before the deep oceans have had time to equilibrate…”
The IPCC’s AR4 Chapter 5 page 387
Observations: Oceanic Climate Change and Sea Level
It says in the first two sentences of the Executive Summary:
Really? Over a period of 42 years they have observed the oceans to rise in temperature not 0.11 or 0.09, but 0.10°C. Who believes this stuff?
Well 700 meters, that’s down to the Thermocline. Regarding “the deep oceans”, is that below the thermocline? You read some of this non-sense, and it’s hard to say what they are talking about.
None of the ocean probes are capable of measuring temperatures to 0.1C, much less 0.01C.
Climate science is the only field in which you can take hundreds of probes, measuring hundreds of different places and proclaim an accuracy greater than any of the probes being used.
And that’s only one of the minor flaws in climate “science.” 😎
Probes, PROBES We don’t need no stinkin’ PROBES !
For some surface grids in Africa, NASA-GISS has no thermometers at all, yet wild guesses the temperature in those grids, and sometimes proclaims their wild guess was a new record (higher than their previous wild guesse). This is REAL science. Probes are for losers. Just make up the numbers.
and sometimes proclaims their wild guess was a new record (higher than their previous wild guesse).
And rumors have it that Michael Mann is likely to be Climate Czar.
Not to harp on the obvious, but doesn’t the Antarctic ice core data and the Happer spectral analysis already prove there is no climate sensitivity to an increase in CO2?
You can’t oppose climate hysteria by playing the game by their stack-against-you rules.
The article earlier this week on how El Nino-La Nina function as a heat removal system is useful science. Another article on Climate sensitivity is just spinning wheels.
Thomas Gasloli November 14, 2020 at 6:26 am
Or in other words, stop buying in to their bullshit.
The slope of the line in Figure 5 is -0.063 with a standard deviation of 0.031. At the 2-sigma level, the slope cannot be differentiated from no slope at all. In other words, the correlation is not strong.
None of the correlations are “strong.”
David,
Yes, an R^2 of 0.0456 means that only 4.6% of the variance in the dependent variable (climate sensitivity) can be explained by the independent variable (date).
No, so ECS could still be closer to 3C than 2. No so-called GIGO models required.
Given that there is NO EVIDENCE for warming by atmospheric CO2 (as you continually show)
….. the nonsense hypothetical values are meaningless.
Eventually people will realise that the value is ZERO. !!
“Science” says that CO2 does NOT contribute anything to the beneficial warming of the atmosphere,
Oh, I forgot.. real “science” means NOTHING to you, does it Loy.
1… Do you have any empirical scientific evidence for warming by atmospheric CO2?
2… In what ways has the global climate changed in the last 50 years , that can be scientifically proven to be of human causation?
Keep running away, avoiding the questions.. Its all you can do.
The ECS from instrumental estimates could be anywhere from 0 to 4. The mean is about 2. The P50 or median is the most likely value and would be less than the mean. The most likely TCR would be 1/2 to 2/3 of the P50 of the ECS.
Estimates of climate sensitivity constitute such a wide range that they are meaningless. These values are obtained from the climate models that are claimed to be of no predictive value due to the high uncertainty that swamps any warming signal caused by CO2 which, according to Happer and Wijngaarden is now of no importance due to the total saturation of the absorption bands.
I guess that just about sums up the current state of climate science.
Climate scientists, government advisors and politicians and policymakers just carry on as normal, as do the news media, proving that science has no relevance to the ongoing fiasco of climate change.
My thanks to Mr. Middleton for this post.
Although I do not have the knowledgeable of contributors such as Mr. Middleton, I do contribute letters to the local paper and find WUWT to be a valuable source of knowledge. Every assumed familiarity with “common terminology” or unanswered question is a lost opportunity to spread knowledge to a wider audience. IMHO, contributors and commenters should spend fewer words speaking to each other, and spend more time and effort speaking to a wider audience. Mr Middleton’s contribution to that goal is appreciated.
Thanks David, great post!
Shouldn’t this be filed under examples of Feynman’s Cargo Cult Science? I remember reading in his book about Millikan measuring the charge of an electron. He was slightly off. After his experiment, every measurement was slightly higher than the last. Feynman asks – “why didn’t they discover that the new number was higher right away?” Feynman goes on – “When they got a number that was too high above Millikan’s, they they thought something must be wrong, and they would look for and find a reason why something must be wrong.” Feynman finally says – “The first principle is that you must not fool yourself — and you are the easiest person to fool.”
Now, consider climate modeling for what it is – curve-fitting rather poor historical climate data. If you are doing the modeling, and your computer run doesn’t come out where the consensus says it should come out, you “look for and find a reason why something must be wrong.” Tweak the independent variables a bit and re-run the model.
As I said, Feynman’s excellent book “Classic Feynman” describes this Cargo Cult Science beautifully.
@Dave – excellent intro!
LOL (Laughing Out Loud).
Eventually this sensitivity will decline close to zero. Water will see to that in conjunction with the other factors which have been ignored in the climate models. When these other factors then produce negative sensitivity results from the correct revised models; then there will be embarrassment around and a great deal of Cognitive Dissonance .
Zeke’s list is pure Cherry picking. Here is some of what’s missing which would change every graph and trend.
https://notrickszone.com/50-papers-low-sensitivity/
It’s up to 120 papers now.
The most serious problem was lumping all of the methods together. It’s like using the spaghetti plot of climate reconstructions with the instrumental data tacked on to claim that Mann’s hockey stick is valid.
Steven Mosher November 14, 2020 at 3:06 am
Steve, your comments, although as always too short, are also as always interesting. And while you are right, you are also wrong.
You are right that all of our descriptions of the real world are models. For example:
are all models.
Thermometers are also models, of the form ∆T ≈ ∆L, where T is temperature and L is the observable length of mercury in the tube.
Finally, global climate models like the GISS-E or CCSM3 models are models as well.
However, while those are all models, your sneering at the quote assumes that somehow all models are the same, so there’s no difference between observation-based estimates and model-based estimates … not true.
In particular, there is a huge division in the world of models between “iterative” and “non-iterative” models.
Non-iterative models get calculated one time. We take a mass M and a force F and we use the model F = M A to calculate the acceleration A.
Iterative models, on the other hand, make a calculation. Then the output from that calculation is used as input to to the model for the next calculation. This process is repeated over and over. Each calculation is often considered as a time step.
E = M C2 and thermometers are non-iterative models.
The climate models GISS-E and CCSM3, on the other hand, are iterative models. There are many differences between iterative and non-iterative models.
• Iterative models are really hard to test. You can test F = M A easily, it’s high school physics. Testing the output of the CCSM3 is infinitely more difficult. For example, as far as I know nobody has ever shown that the particular form of the Navier-Stokes equations used in the climate models actually converges to the right answer …
• Iterative models are predictive in nature. Non-iterative models deal with the present time.
• Iterative models are often unstable and require special handling to keep them from cratering. This is because any erroneous output immediately becomes input, so a given error can often compound with disastrous results.
• It is possible, even common, that an iterative model can get the right answer using the wrong method. And it can be very difficult to diagnose that because how an iterative model gets to its endpoint is not visible. As an example, an iterative stock market model that is successful in hindcasting up to the present often fails miserably to predict the future. Why can’t it forecast? You can’t tell. How do I know? Been there … tried that.
• The two model types have very different underlying strategies. Iterative models work by dividing the problem into tiny, tiny pieces. The theoretical physics-constrained and/or parameter-constrained trajectory of each piece is calculated at each timestep. Then the final state of the tiny pieces is averaged to produce an output. Non-iterative models look instead at the whole problem and solve it in one go.
As a result, it’s not meaningful to conflate the two very different types of models as you do when you say:
Yeah … so do thermometers. But that doesn’t mean that CCSM3 = thermometers.
Finally, you say:
How is this moving the conversation forward?
My best to you and yours, stay well,
w.
Well said, Willis.
Thanks, David.
w.
I don’t think iteration is the problem. To the extent that CS is measured in the time domain any estimate relies on moving from state t0 to state t1.
The issue is complexity and ability to verify the model and estimate uncertainties. The ’empirical’ estimates are better because they are more transparent (e.g. critical parameters are being directly measured, rather than heavily processed) and when assessed the assumptions seem reasonable.
The claim will be that GCMs give a better characterisation of the climate through its complexity compared with simple energy balance models. The problem is that this isn’t ‘obvious’, particularly when looking at its behaviour on a limited feature (CS) over the instrumental period, so Occam’s razor applies.
The models in one case are a white box (Stevenson Screen), and in the other, a black box.
Nope
“Steve, your comments, although as always too short, are also as always interesting. And while you are right, you are also wrong.”
Dave tried to characterize “observation ” based estimates as “REAL” data.
they are not.
All estimates of ECS depend upon models and yes even observations depend upon models
So the characterization that ONE is REAL data and other are not, is baseless.
None of what you say changes that.
ONE reason it is so hard to take different approaches
— paleo which uses models
— “instrumental– which rises models
— GCM– which uses models
is that there is no clear way how to QUANTITATIVELY combine them into a meaningful
PDF.
So you are left with a RANGE of values from various different systematic approaches,
none of which are comparable in any straightforward way, except to plot them all
the WORST way to “combine them” is to selectively plot them versus time and call one “real”
There is likely some irreducible uncertainty here. that’s life and decisions will be made by policy makers
in spite of this uncertainty and they wont regard blog posts.
All observations depend on models for measurement, quantification, characterization, etc. However, the observations are real data. Models are not observations or real data; they are essential tools.
The BEST way to combine them is with “regional expectations”, right mosh 😉
Better yet…. find a big circular BIN , then take pot-shots !!
It is very useful to get all these estimates together. The reality is that we are getting a lot of very low ECS estimates based on observation and a lot of very high ECS estimates from the models. This dramatic divergence is a crisis in my view:
https://www.cfact.org/2020/10/20/crisis-looms-in-alarmist-climate-science/
Of course in real science observation would falsify the models, but this is climate sciences where models rule. The IPCC AR6 is going to recognize the newly hot models and ignore the observation based low ECS estimates. ECS is going up.
It’s akin to drilling a dry hole and claiming that it wasn’t a dry hole because the pre-drill seismic interpretation and models were superior to the observations ( the well logs from the dry hole).
Or just saying the hole is anomalous. Kuhn talked about this, so I call it Paradigm Protection. There has got to be something wrong with that hole.
Given that we are over 40% of the way to doubling CO2, we ought to be able to estimate TCS and ECS fairly well (if they are real). Like the monks of old, the IPCC prefers scripture, in the form of models. Don’t look in that horse’s mouth, lest ye be damned. And so we are.
There’s something seriously wrong with dry holes: no oil or gas… 😉
Wohick said:
“The IPCC AR6 is going to recognize the newly hot models … ”
I would avoid using the phrase “hot models” in a climate science comment.
Either that, or post some pictures.
“very low ECS estimates based on observation”
Are you referring DM’s vague conclusion that observation based ECS *may* be closer to 2C than 3? No? then what low estimates?
ECS may well be above 3, it could be 4. That is the crisis, not some CFACT confectionery.
Loydo,
AR5 gives no best estimate of ECS.-
“No best estimate of Equilibrium Climate Sensitivity can now be given because of a lack of agreement on values across assessed lines of evidence and studies.”.
TAR and AR4 both gave 3C as the ‘best estimate” largely unchanged since Charney 1979 and the range of 1.5C to 4.5 C there given.
And you want to maintain that your best estimate is 3C to 4C.
Nope.
Read the latest post here,”The Paper that blew things up.”
The estimate is shrinking.
“ECS may well be above 3, it could be 4.”
Poor loy.. brain-hosing left nothing but fetid green mush
Do you have any actual evidence that it is anything but ZERO. !!
1… Do you have any empirical scientific evidence for warming by atmospheric CO2?
(assumption driven models are NOT evidence)
2… In what ways has the global climate changed in the last 50 years , that can be scientifically proven to be of human causation?
You keep making moronic propaganda twit statements that you KNOW you haven’t got the slightest bit of actual empirical evidence for.
Its a JOKE.. on you..
“That is the crisis,”
No Loy-dumb.. the “crisis” in AGW scammer circles, is that the coming cooling trend will point to the FACT that warming by atmospheric CO2 just DOESN’T HAPPEN
As you are well aware, there is NO EMPIRICAL EVIDENCE of warming by atmospheric CO2
It has NEVER been observed or Measured anywhere on the planet.
It is like a MYTH, .. a piece of non-science FANTASY.
If there was any evidence .. you could produce it, instead of your mindless prattle…
But you HAVEN’T ……. and you KNOW that you CAN’T !
Perhaps you would like to try … just once, to PRODUCE THE EVIDENCE….
1… Do you have any empirical scientific evidence for warming by atmospheric CO2?
2… In what ways has the global climate changed in the last 50 years , that can be scientifically proven to be of human causation?
One problem with all of this is that the radiometric greenhouse effect has not been observed in a real greenhouse, in the Earth’s atmosphere, or anywhere else in the solar system for that matter. The radiometric greenhouse effect is nothing but science fiction. But for those who still believe in it, please consider the following:
Radiametric calculations performed decades ago came up with a climate sensitivity for CO2, not including any feedbacks, of 1.2 degrees C. Based on temperature data since 1850, Moncton’s group found that if all the warming since 1850 were caused by increases in CO2, the climate sensitivity of CO2 including feedbacks cannot be more than 1.2 degrees C. A researcher from Japan, pointed out that these initial calculations failed to include the fact that a doubling of CO2 will cause a slight decrease in the dry lapse rate in the troposphere, which is a cooling effect. This decrease in the dry lapse rate decreases the climate sensitivity of CO2 by more than a factor of 20, from 1.2 degrees C to less than 0.06 degrees C.
Then there is the issue of H2O feedback. According to the AGW conjecture, H2O will cause more H2O to enter the atmosphere which causes more warming because H2O is such a strong greenhouse gas. H2O based heating causes even more H2O to enter the atmosphere which causes even more warming and so forth. But the AGW conjecture completely ignores the fact that besides being the primary greenhouse gas, H2O is a primary coolant in the Earth’s atmosphere. The over all cooling effects of H2O is evidenced by the fact that the wet lapse rate is significantly less than the dry lapse rate. So instead of H2O amplifying any CO2 warming that might happen, it retards it. So instead of multiplying the climate sensitivity of CO2 by a factor of 3 we should divide by a factor of 3 yielding a climate sensitivity of CO2 of .02 degrees C, which is too small to measure.
If all of the warming and cooling over the past 540 million years was due to changes in atmospheric CO2, the ECS would only be about 1.3 °C per doubling.
A greenhouse mostly retards convective cooling. The greenhouse effect retards radiative cooling.
Greenhouse was definitely not the best name to choose.
Fiddleman:
Greenhouse is a GREAT name.
Greenhouse owners add CO2 to their inside air to grow their plants faster.
Fossil fuel burners add CO2 to the outside air to grow plants faster.
This is such good news for the planet that I drive my car in circles every day, ending up in the same garage where I started, to add more CO2 to the atmosphere, greening our planet.
A greener planet will support more life.
A warmer planet will support more life too.
Long live CO2 !
Then the apt phrase would be Greening Effect.
It is a convective greenhouse effect and not a radiative greenhouse effect that keeps a real greenhouse warm. Trace gases with LWIR absorption bands has no effect on how a real greenhouse stays warm. In my home I have a convective heating system. The primary gasses involved with distributing heat around my home are N2 and O2 It is really the non-greenhouse gases that hold heat energy longer because they are such poor LWIR radiators. Remember that good absorbers are also good radiators.
Thanks, William. The “greenhouse effect” is very poorly named. I discuss some of the issues in my post “The R. W. Wood Experiment”
w.
I think that’s what I wrote, regarding convective vs radiative.