By Kenneth Richard on 26. July 2021
From 1979-2018 East Antarctica cooled -0.70°C/decade (-2.8°C), West Antarctica cooled -0.42°C/decade (-1.68°C), but the Antarctic Peninsula warmed 0.18°C/decade (0.72°C). Thus, as a whole, the Antarctic continent has cooled by about -1.5°C to -2°C during the same period CO2 rose from 337 to 410 ppm.
“The temperature trend from ERA5 is consistent with that from observations, in which a cooling trend dominates East Antarctica and West Antarctica, while a warming trend exists in the Antarctic Peninsula except during austral summer.”
“The trends in ERA reanalyses and observations are all negative in East Antarctica in all annual and seasons, and the fastest cooling trend appears in MAM, and the cooling rate of this season is more than 1 °C per decade. In West Antarctica, the ERA5 trends are similar to observation trends, whereas there is a difference between ERA5 trends and ERA-Interim in SON, as reflected in a warming trend in ERA-Interim while a cooling trend is observed in ERA5. ERA5 exhibits a significant cooling trend in annual data, MAM, and JJA, and the trends from ERA-Interim always fail to pass the significance test.”
“It is also worth mentioning that the ERA5 shows a faster cooling rate than ERA-Interim and observations in West Antarctica. Over the Antarctic Peninsula, trends of annual and seasonal temperature means in ERA reanalyses and observations are not significant. ERA5 presents a warming trend with the exception of DJF, as is the case for ERA-Interim and station records.”

Isn’t Antarctica where CO2 warming should be the easiest to detect ?
Michael mann can make all of Antarctica warm-by using dodgy gridding. Its a hockey stick thing called polar amplification
The arctic and antarctic are profoundly different. As far as I can tell, there’s far less heat entering the antarctic continent than enters the arctic. Obviously the ocean can’t carry heat into the middle of Antarctica. Also, the atmospheric and oceanographic currents that circle Antarctica act as a barrier to the flow of heat into the antarctic continent. link Finally there is the fact that Antarctica is at a higher elevation than the arctic.
As far as I can tell, arctic amplification makes sense and antarctic amplification does not.
Heat “enters” an area of the planet surface in accordance with insolation which is more or less identical, integrated across an entire calendar year cycle; albedo, which is much higher for ice than either liquid water or rock; wind patterns; ocean current patterns; and the specific heat of the surface materials – water, both liquid and ice, and in the Antarctic, granite. The specific heat of liquid water is nearly five times that of granite. And geothermal energy surface expression also has an effect on heat gain.
It is not superficially obvious which polar region “gains more heat.” Certainly rock stores far less heat energy in kcal per deg C of temperature change than does liquid water, but it also readily gains or gives up less heat energy for a given temperature change as compared to water … to the tune of about 0.7 kcal per deg C vs. 4 kcal per deg C. So a rocky continent has much less temperature damping for a given energy input or loss than does an ocean. That is why rocky/sandy deserts have much bigger variations between daytime highs and nighttime lows than do humid densely vegetated lands or oceans.
You are totally ignoring circulation. On an annual basis, the arctic gains 84 W/m2 by atmospheric transport.
Antarctica simply loses more heat energy through greenhouse cooling than it gains in any manner
Alistair
Polar amplification is real, and appropriately named.
Nothing to do with Mann, the AGW cheerleader.
Antarctic cools and the Arctic warms. Happens on regular intervals. The Arctic only cools when its allowed to, and does not control its own destiny. Its just a cold area at the top of the NH. The warming in the Arctic has absolutely nothing to do with anything that occurs above 30 deg North. Its the same primary atmospheric mechanism that controls Arctic and Antarctic annual sea ice extent.
The chart linked below by Willis identifies latitude temperature profiles for the period. The warming period in the 1930’s would have looked similar or increased had satellites been available. That is why you should not compare satellite 2meter temperature records with earlier records, and stake your Nation on it.
The second link is to a report by Kirye (kirye.net) that legend from Japan, who from February last year wads advising us that Antarctica has been cooling for some time.
https://notrickszone.com/2020/02/15/gretas-the-guardians-latest-panic-attack-over-antarctica-record-ignores-cooling-trends-of-recent-decades/
Regards
That is a very interesting chart! I have not seen that data presented before.
Pillage
I like putting it up. To the brave, lost, over paid CO2 model producing folk, its like garlic to Dracula. Yes they predict Arctic warming, but not by the mechanism that actually causes this outcome.
The post
https://wattsupwiththat.com/2018/03/24/where-the-warmth-is/
Even that claimed record is highly suspect.
It seems to have appeared out of nowhere:
“An alert blogger, Nicholas McGinley, made the following post at WUWT :
I am having a hard time verifying this report from Esperanza station.
The thermometer data from the last five days did not show anything close to what is being reported, when I looked earlier this evening. But now I checked again, and the numbers have changed completely. Here is a Tweet I posted with the two graphs side by side:
https://twitter.com/NickMcGinley1/status/1226703191695351808?s=20
It has become nearly impossible to trust anything these days.
Besides for all of that … when a short term blip is announced as if it is a representation of the entire state of the planet, while in Alaska a two month trend of temps is showing the coldest period ever recorded in that entire state, something is not at all right.
From here:
Antarctica’s ‘Hottest Day’? Not So Fast | Climate Depot
The RIGHT temperature reading is taken right over the Weber barbecue grill and right next to the hot vehicle engines and the HVAC equipment, next to the parking lot they just plowed clean on a sunny day. Oh and that’s near the water right over the undersea volcano. And it’s definitely warming according to THAT “rural” temperature station./sarc
Temperature inversion creates a co2 emission spectrum, where more co2 acts as cooling
You know when we have a similar inversion? In Arctic winter! And guess where and when the planet is warming most?
A little hint: Arctic winter!
I have not seen that the stratosphere is warmer then the surface over the Arctic on a regular basis like it is over Antarctica. I mean, it probably is occasionally over Greenland, but not with the same frequency and magnitude as Antarctica.
The inversions can occur locally and relatively briefly in the Arctic. It’s far more common, intense and widespread over Antarctica.
Actually it is so cold there that CO2 FREEZES (-78c)
If you had a cylinder of CO2 gas, it would most certainly freeze at that temperature. You could even watch it freezing out by watching the pressure on the gauge falling.
Though the partial pressure of that trace gas in the atmosphere is so low that it remains as a gas.
In Antarectica CO2 cools.
The greenhouse effect is negative at the poles, according to Willis Eschenbach.
You haven’t read the several journal papers explaining the Antarctica CO2 anti-greenhouse effect?
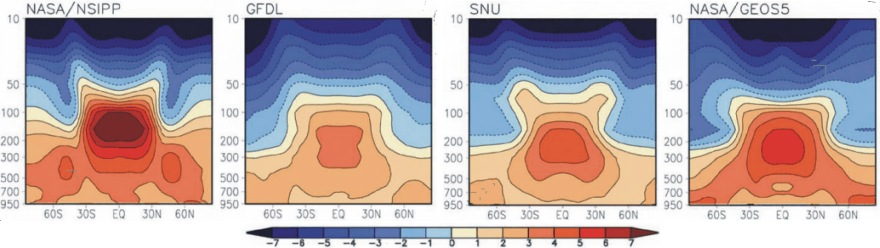
That may be, but remember; the original GCMs predicted warming would happen in upper troposphere at low latitudes, not at the poles. What we’re seeing right now is a strong indication that we do not understand global thermal circulation very well. Our models are completely unskillful in predicting climate patterns.
GCMs do have a problem replicating the temperature in the mid-troposphere tropical region. That is one among many of GCMs subpar predictions. But that does not mean that they are “completely unskillful” in predicting climate patterns. In fact, despite these failings GCMs are still the best models for explaining and predicting the climate.
Let me give you an example of what I’m talking about. Quantum Mechanics makes the worst prediction in all of science in regards to the vacuum catastrophe problem. The QM prediction is so astonishingly bad that it almost defies credulity. It is off 124 orders of magnitude. There is no other prediction in the entirety of science that has failed so badly. Like…not even close. But does that mean QM is completely unskillful in predicting the world around us? Of course not. Despite QM’s many failings (some laughably bad) it is still best model available.
Apparently there’s a “negative greenhouse effect” in the Antarctic.
https://www.nature.com/articles/s41612-018-0031-y
And here I was thinking that the science was settled (/sarc)
This effect has been known for quite some time; at least since Schwarzchild formalized the radiative transfer equation in the early 20th century. Though it is said that Poisson derived nearly the exact same equation in 1835, but almost certainly could not have made the connection between GHGs and the lapse rate since the whole concept of a GHG and even radiation physics in general was primitive to say the least at the time Yeah, I known Fourier first proposed the greenhouse effect to explain the temperature of Earth prior to Poisson’s equation, but there just wasn’t enough known at the time to connect all of the dots this early. BTW…that is Karl Schwarzchild of black hole fame, Simeon Poisson of Poisson Distribution fame, and Joseph Fourier of Fourier Transform fame. Anyway…my point…the negative greenhouse effect has been known for a really long time. It’s nothing new.
Except ice-core deuterium (temperature) shows no CO2 effect at all, unless you believe effect precedes cause. But while you’re on a roll, how about explaining why there is no hotspot in the tropical troposphere?
Ice cores are consistent with the fact that both CO2 is modulated by the temperature and temperature is modulated by CO2. The only models that can successfully explain paleoclimate eras are those that incorporate CO2’s radiative properties.
Maybe the mid-troposphere tropical hotspot is there afterall. And maybe it’s not. Regardless the hotspot is not a uniquely CO2 or even GHG phenomenon. So just as finding it does not prove CO2 or GHGs caused the warming not finding won’t disprove it either. What could be used to disprove CO2 or GHG caused warming would be a warming stratosphere. But here we find the observation is consistent with CO2 or GHG warming since the stratosphere is cooling. That brings us full circle back to the lapse rate dependency on the greenhouse effect. While the global troposphere and surface experience a positive GHE the global stratosphere is experiencing a negative GHE consistent with radiative transfer theory which states that the GHE will steepen the global lapse rate. I refer you to the UAH TLT minus TLS trend of +0.42 C/decade.
The models were written to demonstrate CO2 control of the climate. It’s an assumption that is built into them. So it’s hardly surprising that they find that CO2 controls the climate.
Regardless, as recent posts have shown, there is so much we don’t know about how the climate works, that we are decades away from being able to make climate models that are even marginally useful.
The current models have proven themselves incapable of predicting what the climate is going to do.
Not only recent “posts”, many studies going back quite a ways
“… So just as finding it does not prove CO2 or GHGs caused the warming not finding won’t disprove it either …”.
However an apparent absence of the ‘hot spot’ does falsify climate models based on strong positive water vapor feedback.
It would certainly falsify a prediction of the hotspot should the prediction fall outside the uncertainty envelope as compared to the observation. In such a case the model should be tweaked so that the prediction lands with the uncertainty window while also keeping all other predictions by the model within their respective uncertainty envelopes. That goes for any predicted quantity of any model.
Discounting the 2015 El Niño even the much-adjusted RSS trend is falling outside the model range:

“Tropical (30S to 30N) Mean TLT Anomaly plotted as a function of time. The black line is the time series for the RSS V4.0 MSU/AMSU atmosperhic temperature dataset. The yellow band is the 5% to 95% range of output from CMIP-5 climate simulations”.
Instead of ‘tweaking’ models it’s much easier to ‘tweak’ the observations.
I think its pretty clear that scientists have some work to do to improve the modeled mid-troposphere tropical temperature. Add that to the list of shortcoming that need to be addressed for sure.
You admit that models need work, yet you claim that the models have proven that only CO2 could have caused the recent warming.
Which is it?
I’ve never claimed that GCMs prove that only CO2 could have caused the recent warming. Not only do I (and the rest of climate science) not think that CO2 is the only cause of the recent warming, I also do not think GCMs are required to prove the causal link between GHGs (including CO2) and temperature modulation. That was proved in the 1800’s long before GCMs were even a thing.
What GCMs are useful for is explaining past global mean temperature trajectories and predicting future ones based on scenario based inputs. And they do it reasonably well. In fact, there is no other model type that is as skillful in this task as GCMs. And the models that ignore one or more known climate forcing agents whether it be CO2, other GHGs, aerosols, etc. are less skillful than those that consider all of them. And the contrarian models that ignore GHGs outright are so astonishingly bad they can’t even get the direction of the temperature changes correct on any timescale.
Running a whole slew of different models does not produce an “uncertainty envelope”.
“However an apparent absence of the ‘hot spot’ does falsify climate models based on strong positive water vapor feedback.”
But then again – there maybe no “absence” ….
https://iopscience.iop.org/article/10.1088/1748-9326/10/5/054007
The “parody / caricature” of the worst facet of what is loosely labelled “climate science” goes roughly as follows :
1) Become aware that some “pesky kids” (talking dog optional) have found an apparent discrepancy between what the climate priests — excuse me, I mean “expert, or even distinguished, climate scientists” — are loftily decreeing and actual empirical data from measurements made in the real world.
2) Drop everything and find a way to “correct” … sorry, I mean “adjust” … [ damn automatic spell-checker ! ] I mean “homogenise” … the empirical data with some (random, and only loosely associated) model parameter.
NB : Often this doesn’t work very well the first time, it can take several attempts before you find a “suitable” algorithm / methodology.
The Sherwood & Nishant (2015) paper starts with :
and then includes the following revelation :
Sherwood & Nishant were very open and honest about what they were doing in their paper, laying it all out in their “Data and approach” section.
They took the data from the (usually platinum-resistance ?) thermometers in the radiosonde instrument set, i.e. the scientific instruments specifically designed to directly measure temperature, and looked at how to “homogenize” (they’re American, not British) it in order to bring the original “unexpected” data closer to the “target” provided by the climate models.
Richard Feynman would have been proud. [ Insert “end sarcasm” HTML tag here … ]
CO2 lags deuterium throughout the Antarctic ice cores. Therefore the only consistency is that CO2 has no observable effect on temperature. You can claim that CO2 time-travels all you want, but 800,000 years of ice core and logic say otherwise.
Shakun et al. 2012 is relevant to this discussion. What they found is that although CO2 lagged global mean temperature in the SH it actually lead in the NH. I’m certainly not going to hang my hat one publication, but this goes to show the lead-lag behavior over the Quaternary Period is a bit more nuanced than the blogosphere will have you believe. And keep in mind that the PETM and ETMx events show a clear and decisive lead behavior. The difference…there was a mechanism for carbon release independent of temperature during these events that did not exist during the glacial cycles. But even still the fact that CO2 primarily lagged temperature during the glacial cycles only means that another agent catalyzed the temperature change first. It does not mean that CO2 does not also modulate the temperature. In fact, the only models that can explain the magnitude of the glacial cycles are those that do not ignore CO2’s radiative effects.
I want you to think about something else. The relationship between CO2 and Antarctic temperatures suggest a lag of about 700 years. The problem…Antarctica is not warming and per the ERA5 reanalysis it actually appears to be cooling. So why is CO2 changing rapidly now? Why didn’t it wait until 2700? And why is it going up and not down?
Ah yes, Shakun et al. searching for multi-factor proxies around the world in diverse materials in a pitiful attempt to blur the clear lead-lag relationship shown in the ice core. And you’re just making things up about the PETM and ETMx.
So the lead-lag “does not mean that CO2 does not also modulate the temperature”? Because you say so? Well ok, if you truly believe CO2 travels back to the past to affect temperature changes that happened decades to millennia before.
Perhaps you haven’t heard, but CO2 is going up now because of the increasing use of carbonaceous fuels to lift billions of people out of pre-industrial deprivation. Antarctica is not warming (and the rest of the world remains well within the Quaternary range) because CO2 has no significant effect on temperature.
I heard 700-800 years, but in any even if you subtract 700 or 800 years from today you find yourself in the Medieval Warm Period.
It appears you have your answer.
“Ice cores are consistent with the fact that both CO2 is modulated by the temperature and temperature is modulated by CO2.”
Can you provide a means of falsifying that assertion? I can’t think of one. The evidence from ice-cores is clear that CO2 is a function of temperatures, not vice versa.
I don’t know how you could use ice core data and only ice core data to falsify that either. Maybe someone else knowns and can chime in.
I don’t think the ice core evidence is as clear as you think it is. Remember, you are probably only seeing CO2 plotted against either NH or SH temperatures. Only in academic literature which the blogosphere does not monitor so well do you see it plotted against the global mean temperature. It is well know that the NH and SH have see-sawing temperature behavior so the lead-lag behaviors wrt to the global mean temperature are a lot more nuanced. But that is moot because even if you observe only a lag behavior that only tells you that something else catalyzed the temperature change first. CO2 could still be playing a modulating role here.
The reverse is true as well. The PETM and ETMx events are eras in which CO2 did decisively lead the global mean temperature. But again, that observation only tells you that something else catalyzed the CO2 change first. Temperature could still be playing a modulating role here.
You do know that other trace gases (CH4, Xe, He, Ar) in ice-cores show exactly the same behaviour as CO2? The Noble Gases are of course transparent in the IR, and thus by definition not GHG.
The PETM and ETMx events are eras in which CO2 did decisively lead the global mean temperature.
File that, if even valid, under “correlation does not equal causation.” Reverse correlation, on the other hand, of which there are numerous examples in the climate record, pretty much rules out causation.
“Can you provide a means of falsifying that assertion? I can’t think of one. The evidence from ice-cores is clear that CO2 is a function of temperatures, not vice versa. “
Well yes.
Co2 is both a driver and a feedback of temperature.
It depends which comes first.
In the ice cores temperature was driven by orbital eccentricities … and CO2 followed as a feedback (warmer/up or cooler/down).
Apart from occurrences such as the PETM, anthro driven rise of atmospheric CO2 is a unique example of CO2 coming first.
It is therefore a driver of GMST.
Wrong. The ice cores show CO2 has been rising since 6000 BC, but temperature has been falling. With 8000 years of anthro influence on CO2 (starting with the agricultural revolution), no significant effect on temperature.
The fact that CO2 has risen, albeit modestly, while global temperatures have declined, albeit modestly, over the last several thousand years is one line of evidence falsifying the hypothesis 1) temperature and only temperature can modulate CO2 and 2) CO2 and only CO2 can modulate temperature. The keyword here is “only”.
So, according to your logic, could I claim that Xe is contributing to warming? After all, it has exactly the same lag/lead behaviour as CO2.
No. There is no known causative mechanism by which Xe can induce a significant planetary energy imbalance. Remember, correlation does not imply causation especially when no causative mechanism exists.
No they’re not, unless you’re willfully blind to the reverse correlation that occurs at each change from cooling temperatures to warming temperatures, and from warming temperatures to cooling temperatures, and the other “inconvenient facts” that temperatures generally start to RISE when CO2 is FALLING and near its LOW point, and temperatures generally start FALLING when CO2 is RISING and near it HIGH point.
Ice cores are consistent with temperature driving CO2 levels, NOT CO2 levels driving temperature.
You need serious work on logic and reason.
I think you mean lagged correlation. As has been explained that lag is more nuanced than the blogosphere would have you believe. And it’s not just Shakun et al. 2012 who challenge the lag. We also have Parrinin et al. 2013 and Capron et al 2021 among others to throw in as well. Nevermind that the original lag claim was born out of an analysis of the SH only.
But even if the evidence one day convincingly suggests the lag of CO2 from global mean temperature during the Quaternary Period glacial cycles that does not mean that CO2 does not also modulate the temperature. Your argument that it cannot is one of affirming a disjunct. You claim because A is true then B cannot be true. But you haven’t proven that A and B are mutually exclusive. A lag correlation of timeseries X relative to Y for one period time does not preclude a lag correlation in the opposite direction for another. And as it turns out we do see a lag of temperature relative CO2 for other time periods. But note that neither the lag nor lead correlations we observe between CO2 and temperature are proof that either CO2 modulates temperature or temperature modulates CO2. It just means this observation is not inconsistent with either.
BTW…there are all kinds of two variable interactions that exhibit both lead and lag behaviors depending on how the system evolved initially. You should be able to identify a few off the top of your head within a couple of minutes. So I think the insinuation that this is somehow an impossibility is disingenuous.
Is the magic of CO2 limited to time-travel to the past? Surely, CO2 must be sensitive to irregularities in the earth’s orbit as well, so it can know when its magic is due. Or does CO2 cause the orbital eccentricities as well?
CO2 is a very clever molecule – it always knows when to intervene!
Yes. Earth’s orbital perturbations modulate CO2.
No. CO2 does not modulate Earth’s orbital perturbations.
Very interesting. By what mechanism is CO2 sensitive to orbital perturbations? For example, do tidal changes shake it out of the oceans?
Orbital perturbations change the spatial and temporal distribution of incoming solar radiation. These changes induce further changes in the patterns of snow/ice growth/melt, clouds, etc. which induce a planetary energy imbalance leading to cooling/warming. The change in the planetary temperature changes hydrosphere/atmosphere gas partitioning and biological activity both of which are components of the carbon cycle and ultimately the amount of CO2 in the atmosphere. These orbital perturbations are none other than the Milankovitch cycles and an essential piece of the puzzle for solving the timing of the glacial cycles during the Quaternary Period.
So we seem to agree, orbital perturbations change insolation, which changes temperature, which changes CO2.
Thank goodness CO2 has no significant effect on temperature at concentrations above 200 ppm, or else we’d have runaway warming with every volcanic eruption, etc., etc.
A runaway greenhouse is not possible on Earth even if the carbon cycle were unconstrained (it is) and there was an inexhaustible supply of carbon (there isn’t) because of the Komabayashi–Ingersoll and Simpson–Nakajima radiation limits. Furthermore warming potential of CO2 is braked by the logarithmic relationship between CO2 concentration and radiative forcing via the canonical formula 5.35*ln(C/Ci) where C is the target concentration and Ci is the initial concentration.
We have a choice between two hypothesis of the ice-core
gas data. We have the Anthony Banton/bgdwx hypothesis (lots of post hoc rationalizations, special pleading and handwaving), and we have the alternative hypothesis, which is that the gases are merely repartitioning themselves between the oceans and the atmosphere as the temperatures change.
A challenge to Banton and bgdwx: provide evidence that the latter hypothesis is false.
The two hypothesis are…
CO2 modulates temperature.
…and…
temperature modulates CO2.
Anthony Banton and I do not think either are false.
And we will undoubtedly fail your challenge because evidence falsifying gas partitioning does not exist. In fact, it is quite the opposite. 100+ years of science tells us in no uncertain terms that gas partitioning is a real phenomenon. See Henry’s Law for example.
With positive feedback between CO2 and temperature, every time an animal exhales, or the sun rises over Asia, etc., etc., warming should start to rival anything in the geological record. Talk about a falsifiable hypothesis!
I agree. The hypothesis that “every time an animal exhales, or the sun rises over Asia, etc., etc., warming should start to rival anything in the geological record” is definitely false.
Wonderful. We seem to agree again: There is no positive feedback between CO2 and temperature.
Since we agree that CO2 is sensitive to temperature (see above), temperature cannot be sensitive to CO2 (at least at present-day or higher concentrations).
Please spread the word that the “climate crisis” is based on an absurd misinterpretation of scientific evidence. Just don’t expect any Christmas cards from the political class or their adherents.
R Taylor said: “There is no positive feedback between CO2 and temperature.”
I didn’t say that.
R Taylor said: Since we agree that CO2 is sensitive to temperature (see above), temperature cannot be sensitive to CO2 (at least at present-day or higher concentrations).
We agree that CO2 is sensitive to temperature. We do not agree that temperature cannot be sensitive to CO2.
Note that…
R Taylor hypothesis: “every time an animal exhales, or the sun rises over Asia, etc., etc., warming should start to rival anything in the geological record”
and…
bdgwx hypothesis: “CO2 modulates the temperature”
…are not the same hypothesis. One can easily be falsified (yours) while the other cannot (mine).
If you choose to ignore 800,000 years of ice-core lead/lag, etc., etc., your hypothesis certainly can’t be falsified, to you.
I’m not ignoring ice-core data. What I’m saying is that there is nothing in the ice-core data that is inconsistent with the hypothesis that CO2 modulates temperature. In fact, if anything the ice-core data is one additional line of evidence that supports the hypothesis because it shows that the magnitude of the glacial swings were about 6-8C which cannot be explained with any model that ignores CO2’s modulation of the temperature.
Except its 800,000 years of CO2 lag that provides no hint of an effect by CO2 on temperature. To paraphrase, modeling Antarctic climate without an “ECS” is like deer hunting without an accordion.
Regarding models, let me ask: Is a climate model fatally flawed if it has zero as the sensitivity of CO2 to temperature? What sensitivity does the IPCC assume? And no making things up anymore.
Where are you seeing 800,000 years of lag between CO2 and global mean temperature? What was the precise nature of the lag? How do you get 6-8C swings without invoking CO2? What is the nature of the lag for other eras beyond the 800,000 years you’ve selected? But most importantly how are you thinking that 800,000 years necessarily precludes CO2 from modulating temperature?
No. I don’t think a climate model would be fatally flawed just because it shows zero climate sensitivity as a result of CO2. It would be flawed if its output deviated by observations by more than the uncertainty envelope. You might even say it would be fatally flawed if the majority of its outputs were anti-correlated with observations.
IPCC AR5 states “Equilibrium climate sensitivity is likely in the range 1.5°C to 4.5°C (high confidence), extremely unlikely less than 1°C (high confidence), and very unlikely greater than 6°C (medium confidence)”
Dome C and Vostok deuterium and CO2 data are online. You might find informative to become familiar with them.
Also, you seem to misunderstand equilibrium climate sensitivity (ECS). It refers to the supposed sensitivity of temperature to CO2. You have acknowledged that CO2 is sensitive to temperature. What is the value the IPCC uses for this sensitivity?
Vostok ice core only tell you how CO2 relates to the temperature at Vostok. Vostok is not the entire globe. That 800 year lag you see of CO2 relative to temperature is at Vostok and only Vostok. What I asked was the lag between CO2 and global temperature.
CO2’s sensitivity to temperature can be approximated with the Takahashi 1993 relationship d[ln(C)]/dT = 0.042. We can rearrange terms to make this more calculable as C/Co = exp(0.042 * dT). This says there is a factor of 1.042 change in CO2 given dT = 1C. So at 400 ppm we can expect about 17 ppm more CO2 in the atmosphere than would otherwise have occurred. This is only an approximation because it is only factoring in the exchange with the ocean, but that is a significant portion of the modulation so it gets us in the ballpark.
A few moments of thought should reveal why ice core is the only material that has the temporal resolution and proxy quality to enable a determination of phase between changes in temperature and CO2. The material has actual samples of atmospheric CO2 in its air bubbles, and unmatched proxy quality through its annual deposition of isotopes that, from the outset, have been free of biological complexity.
And I asked what the IPCC uses as the sensitivity of CO2 to temperature. Another moment of though should reveal that such a sensitivity cannot be contemplated by the IPCC.
I encourage you, again, to examine the Dome C and Vostok data, perhaps plot their temperature reconstructions and measurements of CO2 versus time, and search for any indication (beyond a resonable noise-envelope) of CO2 influence on temperature. All the best.
Who said anything about falsifying Henry’s Law? What I am saying is that Henry’s Law explains ALL the observations parsimoniously, whereas your hypothesis requires extraneous factors and handwaving.
Explain why temperatures increase for 800-1000 years while CO2 is falling, and vice versa.
I’m not saying Henry’s Law is false. I’m saying Henry’s Law and all of the evidence that supports it makes it impossible for anyone to falsify the hypothesis gases are partitioned between reservoirs in accordance with temperature. That necessarily means that temperature modulates CO2 in the atmosphere. That is about as settled as anything in science can be settled so I’m not going to waste my time trying to falsify it.
No. Henry’s Law most definitely does not explain ALL aspects of CO2 concentration in the atmosphere. There are dissolved inorganic compound process that also modulate atmospheric CO2 concentration that Henry’s Law cannot explain. Nevermind that there are other processes like volcanic activity and yes even humans that provide a modulating effect as well.
As I’ve already pointed out multiple times in this subthread that 800’ish year lag is for the Southern Hemisphere and for specific timeframes which are themselves narrowly focused on the Quaternary Period only. See Shaken et al. 2012, Parrinin et al. 2013 and Capron et al 2021 for examples of what I’m talking about. I’ll also point you to the PETM, ETMx events, and other eras in which carbon release did lead the temperature. Furthermore, the contemporary warming era convincingly falsifies the hypothesis that CO2 always lags temperature by 800’ish years.
As to why global mean temperatures are not always correlated with CO2 remember that CO2 is not the only thing that modulates the temperature. Nobody is saying it is. In fact, scientists are saying the opposite that there are many things that modulate the temperature. CO2 is but one among many factors. The only way to successfully temperature changes to consider the net effect all factors.
I want to repeat and reinforce something because it is very important. The fact that there are many things that can modulate temperature and CO2 does not preclude CO2 from modulating temperature or preclude temperature from modulating CO2.
Global warming has always to been about warming {or cooling] of Northern Hemisphere.
Actually warming and cooling of northern hemisphere above Tropic of Cancer.
But actually it’s Europe as center of world- and the globalism.
Probably mostly about retaining the tradition of skating on frozen lakes.
Which not big thing, elsewhere.
Global warming is about scaring people into allowing government to tax air. Global warming has no effect on the earth at all, as the earth doesn’t care.
People who want the climate to cool should move to Antarctica, where it is cooling. I’m sure there are lots of “woke” people who would jump at the chance. A cooling climate with no racism anywhere. It’s just what they want.
The Antarctic is inherently racist ! Only white snow.
But they could change that with a diesel powered generator, which they’ll need to keep from freezing to death anyway…
But the Antartic is cooling o/all and not causing any catastrophic sea level rise.
Even if it were warming I wouldn’t consider that catastrophic.
In reply to the idiotic paper….
” A previous explanation attributes this effect solely to stratospheric CO2; however, we surprisingly find that the negative greenhouse effect is predominantly caused by tropospheric water vapor. ”
OK guys. Why did the water vapour increase in the troposphere in the Antarctic? That theory and all the fake calculations are to hide ….
The physical implications of the paleo data. What is happening now, to the planet (patterns of warming) has happened before.
It has been known for twenty years (In the Paleo Climate community) there are cyclic, twenty or thirty year, Dansgard-Oeschger (D-O) warming periods, named after a couple of paleo climate record researchers.
During the D-O warming period, the Greenland Ice sheet warms and Antarctic Ice sheet cools. The Paleo guys call this anomaly the polar see-saw.
The polar see-saw has analyzed by Svensmark. Svensmark analyzed directly ice core temperature (the ice sheets retains a record of the temperature when they formed for about 4000 years) taken from the Greenland and Antarctic ice sheet to determine how both ice sheets changed over the last 6000 years.
Svensmark found repeated warming and cooling and the Polar See-Saw.
Svenmark’s explanation for the D-O warming cycle. Is that cyclic changes to the sun cause cyclic changes to mechanism on the earth which affect cloud formation.
Less cloud cover over the Greenland Ice Sheet cause warming, as the albedo of the Greenland Ice Sheet is less than the top of clouds.
In the Antarctic the albedo of the ice sheet is significantly greater than the Greenland Ice Sheet because the super high speed long duration winds on the Antarctic plateau break the ice crystals.
http://arxiv.org/abs/physics/0612145v1
The Antarctic climate anomaly and galactic cosmic rays
…If changes in cloudiness play a part in climate change, their effect changes sign in Antarctica. Satellite data from the Earth Radiation Budget Experiment (ERBE) are here used to calculate the changes in surface temperatures at all latitudes, due to small percentage changes in cloudiness. The results match the observed contrasts in temperature changes, globally and in Antarctica. Evidently clouds do not just respond passively to climate changes but take an active part in the forcing, in accordance with changes in the …
Borehole temperatures in the ice sheets spanning the past 6000 years show Antarctica repeatedly warming when Greenland cooled, and vice versa (Fig. 1) [13, 14]. North-south oscillations of greater amplitude associated with Dansgaard-Oeschger events are evident in oxygenisotope data from the Wurm-Wisconsin glaciation[15]. The phenomenon has been called the polar see-saw[15, 16], but that implies a north-south symmetry that is absent. Greenland is better coupled to global temperatures than Antarctica is, and the fulcrum of the temperature swings is near the Antarctic Circle. A more apt term for the effect is the Antarctic climate anomaly.
CO2 is teleconnecting the heat from Antarctica to the rest of the world. /sarc
Also, isn’t this the place that is supposedly loosing ice mass?
Maybe not? According to a 30 Oct 15 (updated: 6 Aug 17), study by NASA the Antarctic ice mass is increasing.
“A new NASA study says that an increase in Antarctic snow accumulation that began 10,000 years ago is currently adding enough ice to the continent to outweigh the increased losses from its thinning glaciers.
The research challenges the conclusions of other studies, including the Intergovernmental Panel on Climate Change’s (IPCC) 2013 report, which says that Antarctica is overall losing land ice.”
Has NASA joined the “denialist” ranks? Decidedly not. Later in the report it says:
“IF [emphasis added] the losses of the Antarctic Peninsula and parts of West Antarctica continue to increase at the same rate they’ve been increasing for the last two decades, the losses will catch up with the long-term gain in East Antarctica in 20 or 30 years.”
This mealy mouthed statement should prevent a fall from grace with the faithful adherents.
The point is, the “Settled Science” says the Antarctic ice mass is presently decreasing. The heretical NASA science says it is not.
Here is an interesting question. How can the AGCC models accurately predict sea level rise, when they assume that the Antarctic ice/snow mass is decreasing, and ignore the fact that for 10K years, and at least for another 20 years, it is increasing (and may never decrease)?
Here is the Link to the NASA article:
https://www.nasa.gov/feature/goddard/nasa-study-mass-gains-of-antarctic-ice-sheet-greater-than-losses
OK, but aren’t glaciers the result of compacted snowfall that didn’t melt in Summer? Last I looked anything about 1000 feet above sea level doesn’t melt in Summer, i.e. almost the entire continental surface remains below freezing during Summer. So how could its glaciers be “thinning”, if the snowfall which didn’t melt, has increased?
Oh, just forget about it, we won’t be getting any up front answers from NASA any time soon.
So how could its glaciers be “thinning”, if the snowfall which didn’t melt, has increased?
At very low temperatures, ice sublimes (passes directly from solid to gas). Have you ever noticed how exposed ice in your freezer disappears?
You really need to investigate frost-free fridge technology.
“Sublimation” is when ice turns into a gas without passing through the usual intermediary liquid state. If you leave your ice cubes in back of the freezer for a month or so, you might notice they start to shrink. That’s because they are sublimating: the ice is turning to water vapor even though it never melted. ~Britannica~
Perhaps you need to do some investigation yourself.
WXcycles is right – modern freezers are frost-free, they have a fan that sucks air from the freezer compartment and any moisture in the air ends up in an evaporation tray under the fridge. Old fashioned manual defrost freezers would build up inches thick layers of ice if left too long. One had to forego the usual grocery shopping and leave the freezer off to let all the frost melt, so that you would have room to put food in!
In a sense, the frost-free freezer is a poor imitator of the super-desert dry Antarctic air pulling moisture right out of the ice.
Apparently it dries clothes very well too.
I don’t think you even read my original posts. The guy is not right and clearly he has no idea how a frost free fridge works. Read my response to him. I do know how it works, clearly. You guys could use a refresher.
Be sure to read my second response, too … and explain what I got wrong.
You presumed I had a fridge that frosts up. Derp.
Nevertheless, I live in the tropics and frost levels in old fridges NEVER sublimated away. It ALWAYS grew to glacier proportions until the freezer door refused to close.
Nevertheless, you do get a gold star, because you’ve awarded yourself one.
I will overlook your ego management issues.
I did no such thing. I was discussing the fact that exposed ice cubes in frost free fridges sublime. I provided a source. I also provided a source that Antarctic ice sublimed. Learn to read.
Rory
“At very low temperatures, ice sublimes (passes directly from solid to gas). Have you ever noticed how exposed ice in your freezer disappears?”
–
Perhaps moves around the freezer would be more apt?
Mass cannot disappear [well not easily]
–
Have you ever had to defrost a fridge?
You know. .
Where ice builds up from nothing [Even more amazing]all through the freezer
–
Think about it.
If ice sublimes away in really cold places why would there be any at the poles?
Should have all sublimed away by your, dare I call it, logic.
It’s a process. It sublimes away from the ice until it snows. Back and forth. Sometimes sublimation and regular melting win, sometimes snow wins.
The guy clearly doesn’t get it. I wish they would read BEFORE they post. It would save lots of time.
Are you joking … trying to act the fool? Do you really not know how a frost free freezer works? Have you never noticed the condenser at the back of the fridge or the catch tray?
The ice disappears. The mass does not. The same mass is now gas, which is drawn out and then turned to water by the condenser then deposited in the collector tray,where it then evaporates.
The ice doesn’t build up from nothing. It builds up from water vapor in the in the air. Frost free freezers dry the air in the same way they sublimate any exposed ice in the tray.
THINK ABOUT IT
“The Antarctic ice sheet is quite flat, so the winds can gain in strength and reach as far as the coast. … The researchers then found evidence of katabatic winds capable of triggering sublimation in most of the data collected by radiosonde at permanent research stations across East Antarctica”.
https://actu.epfl.ch/news/antarctica-the-wind-sublimates-snowflakes/
I suggest, next time, you do some reading BEFORE you expose your ignorance.
Sorry, but you seem confused. The condenser in a refrigerator is in a closed circuit containing the refrigerant. It does not condense water vapour. The fridge acts as a dehumidifier, and by channelling the condensate to the radiator on the outside of the fridge, the water is evaporated back into the room.
I’m not the least bit confused except, possibly how so many people on a single thread can have such poor reading skills.
My point was that Antarctic ice sublimes, so do exposed ice cubes in a frost free freezer. You have merely repeated what I already wrote.
I believe the Antarctic “ice loss” being discussed is along the West Antarctic Ice Sheet, which sits atop undersea volcanoes. Enough said.
If we’re talking about somewhere else, then I’ll second the “sublimation” avenue for ice loss – same as for the “snows of Kilimanjaro” which, contrary to Fat Albert’s stupid movie, did not “melt” because of “climate change,” they “evaporated” (sublimed directly from solid to vapor) due to reductions in precipitation caused by land use changes at the base of the mountain.
Well the arctic has definitely warmed… Alaska, Siberia, Svalbard, Lapland…
The arctic sea ice is still in bad shape/declining…
Greenland is still losing mass
I’m really scared.
http://climate4you.com/images/OceanTemp0-800mDepthAt59Nand30-0W.gif
http://climate4you.com/images/NODC%20WestSpitsbergenOceanicHeatContent0-700mSince1955%20With37monthRunningAverage.gif

griff, why don’t you go to Greenland and grow wine grapes? The Vikings did it, so I´m guessing you could.
It does not pay as well as trolling and does not have the benefits.
It would allow Griff to switch from whine to wine!
Greenland seems to be doing quite well, quite a bit above the 198-2010 mean level:
http://polarportal.dk/en/greenland/surface-conditions/
It’s adding mass…
What time frame are you referring to? No change before 1990. It looks like your time frame begins in 2002; less than 20 years.
https://www.climate.gov/news-features/featured-images/greenland-ice-loss-2020-was-below-record-above-average
Greenland’s surface mass balance has been anomalously high this summer; well above average and at times, unprecedented

http://polarportal.dk/en/greenland/surface-conditions/
Unprecedented!
Oh please qualify “unprecedented!” We haven’t been around long enough to know what “precedents” have been set long before we existed as a species.
Well Greenland Glaciers are melting and revealing Tree Stumps which must have existed in extended warmer conditions several millennia ago
As usual, you are wrong:

60 years ago, Artic was warmer than today 😀
As long as there is summer seaice to melt the temperature is capped at zero because of the latent heat of fusion. There was summer seaice in both 1961 and 2021 so no surprises there. Unfortunately, as your graph shows, winter freezes are getting shorter and shallower, that is partly why summer ice has declined over recent decades. The annual average shows what really happened.
https://pbs.twimg.com/media/E7FbwlHUYAEjOPh?format=jpg&name=4096×4096
It’s amazing the things Loydo knows, that just aren’t so.
Is there ssomethink in the graph you don’t understand ? 😀
“As usual, you are wrong:
60 years ago, Artic was warmer than today:
Not in winter it wasn’t – which is where Arctic amplification of AGW is manifesting.
Also it depends on which part of Greenland you talk of this year ….
Plus you are aware of the heat sink that the ice provides in summer?
It’s never going to be much beyond +/- 1C of Zero C.
http://nsidc.org/greenland-today/files/1999/06/Fig2_plots_GrnLndTodayJune21-538×1024.png
“Air temperatures above Greenland varied across the ice sheet, with warm conditions in the northwest and cool conditions across the southeast. The region near Thule in the northwest was more than 2 degrees Celsius (4 degrees Fahrenheit) above the 1981 to 2010 average, with conditions near the major Helheim Glacier in the southeast were about 2 degrees Celsius (4 degrees Fahrenheit) below average.”
Didn’t you read what temperatures are shown there ?
Central Arctic no word from Greenland.
Maybe we’re looking at different things the temperature and 700mb heights in the image posted are centered on Greenland. I don’t even see the Central Arctic Basin in the image.
Hilarious
“arctic sea ice is still in bad shape/declining”
How can the Arctic sea ice be declining? It was supposed to be all gone by 2013, 2014, 2015, 2016, 2018 and 2020.
https://cei.org/blog/wrong-again-50-years-of-failed-eco-pocalyptic-predictions/
The consensus has always been that the first “ice-free” Arctic summer would not occur until 2050 at the earliest. In fact, back in 2001 the IPCC famously (or infamously) predicted that annual mean Arctic sea ice would not drop below 10.5e6 km^2 until 2040. That threshold was first crossed in 2007 and then again 2011, 2012, 2016, 2017, 2018, 2019, and 2020 when it set a new low of 10.15e6 km^2. And even with 2021’s environment that should have resulted in near record high Arctic sea ice extents the year is still on pace to break below 10.5e6 km^2 yet again. So despite the one-off Maslowski-like predictions (which he says were taken out of context) the reality is that scientists have dramatically underestimated the declines as-is. Given all that scientists still expect the first “ice-free” summer around mid-century.
Lol, the consensus was 2010 until it didn’t happen
Actually the consensus was closer to 2100 in the 1990’s. It has been slowly creeping up though.
Now you are just lying.
Here are my references.
My statement about annual mean Arctic sea extent comes from IPPC TAR (section 7.5).
My statement about ice-free conditions closer to 2100 come from several sources. Boe et al. 2009 would be one example here. Even the IPCC FAR predicted 2070. And those were made in the early to mid 2000’s when sea ice extents began declining more rapidly forcing predictions to come a bit soon.
You did not say “Sources can be located that assert…blah blah blah…”
You said, and it is right there in black and white, that “The consensus has always been that the first “ice-free” Arctic summer would not occur until 2050 at the earliest.”
“The” consensus, as if there is one.
“…always been…”, as if things are long settled and chiseled in stone.
“…would not…”, which is not a qualified statement of opinion or conjecture but a blanket statement is if a fact.
“…at the earliest…”, is if no one ever said different.
Now you are going to keep digging the hole you are in, ever deeper.
I bet you cannot even stop yourself from doing so.
Here is the truth: It is 100% obvious to every single person here that you just made this ridiculous assertion up, inside your own head and on the spot.
Because not a word of it is true, whatsoever.
“Consensus” means about the same thing as unanimity in this context. It means there is essentially zero disagreement of any merit.
And yet we all know that one so-called expert after another is on record not merely suggesting or predicting the possibility of, but flat out saying that the ice was melting away at an accelerating rate and nothing could stop it.
There is anything but consensus on not only this issue, but all the other tropes, memes, and lies, spewed with ever increasing alarm by the panic mongering, bed wetting, pants-pissing, end of the world doomsday catastrophists with whom you have common cause.
There are entire books full of specific examples of what you claim no one has ever said.
It really is amazing how fast bad predictions are replaced by a new consensus.
Nonsense. They’ve been predicting ice free Summers non stop for years. Now you know why “consensus” has no meaning in science and only politics has any use for it. The trick is to predict “Ice free” far enough into the future so they won’t look like the idiots they are.
Who is “they” and why do you choose to weight their predictions above the others?
“They” are the idiots who have been predicting ice free Summers for years. I didn’t “choose” anything. Consensus is still meaningless in a scientific context.
”Who is “they”… Al Gore for starters
Yep, and here is the evidence: https://www.youtube.com/watch?v=0Azt-HxnNwo
Do you feel Al Gore has the expertise to be making credible predictions like this? And even if so why did you only consider his prediction and no others?
“Nonsense. They’ve been predicting ice free Summers non stop for years. Now you know why “consensus” has no meaning in science and only politics has any use for it.”
It very does have a meaning.
Just like sky-dragon slayers on here do not represent the majority of denizens – so people like Wadhams doesn’t talk for the IPCC.
““consensus” has no meaning in science”
Of course it has!
Science is made up of scientists- people –
Like anything else in life, people have shades of opinion.
It’s just human psychology.
Then the ever vigilant media pounce on it (it’s newsworthy) … and it becomes a stated mythical fact on here.
It means that those who claim “consensus” have no understanding of the scientific method.
““consensus” has no meaning in science”
Just because science is composed of people doesn’t mean that consensus is part of the scientific method.
The rest of your post is just gratuitous drivel.
“Let’s be clear: the work of science has nothing whatever to do with consensus. Consensus is the business of politics. Science, on the contrary, requires only one investigator who happens to be right, which means that he or she has results that are verifiable by reference to the real world. In science consensus is irrelevant. What is relevant is reproducible results. The greatest scientists in history are great precisely because they broke with the consensus. There is no such thing as consensus science. If it’s consensus, it isn’t science. If it’s science, it isn’t consensus. Period.”
–Michael Crichton
Truer words have never been spoken.
See me in 2050 so I can taunt you again about your stupid predictions.
[Hear it in a French accent]
“The consensus has always been that the first “ice-free” Arctic summer would not occur until 2050 at the earliest.”
Haha!
That’s a good one!
You so funny!
Can you point me to a comprehensive study summarizing the available peer reviewed predictions which shows a median “ice-free” Arctic occurring prior to 2050?
I will say this. If the comprehensive study you find is limited to the last 10 years then that might actually pull the median close to and perhaps even under 2050. Many of the more recent studies are coming in relatively soon. I’ve seen a couple of robust predictions come in around 2040 and even one that suggested late 2030’s.
“It was supposed to be all gone by 2013, 2014, 2015, 2016, 2018 and 2020.”
Nope:
Idiots like Wadhams shooting his mouth of isn’t what the IPCC says.
This is the state of play (to 2019) of Arctic sea-ice vs GCMs ….

Funny that – Wadhams was the “expert” until his predictions failed.
From the record lows of the late 70’s, the arctic warmed for about 30 years. Then around 5 years ago, it started cooling again.
So 2016 was the top and its all downhill from here eh?
Could be, only time will tell.
On the other hand, you have had no problem declaring with unthinking certainty what the future is going to be like.
Hey folks. Always note what Griff says. It’s strong evidence the reverse is true.
Thanks Griff.
“Well the Arctic has definitely warmed”, says Griff. Yes, it’s called Summer.
And the Antarctic penninsula has certainly been warming rapidly:
Warming in Antarctica | UCAR Center for Science Education
(The British Antarctic Survey has 50 years of data but their website is rubbish)
From your article griff:
I guess you missed that.
I guess you missed that.
and a lot of other stuff 😀
For griff, history both starts and stops at points that are convenient for the story he wants to tell.
Did you not read the article? They said the peninsula was warming, but overall Antarctica is quickly cooling.
That would make the peninsula a weather anomaly, not the climate because, on the whole, Antarctica is quickly cooling.
Griff’s remarks appear to be heating up vapidly
Volcanoes are a cause of CO2. CO2 is not a cause of volcanoes.
Heard or read about vulcanoes there ?
You’re rubbish too. Care to mention what the vast bulk of Antarctica is doing?
You mean the Antarctic Peninsula that actually sits outside the polar one? Hilarious.
A warming Antarctic peninsula is a good thing. It will give all the people who want to move to a colder climate a place to vacation in summer.
Anybody would think climate was a function of the Earth’s tilt.
Not anybody. Climate scientists credit CO2 as the climate control knob.
It’s a cold sink.
A cold sink is not as bad as a cold toilet seat.
Tell us how you know (:-))
I’m guessing.
You wouldn’t have to guess if you were old enough to have used an outdoor biffy in a Canadian winter.
Ahem… a Canadian here, trust me, cold toilet seats are a bane in the drain.
Does this mean No Tricks Zone accepts the ERA5 global warming trend of +0.19C/decade?
You must be new around here.
Well, +0.19C/decade is a bit exaggerated according to my calculations.
I only get +0.17323C/decade.
It’s absolutely imperative that we all be precise in these matters.
Otherwise we might induce undue panic in the general populace.
(Remember, WE decide how much panic needs to be induced – let’s not leave it to the vagaries of sloppy roundings.)
yours
The Team
I get +0.1899±0.0054 C/decade from 1979/01 to 2021/06 using this file.
Well now I see where why get different results bdgwx.
Your row 20 has these numbers: 197911 -0.3844 -0.7348
whereas I reckon they should be 197911 -0.2945 -0.7946
I must say I’m very disappointed that peer review didn’t pick your erroneous numerical constructs up and advise you to correct them before publication.
But I suppose that’s what happens when we get Gender Studies PhDs as climate researchers these days, eh?
Those aren’t my numerical constructs. The file and data within come straight from Copernicus. Which file are you using?
I’m not going to let you look at my data sources or my computations.
You’ll only try to find something wrong somewhere.
(You should know how replication efforts are handled in climate ‘science’ by now)
Have you notified Copernicus of your findings?
I tried emailing him, but got a bounceback.
Can you let him know at the next climate seance you’re conducting?
Seance? What email did you use? Who specifically did you try to contact?
If I remember correctly, it was addressed to your custodian, Rainman.
Definitely!
Copernicus has been dead, lo these 478 years. His data are out of date.
Copernicus is a group established by the European Commission in 2015 and operate under the management of ECMWF. Not only is it not a he, but it’s certainly not dead either. And the data products they provide are definitely up-to-date.
“Nicolaus Copernicus was a Renaissance polymath, active as a mathematician, astronomer, and Catholic canon, who formulated a model of the universe that placed the Sun rather than Earth at its center” and you are a humorless dough head.
More evidence that some people have no discernable sense of humour.
Humor and sarcasm were never my strong points.
bdgwx.. please tell me how we can measure the globe’s temperature to .01 of a degree?
Or even to .3844 of a degree.
?
We can’t as far as I know. The lowest uncertainty I’ve seen for monthly mean temperature anomalies is about +/- 0.05 and that is only for months after 1960.
And yet NOAA give uncertainty to 2 singular decimal places. eg 0.14 rather than 0.05,0.1 etc.
HadCRUt to 3 decimal paces.
Where are you seeing that?
Considering the weather station placement problems and the small number of stations, I really wouldn’t trust the numbers to be better than +/- .5°, and even that’s giving the benefit of the doubt to the climate scientists. There is so much of the world that isn’t measured and over-averaged by the temperature ‘measurements’. I only did simple heat transfer modeling way back at uni and AECL, but I know enough that for a system the size and complexity of the Earth I would want at least a million stations in pristine locations. Or go with a lot more satellites. Probably both, and a lot more balloon measurements, with a high flying Argo-of-the-sky drone dirigibles.
Can you post a link to the dataset and accompanying uncertainty analysis showing that monthly mean temperatures have an uncertainty of +/- 0.5C?
In the interest of reciprocation here are two different datasets with two completely different uncertainty analysis showing about +/- 0.05. Lenssen et al. 2018 and Rhode et al. 2013.
That’s the beauty of using anomalies, since they have no physical meaning, we can assign whatever level of accuracy to them that we want.
That doesn’t make any sense. The Celsius and Fahrenheit scales themselves are based on anomalies and no one thinks they are meaningless. And no, you cannot make up any uncertainty you want regardless of whether the metrics are anomaly based or not. It has to be rigorously assessed.
Whoosh … it went right over his head. The guy ain’t playing with a full deck.
He thinks averaging reduces uncertainty.
Yeah, I know. I’m in stitches over here. I wonder if he averages phone numbers, too.
To be precise (the pun was intended) I think the uncertainty of the mean is lower then the uncertainty of the individual constituents of the sample. If that is what you are saying then guilty as charged.
NONE of the Climatistas seem to have the most basic background in Physical Sciences. Anyone who has some training in Physics, Chemistry, or Engineering will understand that expressing meteorological temperatures to 3 decimal places in utter nonsense.
Given the (so called) “data,” expressing meteorological temperatures with ANY decimal places is utter nonsense.
Saw this at NTZ, then checked out the very poor quality study. Did not comment there. KR at NTZ has an unfortunate habit of touting poor quality confirmation bias studies—in the NTZ case, anti CAGW. I made this observation there before; he only takes offense. IMO We should not give credence to any poor quality climate studies, period. No matter their conclusions.
There are too few stations on Antarctica for ERA reanalysis to be meaningful.
And the polar orbit sat stuff still gives inadequate coverage above -85 Latitude.
Is true observationally that the peninsula has been differentially warming and losing ice, attributed by most to changing ocean currents it is exposed to.
It certainly isn’t perfect but reanalysis is probably more meaningful than say kriging only surface station data. And the ECMWF group is considered to be among the best in the data assimilation and reanalysis business. Maybe there’s something better out there that I’m unware of, but at the very least ERA does not strike me as being unmeaningful for Antarctica or any part of the globe really.
Just a hint but try standing in front of a mirror and read your words out to yourself.
Preferably BEFORE you hit the post button.
This article should be rubbed right on the greens’ noses.
The earth is warming. Maybe. So what? It is warmer now than when it was cooler. Even if we allow some degree of catastrophizing, there is no green solution short of returning to the dark ages in terms of energy for the first world and keeping the rest of the world in energy poverty.
That is a bold claim. For starters, what does it mean? What temperature is being measured?
There is no measurement system that has the resolution to support the claim even for surface temperature.
Argo buoys indicate that the oceans are warming but average temperature of oceans is about 4C. The only way deep oceans can warm is through reduced net evaporation. Slowing the water cycle means the cold water from the polar regions drawn up by evaporation at the tropics slows down resulting in average temperature rising. Reduction in net evaporation is to be expected given the long term cooling trend in the Southern Hemisphere since 1585.
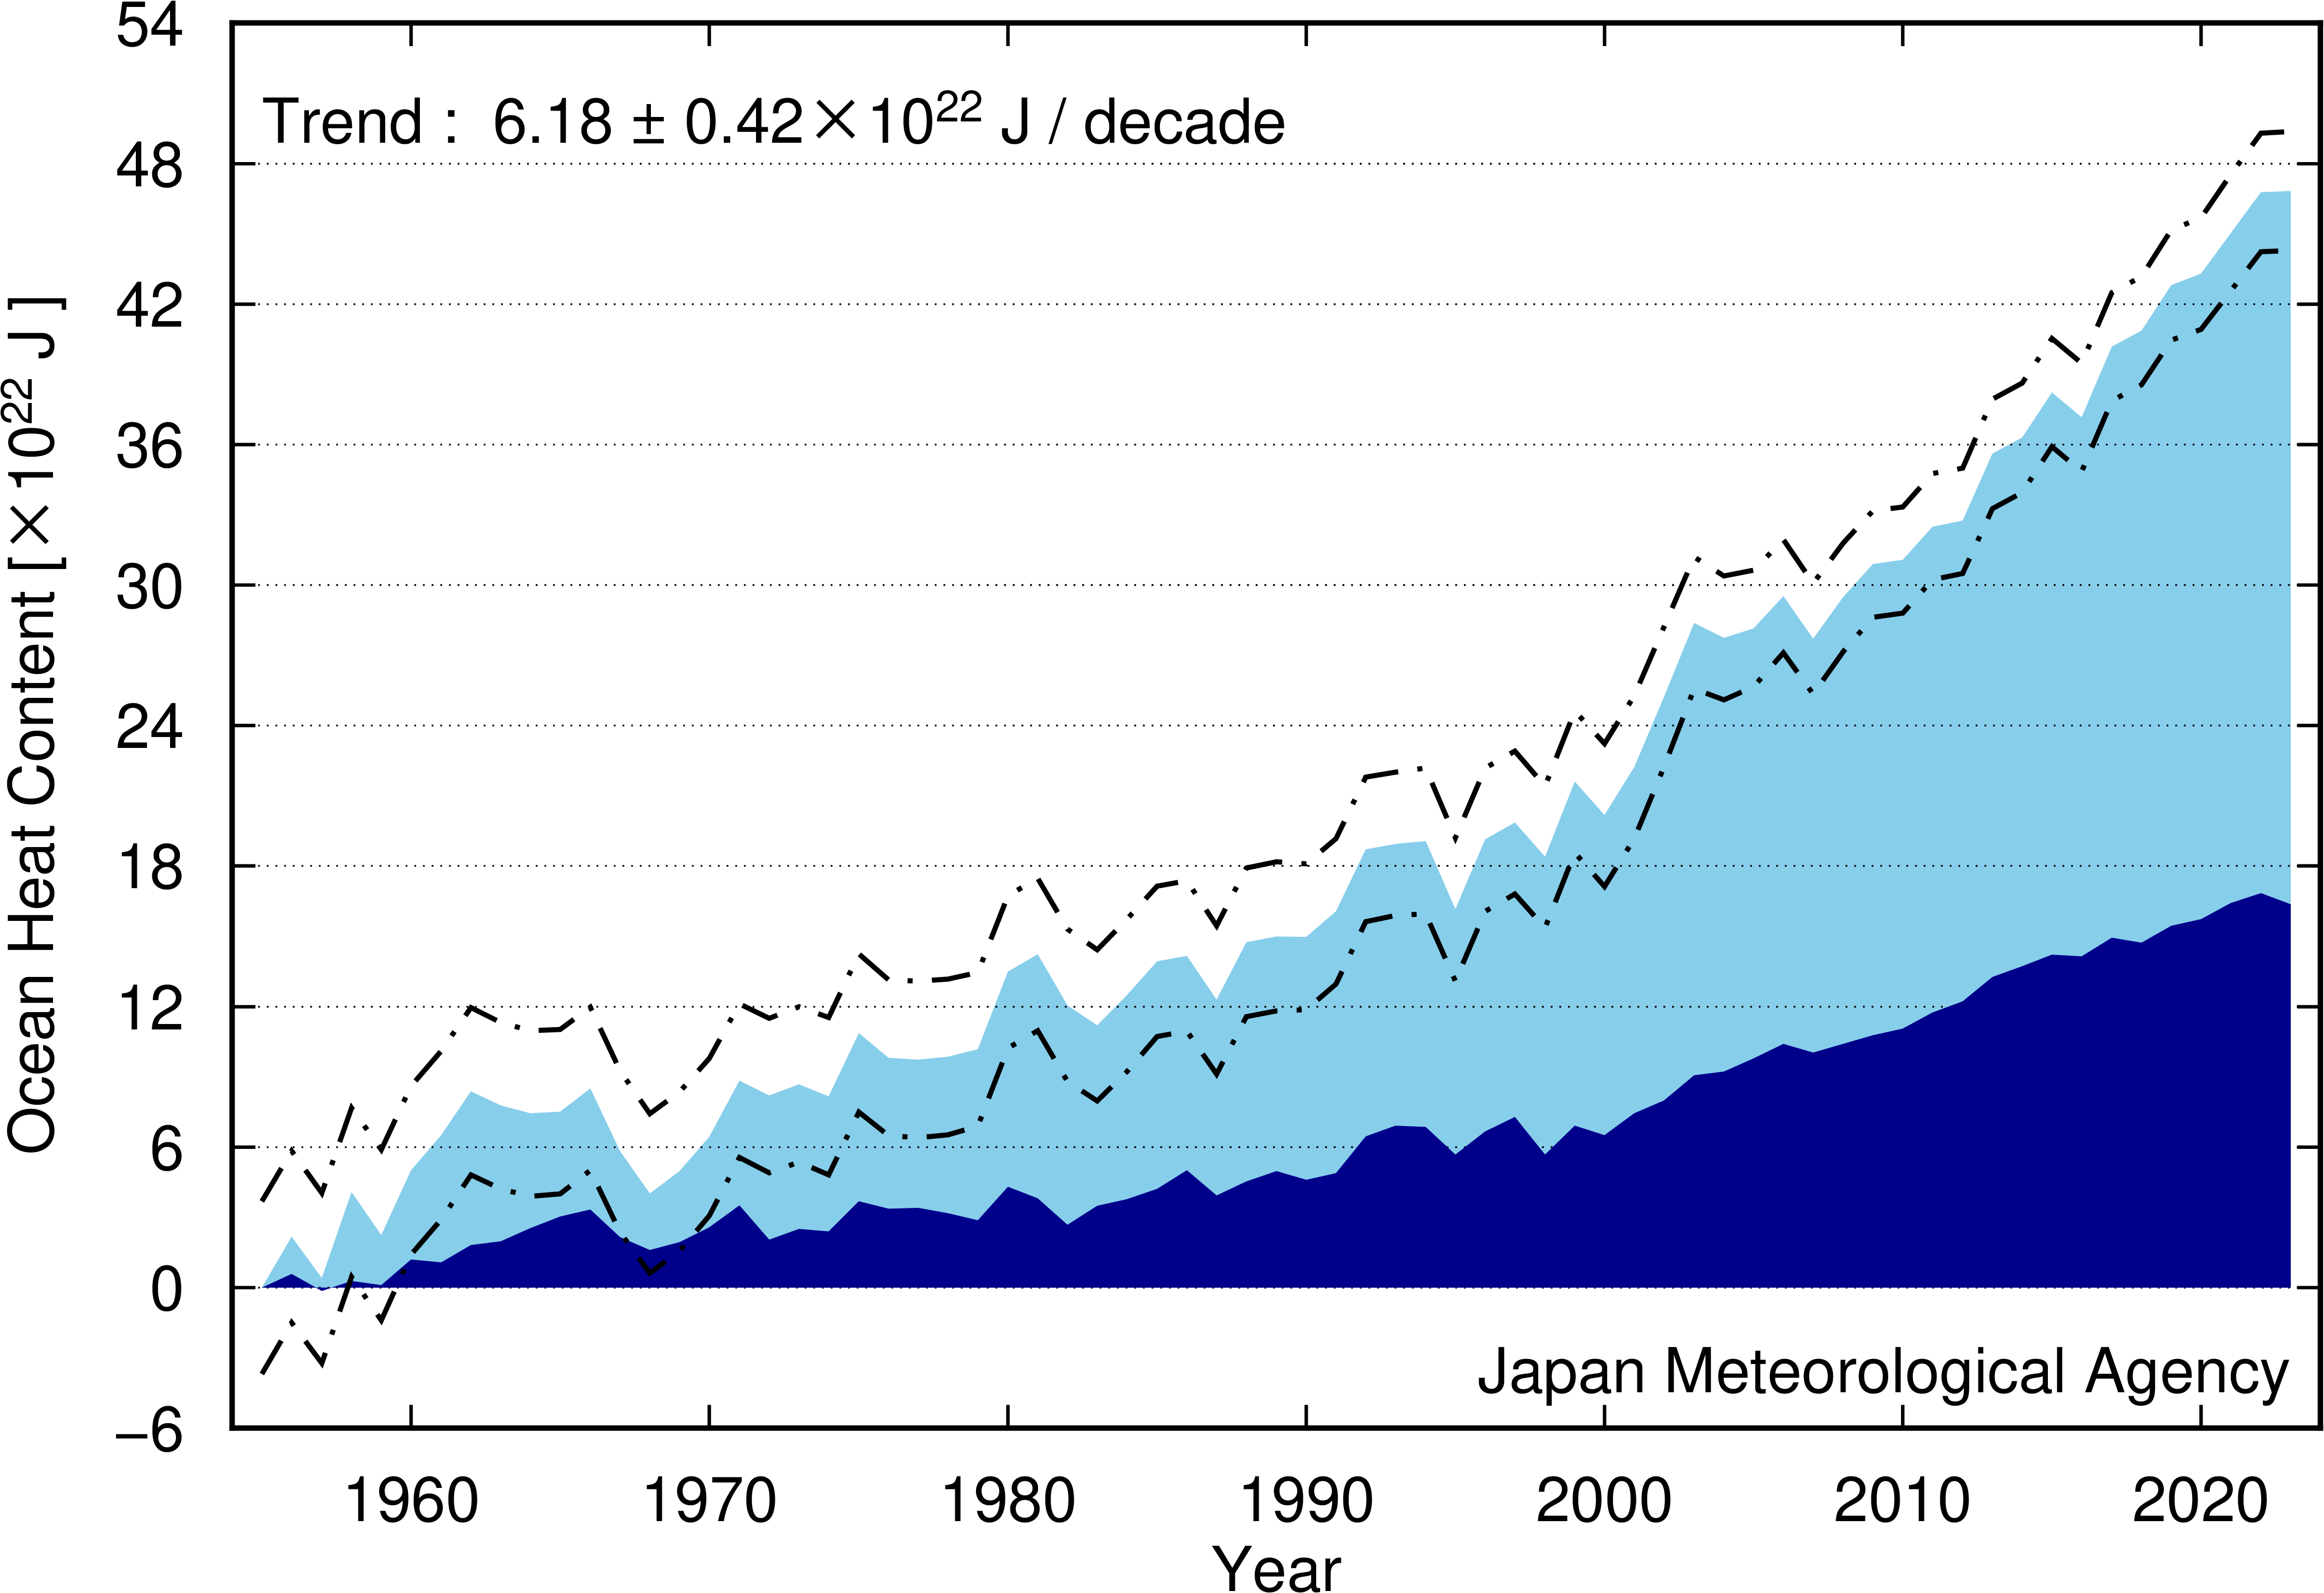
The ocean took up about 300e21 joules of energy since 1970. That is the amount of energy delivered by 155e15 kg of condensing water vapor. That much extra water should have increased sea level by about another 0.5 meters. Where are you going to find that much water? And why isn’t sea level 0.5 meters higher than it already is?
You really believe we can measure the energy balance and energy content of the World’s oceans to that precision?
I have no reason not to believe it. I got my data from Cheng et al. 2021. If you know of another OHC dataset that has a substantially different result let me know.
The title says “upper ocean”, so the authors admit they have no idea about the bulk of the oceans.
Anything authored by Michael Mann is automatically suspect. Falsus in uno, falsus in omnibus.
The publication contains data for the whole depth of the ocean. The 300e21 joules figure I posted is the lower bound.
How do they know the temperatures at every depth, everywhere?
Cheng et al say they spatially averaged all of the observation in the World Ocean Database. References to the relevant descriptions of that database and the methods used for spatially averaging are included on pages 6, 7, and 8. The most relevant in terms of methods are Cheng 2017, Cheng 2020a, Cheng 2020b. For the bottom part of ocean the authors to defer to another dataset described in Purkey 2010.
In other words, they pulled that number out of their posteriors.
Thanks for being so honest!
The article is drivel, and you know it.
Well don’t be silly. It’s “climate science.” No measurements are required, they’re “experts.” They just “know.” /sarc
And if anyone does any actual measurements that appear to conflict with what they “know,” they’ll just “adjust” the measurements based on their “knowledge.”
Correct. This is a symptom of a much deeper malaise in modern “Science”, which is an over-reliance on models and computing, rather than old-fashioned and arduous collection of data in the field, followed only then by analysis and construction of hypotheses. Climate “Science” is by far the worst offender.
Newsflash:
The depths of the dishonesty of everyone involved with that BS you are quoting, knows no bounds.
I assume you have an OHC timeseries in mind from people beyond reproach that comes to a significantly different conclusion? If you post a link to it I’ll definitely review it.
The problem with this claim, is that it exceeds the accuracy of the meters by several orders of magnitude.
The lower bound is 300e21 joules (2σ). Refer to Cheng et al. 2021 for details.
The oceans did not take up more heat. The best available data indicates that the deep oceans have warmed over the past 65 years but that can only occur through the water cycle slowing down through reduced net evaporation in the tropics.
Net evaporation in the tropics is replenished through the deep ocean channel between 500m and 2000m from cooler water at the poles. The less saltier plume in the north-south transect of the Pacific shows the less saltier plume in the channel that feeds the cool water from poles to tropics:
Reduced net evaporation at the tropics slows down this cycle and the deep oceans retain more heat as the deep, cool water flow rate is reduced.
The Southern Hemisphere has been getting less ToA sunlight since 1585 and the Northern Hemisphere more ToA sunlight. This may result in less evaporation from global oceans but there is no good data to support or contradict that. There is no trend in global river run-off since the mid 1950s.
OHC datasets use the WOCE observations. In fact, at least one of the WOCE researchers signed off the Shuckmann et al. 2020 lower bound estimate of 300e21 joules since 1970. That estimate used the WOCE data.
“What temperature is being measured?”
These:

Averaging rocks with coconuts is meaningless.
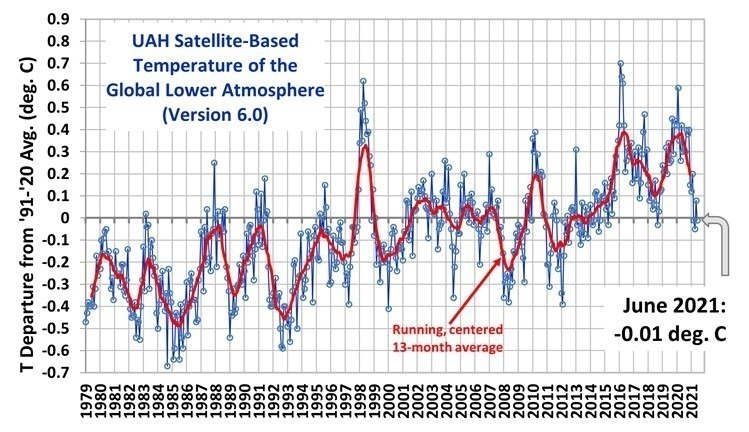
You have there 3 measurements (well not UAH (lets not forget V6) as it’s a radiometer sensed spectrum that is treated with an algorithm that the very same data is treated by RSS and others to come to a greater warming trend).
All quantifying the warming of the Earth’s climate system.
Yes, yes we know that anything other than ice-core proxies and monks diaries re the LIA and MWP do not count here.
(so long as they are ABCD proof)
But it is all that modern science can do.
Sorry about that.
Again:
““What temperature is being measured?””
Antony Banton knows the temperature to three decimal places of every cubic meter of the ocean right down to the floor. Clever guy.
Not au fait with statistic of large smample sizes I see.
Quite correct! I’m a fan of actual measurement of temperatures, not the extrapolation of a handful of readings to the entire ocean. I’m funny like that..
Can you point us to an OHC dataset that satisfies your methodological requirements?
No, because OHC is unmeasurable except in crude terms.
Can you define “crude terms” as an uncertainty expressed as either Kelvin or joules?
The climate is either warming or cooling, never static. That is climate change, an ongoing and largely unpredictable process.
Depends on the start and end points, mostly.
For the entirety of the current epoch, the Earth has been cooling. That doesn’t mean the temperatures are always going down, it’s just the “long term” trend.
Why must temperature “trends” always be linear?
And extrapolated as if they will continue on forever?!
Antatrica is doing quite well in the cooling department.https://wattsupwiththat.com/2021/06/23/global-warming-scott-base-antarctica-endures-115f-cold-enough-to-freeze-co2/ Any warming in the artic is due to the jet stream being a very wavy at this time due to a GSM event.https://electroverse.net/no-scientific-consensus-on-a-warming-arctic-and-extreme-weather/. And further data on the exyent of artic warming. https://electroverse.net/arctic-summers-were-warmer-back-in-the-1950s-60s/
Uh-oh.
1585 was the last time that perihelion occurred before the austral summer solstice. Since then, it has been gradually occurring later in the calendar; now in early January. It moves later in the calendar about 17 days per thousand years at the present time.
So since 1585, the Southern Hemisphere has had ToA sunlight trending down and northern hemisphere trending up. The tropical North Atlantic is now getting 1.2W/sq.m more in April than it was in 1850. However in October, the ToA insolation over London is down by 0.7W/sq.m now compared with 1850. That means more water in the atmosphere when it is increasing and lower temperature when it comes out.
This is the process of glaciation. The tropical North Atlantic will continue to warm during the boreal summer for the next 12k years and the peak in atmospheric water will get later in the year. Peak atmospheric water now occurs in May. Meanwhile the higher northern latitudes will get cooler winters leading to more precipitation/snow. Fundamentally the amount of water in the atmosphere over the tropical North Atlantic is increasing and reaching its peak later each year. Then that water drops out faster as the boreal winters become colder.
What is occurring around the North Atlantic now is the early stages of the next period of glaciation. It should become obvious this millennium. It is fair to say that the next cycle of glaciation actually began in 1585 but not much sign of it yet.
The Indian monsoon will be increasing in intensity as well due to increasing insolation in the northern tropics. This May, both the Arabian Sea and Bay of Bengal were at the ocean surface temperature limit over most of their extent:
https://earth.nullschool.net/#2021/05/11/1200Z/ocean/surface/currents/overlay=sea_surface_temp/orthographic=-279.22,0.31,569/loc=71.572,11.337
Weather models are worse than useless trash when it comes to using them to predict climate. They are good for weather forecasts up to a week ahead.
The long term trend (next 12k years) for the northern hemisphere is for warmer summers and cooler winters. That will cause an increase in precipitation over land and eventually more ice accumulation. Southern Hemisphere is becoming cooler in the austral summer and a little warmer during the austral winter. Australia should expect less rainfall. Less surface water will lead to warmer land temperature despite the lower summer insolation.
The Earth never tracks the same path relative to the sun. The ONLY constant with climate is change. Building windmills to placate the climate gods in the hope of ever balmy weather is a fools errand.
I’m sure the warming is just hiding under the ice.🤣
As in “if you have to ask the price, you can’t afford it”, these reports have to be full of esoteric three letter acronym. It would not due to provide a simple map with the areas clearly labeled for fear of letting the hoi polloi become aware of something they shouldn’t.
Quick, someone tell Steig!
I’m a neophyte when it comes to so-called “Global Warming”, but wasn’t there an article online where apparently Antarctica was “venting” hot water/gas from far below the Earth’s surface, which was warming / melting the ice pack in that region?
Could be wrong though.
The endless drumbeat assertions that Antarctica is warming seem to be entirely evidence-free.
GRACE is not evidence, it’s little more than a computer model.
Air temperatures on the continent aren’t getting any warmer.
It’s not snowing any less.
Catabatic winds off the continent aren’t decreasing any.
Sea ice around Antarctica isn’t getting any less.
Cold water downwelling and deep water formation around the continent edge are increasing.
The surrounding Southern Ocean is cooling.
These facts only further clinch the case against CO2 gas in the atmosphere causing the “global” warming (I guess the South Pole fell off the “globe”) we have observed in the last 200 years. Given that all gases in our atmosphere mix quite well over the entire extent of the atmosphere (north and south poles included) over time frames of 3 months, ANY gas in our atmosphere causing warming through infrared absorption should have a uniform effect throughout the Earth. But the upper northern latitudes have seen temperature rises of up to 6 degrees F during that time period while Antarctica has seen these 2 degrees F minus changes, so I wouldn’t call that exactly a uniform effect, especially not over a 200 year period — for a gas that has risen in abundance in our atmosphere at least 50% in that same time frame.
The real “greenhouse gas”, which has remained uniform for the last 200 — or 2 million — years on Earth, that keeps the Earth warm, is N2, in our atmosphere at 78%, not 0.04%! By slowing down convection currents in our atmosphere taking its surface heat — via mass transfer or via the heat of vaporization of water — quickly to higher altitudes and thence to outer space, it has kept the Earth nice and warm, steadily, for a long time. And where does that slight bit of extra warming come from? Look someplace else than our atmosphere, CO2 or anything else. It’s not the culprit.
David Solan
It’s worth noting that the greenhouse effect goes negative over Antarctica:
https://ptolemy2.wordpress.com/2021/05/16/negative-greenhouse-effect-over-the-high-and-cold-antarctic-plateau/
https://ptolemy2.wordpress.com/2021/05/13/southern-hemisphere-sea-ice-now-extends-80-km-farther-north-than-prior-estimates/
https://ptolemy2.wordpress.com/2020/09/12/widespread-signals-of-southern-hemisphere-ocean-cooling-as-well-as-the-amoc/
circumpolar current laughs at the modern warming, it’s dominated global weather patterns since the Eocene
imho eventually autonomous labor may have to dam the Drake Passage, probably over the course of the 2100s
CO2 levels may start falling by 2050 or before, and since ECS<2 they have zero chance of staving off the next glaciation as we near Javier’s obliquity trough
fortunately by 2100 the human race should be ~100B vastly capable individuals of indefinite lifespan
Here is a low of – 100 F today. I think that is the lowest temp I have ever noted in Antarctica at the surface. … https://earth.nullschool.net/#current/wind/surface/level/overlay=temp/orthographic=168.56,-92.34,506/loc=103.681,-77.851
Here is another result of the deep cold at the South Pole. … https://www.weatherzone.com.au/news/deepest-aussie-july-snowpack-in-21-years/534688