Guest Post by Willis Eschenbach
I got to thinking about the “hiatus” in warming in the 21st Century, and I realized that the CERES satellite dataset covers the period since the year 2000. So I’ve graphed up a few views of the temperature changes over the period of the CERES record, which at present is May 2000 to February 2017. No great insights, just a good overview and some interesting findings.
First, here are the raw CERES global average surface temperature data, the seasonal variations, and the anomaly that remains after removing the seasonal variations.

Figure 1. Seasonal decomposition of the CERES surface temperature data. Statistical results (bottom line) are adjusted for autocorrelation using the method of Koutsoyiannis.
So … what are we looking at? The top panel shows the raw data, the actual temperature variations. The middle panel shows the repeating seasonal variations. The bottom panel shows the “residual anomaly”, the variations that remain once we’ve removed the repeating seasonal component of the signal.
The bottom panel, the residual anomaly, is the panel of interest. You can see how little the temperature has varied over the seventeen years of record. The El Nino of 2016-2017 is quite visible … but other than that there isn’t much happening.
There is one thing that is interesting about the residual … other than warming as a result of the 2016-2017 El Nino, the temperature anomaly only varied by about ± 0.2°C. Among other places, I’ve discussed what I see as the reason for this amazing stability in a post called Emergent Climate Phenomena.
The next question of interest to me is, where is the temperature changing, and by how much? Here is a Pacific and an Atlantic centered view of the warming trends recorded by CERES, in degrees C per decade.


Figure 2. Temperature trends around the globe.
So … what is of note in these global maps? Well, both the poles are unusual. The area around Antarctica is cooling strongly, and the Arctic is warming. Presumably, this is why we’re getting less sea ice in the North and more sea ice in the South. It also affects the hemispheric averages, with the Northern Hemisphere warming and the Southern Hemisphere basically unchanging. Figure 3 shows the average decadal temperature trends by latitude band.

Figure 3. Average decadal temperature trends by latitude band.
As you can see, the only parts of the planet where the temperature is changing much are the Southern Ocean around Antarctica, and the area above the Arctic Circle.
Next, in Figure 2 you can see that the North Atlantic is generally cooling. On the other hand, the Pacific is mixed, with areas of slight cooling and other areas of slight warming. Go figure.
On land, northern Russia, parts of the Sahel, the Gobi, and western Australia are warming. On the other hand, the upper Amazon is cooling strongly. So it looks like some (but not all) deserts are warming, and some (but not all) tropical forests are cooling … why?
I haven’t a clue. In my opinion, the most important words that anyone studying the climate can learn to say are “I don’t know.”
At the end of the story, I’m left with my usual amazement at the stability of the system. Despite being controlled by things as evanescent as winds, waves, and clouds, the temperature anomaly doesn’t vary more than about two-tenths of a degree. Nor is this due to “thermal inertia” as many people claim. Look again at Figure 1—the temperature changes by four degrees C peak to peak in the course of a single year, and changes by a degree and a quarter C in a single month, but the anomaly barely budges. To me, this is clear evidence of strong thermoregulatory systems, but of course, YMMV …
Sunshine today after rain, the Pacific ocean glitters in the far distance, the earth abides …
Regards to all,
w.
PS—As always, my polite request is that you QUOTE THE EXACT WORDS THAT YOU ARE DISCUSSING, so we can all be clear about what you are referring to. Please be aware that while my request is polite, if you ignore the request I may say unflattering things about your ancestry, commenting habits, or cranial capacity … be warned.
DATA: For the temperature data I have used a straight Stefan-Boltzmann conversion of the CERES EBAF Edition 4.0 datafile showing upwelling longwave radiation. The dataset is available here. I have checked and compared this temperature dataset to a variety of other temperature datasets (HadCRUT4, Reynolds SST, HadISST, TAO buoy data) and found very little difference.
I’m curious why this analysis requires the CERES data. Hasn’t RSS and friends been around since 1977?
I was going to ask the same about the UAH data.
RSS and UAH don’t cover latitudes above +85 degrees, below -85 degrees and, in the cases of TLT and TMT (lower and mid-troposphere), some areas with land above 1500 m altitude.
Ceres covers the poles?
As far as I know, CERES does not measure surface temperature. Could be estimates from the MODIS imager that the CERES team passes through… but I wouldn’t trust MODIS infrared for surface temperature because it’s too prone to cloud contamination, and so they only have temperature info on clear days… an obvious source of bias.
Roy W. Spencer March 24, 2018 at 3:02 pm Edit
Roy, you really should read to the end of the post before commenting …
w.
Willis you should have put the information in the last graf up towards the top. I won’t speak for Dr. Spencer, but when I hit the P.S. line, If figure the post is over and that I can move on.
Regardless, CERES data seems to agree more closely to with UAH than RSS. I suspect that remain the case and RSS will continue to diverge over time.
Without checking the orbital details, I think both platforms probably have similar orbital inclination: near pole but not actually over the poles.
The reason that UAH and RSS don’t cover higher latitudes is because of gaps in the data. There is some data but are too many holes to get a representative coverage.
Coverage may come down to viewing angle.of the instruments used and the swath overlap on the ground.
Willis, something as fundamental as that should be in the article, probably near the top, not in a PS after the usual boilerplate “please quote me” spiel.
When I got that far, I said, yeah OK, the usual ( perfectly reasonable ) Willis closing paragraph and stopped reading because I’ve read it a hundred times. I did not expect crucial scientific information relating to the scientific content of the post at that stage. So I also missed the vital explanation of how you got temperature from CERES and was under the mistaken impression that was a data field provided by the CERES folks, not a home spun derivation. I will now delete the graph I just saved.
Please be clearer, preferably in the intro when doing that kind of thing.
Many thanks to Dr Spencer for drawing attention to that.
Greg March 24, 2018 at 11:25 pm Edit
I see. I have put links to data and other information after my “polite request” in DOZENS AND DOZENS of my posts … and now when you are too lazy to read to the bottom of the thread it’s somehow my fault?
Look, no matter what I write there’s always some random anonymous internet popup to tell me I’m doing it wrong … and despite that I’m the most-read of all guest authors on WUWT. Go figure. Today you’re the random anonymous popup telling me I’m doing it wrong … color me unimpressed, you’re just another in a long line.
I have no plans to change how I post links to my data, Greg. I’ve always posted them at the very bottom, after my request. I’ve generally done that whenever I’ve had data and other links for some 600 posts now, and I will continue to do so despite the fact that for however long you’ve been reading my work you’ve been too self-absorbed to notice what’s going on. Consider yourself notified.
At a minimum, it’s a great way to find out who doesn’t read to the end because they are full of their own knowledge of what it’s going to look like … you and Dr. Roy win this round.
w.
Walter Sobchak March 24, 2018 at 5:41 pm
Sorry, amigo, but if you make foolish assumptions that is your business, not mine. If you are too impatient to read to the end of the document, I fear I can’t help you.
w.
AFAIK neither do any of the other temperature data sets. I think what Willis meant to show was that the temps represented in those data sets didn’t vary much from the CERES data, not that they were accurate measurements of temps.
Please, clearly indicate on the Home page that an article is by Willis, so it could be safely skipped without looking inside. Thank you.
Aw, you no get along with W? Opening the article and checking the top line for author too much effort?
Wow. Two wasted clicks. You must be spent.
LMAO. Good one Max.
How ludicrous to assume you can never learn anything, even from somebody who might be wrong. But that’s Alarmists for you, closed minds, arrogant attitudes.
Alexander, I do love your ad hominem argument … in any case, I’d forgotten to add my usual “Guest Post by Willis Eschenbach” at the top. I’ve added it now, so you and others of your ilk will (hopefully) be discouraged from adding any of your usual nonsense to the comment thread on one of my posts.
You are truly a piece of work …
w.
“The comment was about how dreadful your work is…”
Actually it merely implied you didn’t value his input – which could imply either you have a personal problem with Willis or you do not value his work.
I greatly enjoy his input – he is always taking viewpoints I find interesting – more than I can say about most “Attackers” who add nothing of value to the conversation. Take a moment to actually read the article and say something interesting next time. Plz.
Meanwhile…I find the heating of the northern pole to be very curious. I never put any trust into the “land temperature measurements” up there since they are so sparse, but the satellite record seems to be indicating something weird is going on. If this were due to the influence of either the sun or cosmic rays, wouldn’t both poles be affected? Makes me wonder if there isn’t an unnamed oscillation between the poles that we are just now noticing. How the heck would that work?
Rob Bradley March 24, 2018 at 3:43 pm
Rob, he said that he skips my work without reading it, simply because it is mine. If he doesn’t read it, how on earth could he know that any given piece is “dreadful”?
When you attack a man without reading a word of what he’s written, that is an ad hominem attack. It can’t be an attack on the scientific ideas put forward in this piece. How could it be—HE DIDN’T READ IT.
And why on earth would you defend that? Lead, follow, or get out of the way …
w.
rob, i think you are a clown based on past comments. i will still read your future comments though, just in case you post something of interest. your comments also suggest you and alexander feht are the one and the same. i believe that break site rules.
Re comments by Alexander and Rob.
If you do not like the post, just move on to another. There are very few people who can produce the product that Willis does. It usually indicates you do not understand it.
Robert of Texas, one view of why the Arctic is warming is the positive phase of the AMO. Warmer water flowing into the Arctic through the N. Atlantic has melted more ice which in turn allows more heat to enter the atmosphere from the ocean.
Since the AMO has little influence in Antarctica you would not see the same effect. However, having more ice melting in the Arctic could very well speed up the Meridianal Overturning Current (global ocean current) which could lead to more upwelling of cold water around Antarctica.
This would cover two of areas of interest. Finally, increasing CO2 could actually be responsible for the warming of the desert areas and the cooling of the tropical rain-forests. This is an expected result of of Dr. William Gray’s alternate water vapor feedback hypothesis.
“Based on past experience reading prior work by you.”
Now that thar is funny, given the quality of Rob’s posts.
Willis, he was not “attacking a man” he was saying he did not wish to read your work. That is presumably based on past experience of reading your work, not a personal “attack”.
There are similarly several commenters here like HenryP that I don’t even bother reading any more because they are so irrelevant. It is perfectly valid to form an opinion about someone’s work based on their past work and use that as a filter.
I have a positive prejudice in your case because your posts are often interesting and ( usually ) clearly explain the origin and processing of the data.
Richard M – The Arctic warming doesn’t look like it’s caused by warm water flowing N from the Atlantic, because N of the Atlantic is where the warming is least.
AFAIK neither do any of the other temperature data sets. I think what Willis meant to show was that the temps represented in those data sets didn’t vary much from the CERES data, not that they were accurate measurements of temps.
If you don’t actually read the post, how exactly do you know it is ‘dreadful’? Having a predisposition to classify all work by a person as ‘dreadful’ without reading it is an ad hom.
There was a study done years ago that examined reading and comprehension levels of American citizens that suggested they read on a fifth grade level and comprehend on a third grade level. Perhaps that extends to a small minority of WUWT participants. In reading Willis’ posts over the years I have been enriched by his presentations, since as a chemical engineer, I’m not a member of this exclusive community. Since I suffer from Expressive Aphasia from three strokes(no sympathy please)–my affliction requires re-reads in order to process the information, and hopefully comprehend what is presented.
This chest puffing and ad hominem attack does not offer any value to what we are all hear for—mainly to offer theories and evidence to promote knowledge. Can we provide the respect to each other that the other side does not?
As usual, Rob has to descend to personal attacks.
The first line of the summary on the home page clearly indicates the author.
Should we also make the same adjustment for your comments, so people can skip over them?
Perhaps Alexander’s comments should be printed in invisible ink?
Back in the paleolithic days of blogging, there was a blogger who disemvowled obnoxious commenters. She had a script that would remove all of the vowels from their comments, rendering the comments unintelligible. Just saying.
I have a Greasemonkey script on my laptop that changes the text color of any poster I add to its blacklist to Red. That way I can still read them if I want to, but I’ll know ahead that it probably won’t be worth my time.
Of course, I then read most WUWT articles on my phone.
>¿<
Anthony, that is exactly what I was thinking by the time I got to the 5th ad hom by Bradley. I started skipping because of my experience with his earlier junk comments.
Fortunately each comment has a bolded “Rob Bradley” at the top left informing me that it is time to flick the wheel (I have one of those mice with a no-click centre wheel – makes for faster fly-bys). It is the ultimate in efficient no-click browsing.
Willis: Thanks for the charts. I want to cite them in Atlanta in August. At best, CO2 might promote some regional warming, but it is certainly not global. It can be argued that is it sub-regional at best. It is also sub-annual because it is only in winter that one can trace some upward evidence.
Catastrophic anthropogenic sub-regional polar warming in winter? CASRPWIW? Not enough there to frighten the kittens.
What’s worse, Rob Bradley, is that you’re wasting everybody’s time. On and on and on it goes.
And you complain that Willis’ prose isn’t worth anybody’s time??
How can I print “CATASTROPHIC HYPOCRISY” in letters 10 feet high?
Mr. Watts, my name always appears above my comments, and anybody who doesn’t like them, can skip them. We are talking about articles, not comments here. I don’t want even to look inside any articles posted by Willis, and I sincerely hope that he would never forget to put his name on the home page again. Willis knows very well, what he is guilty of, and I will never forget it.
I agree with Alexander that a guest post should be clearly labelled. That omission has been promptly correct and hopefully more attention will be paid to this.
I don’t know what he thinks W. is “guilty” of and don’t really give a damn. But thanks for flagging the omission.
Jeeze, Rob…. The message went over your head by 10 feet, didn’t it?
Your stupidity… it burns.
But you’re not alone–you’re in good company with Mr. Feht.
(BTW, I can easily print 10-ft high letters on a Calcomp drum plotter, which has been available since the 80’s, and link them together in one big sign, proving you’re as ignorant as you are stupid.)
Again, you’re just wasting everybody’s time.
When I was in high school, I went on a field trip to a company that printed bill boards.
They could easily print 10′ tall letters.
Reminds me of a fake test given to first year plumbing apprentices, the header stated read all questions before starting test ! Last line on the second page said ” to complete test only answer question 1 on page 1 ” , only one apprentice passed the test .
And the purpose of the test was just a lesson in reading paperwork from start to finish .
I thought I was the only one Alexander , I don’t like being critical but people who have a high opinion of themselves only want to talk about themselves and I get bored.
What’s hilarious is that the Warmunists have now changed their tune to “we should be cooling now”, implying that cooling would be good, but also deftly moving the goal posts in one fell swoop. Impressive.
“On land, northern Russia, parts of the Sahel, the Gobi, and western Australia are warming. On the other hand, the upper Amazon is cooling strongly. So it looks like some (but not all) deserts are warming, and some (but not all) tropical forests are cooling … why?”
Cloud cover springs to mind?
Human activity might actually be having an effect in the Amazon. But not much.
B.j., I agree that it has to somewhat to do with clouds. Dr. William Gray believed that adding more CO2 will lead to higher evaporation (caused by increased downwelling IR) which will work as a negative feedback. This would occur over rain-forests but not over deserts. Hence, the deserts would warm while the rain-forests could very well cool due to a strong negative feedback (clouds and reduced high altitude water vapor).
And as Dr Spencer pointed out the way W. has derived the “temperature” data probably is being biased by cloud cover problems with the coverage in CERES data. This is not CERES temperature data produced and endorsed by those running the project, it is Willis’ homespun, non PR “temperature” data.
If CERES allowed a reliable temperature field to be calculated I would expect the CERES guys to be marketing it.
Greg March 24, 2018 at 11:49 pm
As I mentioned in the part that some charming folks didn’t read and now want to complain about, I’ve compared the conversion of the upwelling surface longwave data into temperature using the S-B equation to a variety of datasets. There is very little difference with any of them, and what difference there is, it is generally near the poles where all the temperature datasets have very little actual data.
Yes, and I’ve said that over and over. If you have missed that, including in this post, then shame on you.

And if you think it is not accurate, then instead of simply flapping your gums, you should get the data and compare it to the temperature dataset of your choice. I’ve done it and found only small differences, a few degrees here and there. Here’s a comparison with HadCRUT4:
See all the huge differences between the two?
I didn’t think so … there is a difference between the NH/SH in the two datasets, but that’s because the HadCRUT dataset doesn’t cover Antarctica, which is very cold.
w.
Greg, here’s another comparison of the CERES and the HadCRUT temperature datasets. This is the temperature average by latitude band. It shows what I mentioned above, excellent agreement except at the poles:
So it might be “homespun” … but it is also damned accurate.
w.
The answer is provided within a 10,000 year context in paper Holocene
part 8, AD 1600 to AD 2050, at
http://www.knowledgeminer.eu/climate-papers.html.
This study starts with paper part 1, at 8,500 BC.
Willis, let Anthony publish it, run it through your computer analysis.
The given figures are correctly calculated, feed them into your system,
and a wonderful job is awaiting you to shred a paper series into pieces –
let Anthony give you the possibility to show that the “Californian tiger”
has strong teeth to bite…. Cheers from the author, JS.
J., my rule of thumb is that if you have to look back a thousand years to find support for your theory you might need a new theory … hang on, I’ll take a look at it.
…
…
OK, I read the abstract, viz:
Dear heavens, you are giving an impossibly high bar to the term “special pleading”. As soon as your first theory no longer works, you bring in the second one … and when that one can no longer explain the same data, a third one is invented … then a fourth one to cover the fact that your third one can’t explain the data either.
I’ve NEVER seen special pleading like that, it is truly special … I did like the idea of a “cosmic lunar meteor impact”, however, and “Solar Inertial Movement” does indeed sound very sciency.
Pass.
w.
Many claims, no proofs.
““caused by a strong cosmic lunar meteor impact”
Exactly how is this impact, to the moon, determined and proven?
““this impact displaced the Earth-Moon Barycenter (EMB)”
Exactly how is this claim and effect determined?
““which then spirals back in 4 complete loops onto its regular EMB flight path around the Sun”
Just how does that mechanism work? For every action there is inaction? That four loops bit of description smacks of a model. not empirical evidence.
Before that odd Earth-Moon-Sun physics, I have no clue exactly what you are describing:
• A) Are you describing the Earth-Moon orbit around the sun, as the sun orbits within the Milky Way Galaxy?
• B) Or are you only referring to Earth’s orbit, around the sun as it orbits the Milky Way Galaxy?
• C) Or are you referring to Earth’s moon orbit path around Earth, around the sun as the sun orbits within the Milky Way Galaxy.
All of which fail to explain why Earth’s moon meteor impacts and orbit has any impact to Earth temperatures?
I’d love to know the mechanism by which a barycenter can be displaced.
The only way’s I can think of would be for either the orbit of the moon to be substantially changed or for the mass of either the earth or the moon to be changed substantially.
In neither case would the barycenter spiral back to what it used to be.
Ever.
Not commenting on the merits or lack thereof of J.’s hypotheses, but 1000 years is not a long time in climate studies. The longer the period of observation, the better. A millennium is shorter than many climatic cycles.
The peak of the Medieval Warm Period, of which CACA advocates wanted so much to get rid, was about 1000 years ago.
Willis, this is not paper part 8…. The paper part 8 concerns 1600 AD to 2050 AD.
You are in a different paper… Why dont you see in THE FIRST SENTENCE this
paper you quoted goes from 550 AD to 1650 AD? Is this so difficult to see?
Where did you leave your specs?
[Please] read the correct paper…. and your comment is mysterious as well….
something about the first, the second and the third theory and the [fourth] to
cover facts? The mistake is yours.- Willis…regards….J.
weltklima March 25, 2018 at 5:01 pm
Thanks, welt, my bad. I looked at your paper Part 7. Part 8 is no better. All of my previous objections still apply. It is still just multi-parameter curve fitting. You should read my new post, How Not To Model The Historical Temperature. In it I say:
I’m sorry, but you have neither.
w.
It looks like using a bunch of sin waves to match a curve… I don’t understand how that explains the climate changes, but instead seems to just model them.
You prediction is that it should continue to warm, or at least not to cool until 2049 (+/- some error margin?). The problem with these kind of predictions is that I will be dead before I know the answer… 🙁 Its easy to make claims that are far into the future – no one will remember if you are wrong – this is a common tactic used by the AGW crowd (or whatever they call their religion these days). To have any immediate value you need to make some predictions that can be measured in a few years (10 or less would be nice).
I have been following some people’s prediction that due to the solar activity, we will be entering a period of cooling somewhere in the early 2020’s. If it does show any degree of cooling for several years, this would be proof that your hypothesis failed?
Can such a short time series have any significance whatsoever?
Paul Homewood March 24, 2018 at 1:58 pm
That’s why we invented statistics, to answer that question. The answer is yes, series of that length can be statistically significant. For example, the CERES global temperature trend over that period is not statistically significant … but the CErES Arctic temperature trend of the same length is statistically significant.
Best regards,
w.
Willis, plz explain for mere mortals like myself… LOL Why is the CERES data data statistically significant for one and not the other? You say these things which are opportunities for me to learn, and then just leave me hanging! 🙂
Robert of Texas March 24, 2018 at 4:23 pm
Good question. Given a dataset, suppose there is no trend. Obviously there’s no statistically significant trend.
Next, suppose there is a slight trend. Depending on how long the dataset is, that might or might not be statistically significant. If there are only say ten observations, we could be looking at just some small short-term random fluctuation.
But if the dataset has a thousand monthly observations covering ninety years and it shows the same trend as the short dataset, it may well be statistically significant.
Think of it as dice. If you throw one die say six times, and you only get one “6”, is that unusual? Is it significant? Heck no, we’d expect to get one six in six throws.
Now suppose you throw the die fifty times and you only get one “6” … you’re gonna say “These dice are weighted! This is a significant result!”
So the answer basically is, significance depends on the size of the trend and the length of the dataset. (The other factor is the “Hurst Exponent” of the dataset, but that’s getting down into the weeds.)
w.
It’s not just the Hurst exponent, it’s whether there are also external factors driving a system that have periods longer than the window of the data you are looking at (well, really longer than the window divided by a factor of 2-5 depending).
For example we have about two datapoints for the 60-70 year PDO/AMO cycles (140 years of temperature and other PDO related data). We don’t know much that’s statistically significant given a sample size of 2. We just know they seem to exist.
That’s why I dislike trendlines on time series data. There’s a huge assumption about oscillations whose periods are longer than that of the dataset. Those oscillations that are long look like trends… but they are not.
And from a scientific philosophy standpoint, you have to prove they are NOT there, not the reverse. (aka the null hypothesis). Very difficult to do, we only have very poor proxies (which have hints of long periods…)
Which means getting back to one of your favorite and my favorite quotes: “I don’t know” applies to trendlines in time-series data.
Peter
O ye of little patience and too much science!
All will be revealed in full technicolor next year, as you’d know had you taken the time to read The Future History of The Climate Debate:
2019
Trenberth Travesty seen from space
The centrepiece of Nature’s April cover story is a stunning panorama of the Trenberth Travesty, stitched together from satellite imagery of the famous “missing” thermal energy.
“Using the hermeneutics of quantum gravity,” report the authors, “we are at last able to visualize this tricksy, mercurial zone of heat exchange whose 20,000-km front stretches from Cape Illusionment in autumn to The Isle of Mann in fall.”
The latest scientists believe the Travesty acts by thermal subterfuge to “launder” Kelvins from the atmosphere all the way down to the bathyclimatic ecosystem of the ocean floor, converting them to Hiroshimas en route.
How many Hiroshimas in a Travesty? Or is the unit of heat missing in the deep sea a Trenberth?
Chimp,
I’m a science communicator, so, much like the authors of the Future History of the Climate Debate, I am far too busy to hand-hold everybody who doesn’t understand things.
Do your own homework: convert Kelvins to Nagasakis at room temperature and 1 atm using Clausius-Capeyron, then Steffen-Boltzmann / Navier-Nick Stokes should get you the rest of the way from mNgs to microTrvs via deciHss.
It should take you all of 2 minutes, assuming you’ve put in the several years of college-level reading required to opine competently in a forum like this, where real scientists occasionally stoop to lurk.
You have, haven’t you?
I’ll freely admit that my Loopy Transform Functions are a bit rusty, which is why I asked for help.
Chimp,
if I explained it to you I’d have to explain it to everybody. And that, of course, is precisely what denihilists want: to bog real scientists down in the futile attempt to teach elephants to dance instead of spending time in the lab, advancing our fundamental understanding of the big settled questions.
Despite having many years of college in “climate science”, I have no idea WTH Chimps and Keyes are talking about. Maybe it is the Sat night wine. Maybe it is them. 🙂
Mary, you might want to rethink the first word of your comment (despite?)!
B.K.
🙂
Chimp, don’t hold your breath, he’ll always obfuscate, so no wonder Mary is a bit confused.
He never quotes the lapse rate in degrees Fahrenheit per fkn furlong like normal scientists do.
Not that it matters any more though because we’ve been educated recently by Navier-NStokes about CO2 not having any effect where the CO2 actually is, so fk the lapse rate.
Climate communicate that Keyes
LOL.
I also wondered if they are related.
Can if find the missing hot spot(s) in the upper troposphere over the equatorial band as the physics upon which the models demand?
Missing hot spots? oh dear.
Had you taken the time to sit some basic Theology or Divinity 101, as all serious climate communicators from President Gore to Reichsführer Dr Cook have done, you’d understand the cliché that absence of evidence is not evidence of absence.
Oh gawd… ROFL You are killing me… Plz stop! 8-D
rah, did you not look at the maps provided, the tropospheric hot spot and the missing heat is hiding in plain sight in the arctic 😉
There is some evidence that you have been drinking absinthe.
good grief..we better do something….it’s getting incredibly hot ….where they have no thermometers
Why has northern Russia warmed in recent years.?
The sharp decline in spring snow extent is likely to have had a large part to play in that.
As land surface free of snow cover warms up itself and the air lot quicker then snowfields with the coming of spring.
would that be a positive feedback that the warmists are always warning people about?
Yes l agree its a positive feedback.
l just don’t agree with the warmists claim that its been due to CO2 levels. Far more likely its been due to changes in wind patterns. With increases in warmer southern winds and a decrease of Polar air flowing over the area.
taxed,
Nice thought. But wrong.
http://i64.tinypic.com/2gxlmvp.jpg
.and more specifically… Eur-Asia:
http://i63.tinypic.com/2dvllea.jpg
source:
https://climate.rutgers.edu/snowcover/chart_anom.php?ui_set=1&ui_region=eurasia&ui_month=2
That chart is for February snow cover not for the spring.
lf you check the Rutgers spring snow cover chart for Eurasia. You will see there has been a sharp decline in spring snow cover over the last 50 years.
taxed March 24, 2018 at 2:13 pm
taxed, I just looked at the Rutgers Snow Area database, and I can find no “sharp decline in spring snow extent”.
To confirm, I looked at the surface albedo in northern Russia. It averages 36%, and while this has declined slightly over the 17 years, the decline is only 1% per decade …
So while the change in surface albedo may have played a small part in the warmth, it seems unlikely to be a major factor.
Finally … why is northern Russia warming and not northern Canada?
Best regards,
w.
Willis
lf you look at the Rutgers Spring Eurasian snow extent chart, you will see there has been a decline in the snow extent over the last 50 years.
Why is northern Russia warming and not northern Canada?
Well there has been warming in northern Canada, its just not as much as in northern Russia.
Again the spring snow extent has a likely answer. Because if you look at the Rutgers N America spring snow extent. You can see the decline in spring snow extent in N America has been less then in Eurasian over the last 50 years.
So less of a decline in spring snow cover in N America means less of a positive feedback for that area as well.
“decline in the snow extent over the last 50 years.”…well yeah
Tricked everyone into thinking it was a new ice age……I love it when they start graphs then
taxed March 24, 2018 at 4:02 pm
True. However, my data above starts in the year 2000 … and the Rutgers spring Eurasian data (March-April-May) shows a slight but not statistically significant INCREASE in snow area during that period.
This agrees with the data from KNMI, as well as the CERES albedo data.
So I’m sorry, but your claim doesn’t hold up.
w.
Willis
l still believe that spring snow extent is more of a factor then its been given credit for.
Took a look at the data on Rutgers and its noticeable that the biggest declines in the snow extent since 2000 have been in late spring/early summer. Just when it matters the most. lts also interesting how the spring of 2017 bucked that trend and its looking like this spring may also do the same. So l will be looking to see the changes if any it brings to temps in northern Russia.
RE: “Finally … why is northern Russia warming and not northern Canada?”
Would you believe the Russians have found a way to hack our heat? Just a theory . . .
Russia sits right next to the Arctic with the areas of missing sea ice close by. The ocean heat released has a short hop to venture into Russian air space.
A plausible explanation as good as any. Thanks.
Hi Willis,
When do you expect your thermoregulatory system to start working? The top figure gives a temperature increase of 0.1 degrees per decade. Which given a few years will exceed your stated limits of +/- 0.2 degrees? Or is your claim that over any 20 year period the temperature will remain within a 0.2 degree limit
– a position completely consistent with global warming allowing you be right while raising CO2 levels continue to cause the temperature to increase.
Do you want to claim that over a 40 year period the trend will be zero? Or is there a measureable trend over a 40 year period?
Since Earth has probably warmed only about 0.5 degree C since the end of the LIA (rather than the cooked book figure of 0.8 degree often cited), the trend for that period is around 0.03 degree per decade.
As with all previous warm intervals during the Holocene, the Modern Warm Period has contained cooling cycles as well as warming. Each lasts about 30 years. The warming from c. 1977, when the PDO flipped, until the past decade has been no different from prior instances, the early 20th century and mid-19th century warmings, separated by cooling cycles. The world is already cooling again, although the El Niño of 2016 obscured its effect.
Arctic sea ice, for instance, has been growing since 2012. When the AMO enters its cool phase in a few years, the effect should become more pronounced.
Hi Chimp,
The world has warmed significantly more than 0.5 degrees since the little ice age (although I have no idea
when you think it ended). And I would like to see your evidence that the world is cooling. Willis analysis above suggests that it is currently warming at 0.1 degree per decade since 2000.
Warming periods in the 1880s, 1930s-1950, and 1990s-2017 that are interspersed with cooling periods.
Your claim for greater warmth is evanescent.
Willis has demonstrated CERES data for the period from 2000-2017, which everyone basically agrees was a warming period.
Trillions spent and CO₂ effect is still unproven.
Willis’s Earth Temperature control processes are ever active.
Willis has published several times here explaining Earth’s temperature control method explicitly.
Even you are capable of searching for and reading those articles.
Germonio,
No, it hasn’t. In 1995, even alarmists agreed on 0.5 degree C. Since there has been essentially no warming since then, and that figure was probably high, the real number is around that level.
The traditional end of the LIA is given as 1850, but dates before and after that year have been suggested for the first warming cycle of the Modern WP. Earth cooled dramatically from the 1940s to late ’70s, as it also did in the decades before WWI.
Oops. Forgot to reply about start of global cooling. That would be around 2007, so if it has still warmed since 2000, that should change after the effects of the recent ENSO swing wear off.
ATheoK:
As nearly as I can reconstruct them from spotty raw data, here is my take on the alternating warm and cool cycles of the secular Modern Warming interval:
W: 1857-87
C: 1888-1917
W: 1918-44
C: 1945-76
W: 1977-2006
C: 2007-
The early 20th century warming was probably hotter than the late 20th to early 21st century interval. So far the Modern Warming has been cooler than the Medieval, which was cooler than the Roman, which was cooler than the Minoan, which was probably cooler than Holocene Climatic Optimum peak warmth.
Previous secular warm and cool periods of the Holocene and prior interglacials show similar countertrend cycles.
Your numbers are much more detailed and accurate than my rough statements! 🙂
Thank you!
You’ve well demonstrated, Chimp, that warming cycles are followed, unfortunately, by cooling cycles. While the overall trend may be higher since the Little Ice Age, there are concerns that cooling is masked by adjustments and UHI.
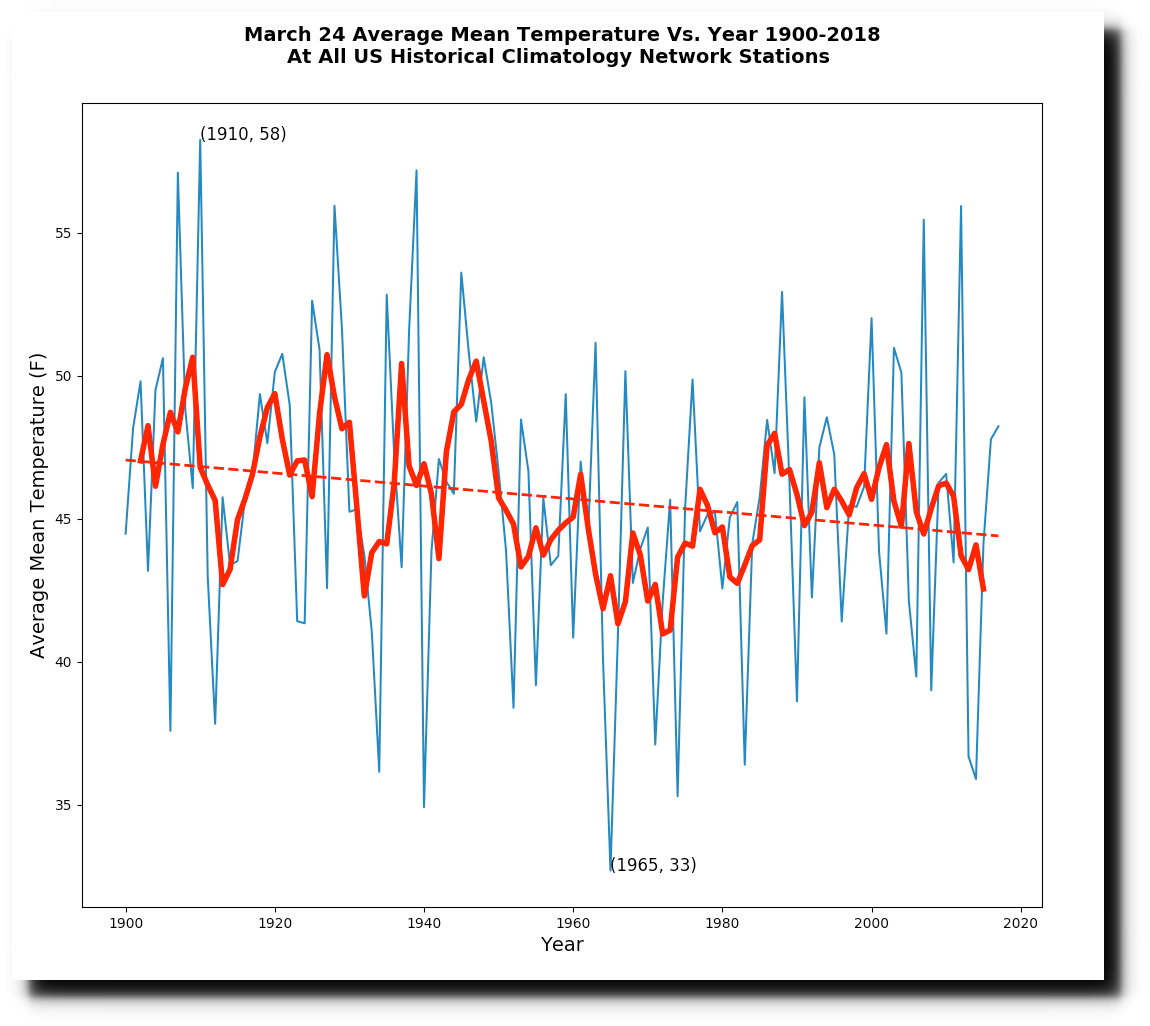
From a Spring post:
And “Plummeting March 24 Temperatures“
Even the IPCC only claims 0.8C, Germino, are you calling the IPCC a bunch of liars?
Germonio March 24, 2018 at 2:21 pm
Germonio, do your homework. I’ve written about this very question over and over. You could start with my very first post on the subject of thermoregulation, it’s here …
Heck, I’ve got a whole post entitled “Slow Drift in Thermoregulated Emergent Systems“, but noooo, it’s obviously beneath you to do some research before uncapping your electronic pen and babbling inanities.
w.
Willis,
It is the slow drifts that make your hypothesis almost completely unfalsifiable and so non-scientific. Your claim seems to be that there is thermoregulation except for when there isn’t (i.e. the slow drifts) and for unknown reasons. How does one prove that such an assertion is wrong? Over the last twenty years the CERES data present above suggest the temperature is rising at a rate of 0.1 degree per decade. Is that a slow drift? Or a rapid one on a geological timescale?
Germinio March 24, 2018 at 4:24 pm
“Over the last twenty years the CERES data present above suggest the temperature is rising at a rate of 0.1 degree per decade. Is that a slow drift? Or a rapid one on a geological timescale?”
The most common example of a governed system in our lives is the “cruise control” on your car. Does it hold your speed perfectly steady? Of course not. I set it for 60 mph, and as I drive around it varies up or down by around 3 MPH.
Does this ± 5% drift in speed prove that there is no cruise control?
Don’t be daft …
Now, consider that over the 20th century the temperature varied by about ± 0.3°C. This is a temperature variation of about one-tenth of 1% (0.1%) … and you point at that to show that there is no temperature regulation?
Really?
All that proves is that you know very little about heat engines with governors …
w.
Willis,
if a car continued to increase its speed by 1% per kilometre while on cruise control at which point would you say that they cruise control was not working? The same with a “slow drift” idea at which point does the slow drift mean that the supposed thermoregulation is not working?
Nobody disputes the existence of positive and negative feedbacks in the climate system. The question is whether there are sufficient negative feedbacks to overcome the positive effects of increasing CO2. I would dispute that your thermoregulation effect is strong enough to counteract the effects of changing CO2 levels. Suppose for a moment that all CO2 and other non-condensing greenhouse gases disappeared from the atmosphere overnight. What would be the effect on the temperature? The standard greenhouse gas theory would predict that in a few weeks all of the
water vapour in the atmosphere would condense out and the earth would freeze. Would your
thermoregulation effects be strong enough to prevent that?
Geminio,
The GHE of CO2 is practically played out after the first 200 ppm. The effect is logarithmic, so adding more is, as Lindzen says, like putting another coat of white paint on an already white wall.
The net feedback effects are liable to be negative on a homeostatic, water world. Hence ECS is likely to be less than 1.2 degrees C per doubling. But even if slightly positive, net net, ECS would come in between 1.2 and 2.0 degrees C, probably around 1.6.
So, no worries. It’s all good.
Chimp,
about all that talk about CO2 saturation above 200ppm: what I have learned, is that CO2 is transfrering heat energay to other molcules by contact. From that special moment one CO2 is able to receiv new energy.
I tried hard to find any thing about the CO2 saturation, but in vain.
Meister,
I didn’t say that there was “saturation” above 200 ppm, but that most of the GHE of CO2 has already been effected at that level, due to the logarithmic nature of the GHE. The molecules continue working, but with diminishing returns.
“The GHE of CO2 is practically played out after the first 200 ppm.”
This exaggerates the curvature of the logarithm. The slope at 400 ppm is half that at 200 ppm. It isn’t nothing.
Germino, it would depend entirely on how fast the feedback of the car’s cruise control worked.
Nick, as always trying to disprove things nobody said.
By the definition of a logarithmic curve, the difference between two points on the curve will never, ever, be nothing.
However at some point the difference between two points and nothing will be close enough that the difference no longer matters.
Seriously Willis, get a better car. Using a satnav GPS s speedo my cruise control never even registers a one mph difference.
Nick Stokes March 24, 2018 at 5:48 pm
I didn’t say it was nothing. Just practically nothing, ie not significant.
The doubling from 200 to 400 ppm would produce warming of 1.2 degrees C without feedbacks. Negligible but wholly beneficial.
Germinio states: “Over the last twenty years the CERES data present above suggest the temperature is rising at a rate of 0.1 degree per decade.”
The period starts with a La Nina and ends with El Nino. That is the reason for your trend. Using the complete data set without understanding what is represented can lead to incorrect conclusions.
“I haven’t a clue. In my opinion, the most important words that anyone studying the climate can learn to say are “I don’t know.””
Well said. All the best to you.
Total intensity as at 2015:
http://www.geomag.bgs.ac.uk/images/Fcolourful.jpg
Predicted annual rate of change of total intensity for 2015 – 2020:
http://www.geomag.bgs.ac.uk/images/dFcolourful.jpg
Blue rags to cans of red bull …
http://www.geomag.bgs.ac.uk/images/image022.jpg
Sunlight
yes it should be I dont know why mars, pluto and jupiter are warming, instead we get some convoluted story about wind and storms, and orbital shifts over 50 year periods..
Or satellites flying through magnetic anomalies.
Willis, the temperature trends at latitude is a chart I’ve not seen before. Very interesting- thanks.
We
Why has northern Russia warmed in recent years.?
Because more people live there now than ever before. Bigger cities warming the rivers they live next to kept free from ice as long as possible like the sea routes with huge icebreakers to connect those cities.
Looking for power plants?
https://earth.nullschool.net/#current/chem/surface/level/overlay=so2smass/orthographic=108.68,66.81,1120
http://polar.ncep.noaa.gov/sst/ophi/color_anomaly_NPS_ophi0.png
Just look how warm the rivers are and how they have changed.
http://polar.ncep.noaa.gov/sst/ophi/color_anomaly_NPS_ophi0.png
https://en.wikipedia.org/wiki/Angara_River#Dams_and_reservoirs
https://en.wikipedia.org/wiki/Vilyuy_Dam
Robertvd, March 24, 2018 at 3:03 pm
“Why has northern Russia warmed in recent years.?
Because more people live there now than ever before. Bigger cities warming the rivers they live next to kept free from ice as long as possible like the sea routes with huge icebreakers to connect those cities”.
Actually no! More people do not live in Russia than before. I don’t generally trust Wiki but it will suffice in this case.
“Low birth rates and abnormally high death rates caused Russia’s population to decline at a 0.5% annual rate, or about 750,000 to 800,000 people per year from the mid-1990s to the mid-2000s. The UN warned in 2005 that Russia’s then population of about 143 million could fall by a third by 2050, if trends did not improve”.
Demographics of Russia – Wikipedia
Some up; some down:
http://population.city/russia/arkhangelsk/
http://population.city/russia/irkutsk/
http://population.city/russia/nizhniy-novgorod/
http://population.city/russia/perm/
http://population.city/russia/saint-petersburg/
Murmansk has lost population since the end of the Cold War, for obvious reasons.
https://en.wikipedia.org/wiki/Murmansk
Could it be a mini bipolar seesaw?
The AMOC is a major player because it connects both poles.
https://www.nature.com/articles/srep08909
Deserts and forest are subject to prevailing weather patterns and can be different in cooling/warming.
The Great Pacific Garbage Patch looks really hot.
“On land, northern Russia, parts of the Sahel, the Gobi, and western Australia are warming. On the other hand, the upper Amazon is cooling strongly.”
I have a gadget here which will show trends in surface measurement (either unadjusted or homogenised).It shows various time periods; the nearest to this is 1997-2016. It shows measurement points and the triangular mesh used to interpolate. The original gadget is a trackball like Google Earth. Here is a snapshot of unadjusted data showing N Atlantic, poles, Sahara etc
The N Atlantic cooling does show out. The Sahara warmed, but is part of a band of warming extending from the Arctic through Eastern Europe. The US is a patchwork, mostly showing the variable effect of unadjusted TOBS.
Nick:
Your image is much warmer than the images Willis displays.
Willis’s graphics show the Northern hemisphere as warming 0.22°C per decade. Your graphic Nick show a temperature over 2.5°C.
Apparently, GHCN V3 and ERSST includes infilling.
“Apparently, GHCN V3 and ERSST includes infilling.”
No, I am showing the trends of the stations as marked – ERSST are grid centres. The shading is linear in triangles between correct colors at the nodes.
The trends, as marked, are in °C/Century. So they aren’t that different.
Your legend “Deg C/Cent” translates as “Degree Celsius/Centrigrade”.
Not that one can tell exactly what “red” equals, since at 2.5°C the color is yellowish orange. Plus, it looks like the scale is increasing since the distance from 2.0°C to 2.5°C is much smaller than the scale at lower temperatures.
CERES during a warming period runs at 1.2°C.
Once several periods of cooling and warming are properly tracked, there may finally be an accurate rate °C per century.
Way over 2.5°C per Century? Extremely doubtful.
Your graphic states GHCN V3 and ERSST, I simply copied what you listed.
Nor does your answer unequically state that there is not any infilling.
Does that claim of yours “the trends of the stations as marked”, mean you downloaded the station data from the stations?
Or is it the data as entered into the GHCN V3 system by NOAA/NASA
It does not appear that “unadjusted” means what you think it means.
” mean you downloaded the station data from the stations?”
I used the GHCN V3 tabulation. For these years, that comes directly from the CLIMAT forms, as submitted by the met offices and displayed here.
“It does not appear that “unadjusted” means what you think it means.”
I know very well what it means. I have extensive experience with the set and its errors, as described here. It is unadjusted. Values thought doubtful are flagged, not removed or altered, no matter how ridiculous. Errors are often dramatic, like a sign or decimal point error. In my own work, as here, I removed all quality flagged readings. That is my choice. They are a very small percentage. Details for 2010-2014 with all flagged stations are in that link. There are in total 1101 flagged data (listed in detail) in 53 months, out of about 2000 stations per month.
“Not that one can tell exactly what “red” equals”
If you go to the app, you can click on any station to get name and trend, in numbers. The color scale has to be non-linear, otherwise most of the color range goes to separating the extremes.
Sorry to inform you but CERES also infills.
Of course, there are no surface temperature measurements for 75% of the Earth’s surface, so your graphs and analysis are totally worthless and meaningless.
Of course, you always say no-one knows anything about anything. I use the ERSST data for oceans, used by most climate indices.
Does CERES always take 7 months to get a month’s dataset out there? According to the site, the last Version 4 set is from last June.
Willis,
In your 3rd chart most of the variance is contained in a band plus or minus 0.2 deg C around nominal. Can this variance band be considered the sum of all errors and uncertainties in the instrumentation and measurement systems used to acquire the original data? It seems possible to me. [But what do I know, I’m just a metallurgist with a failure analysis background].
Good work
Deserts warming more? Isn’t that what you would expect from increasing CO2 in areas where the water vapour isn’t already soaking up all the OLR?
Willis – do you have the tech to check daytime and nighttime temperature trends from CERES data? It would certainly be interesting if all the trend growth was because if slightly less cold nights..
Hi honoured sir! Is there any way you could display your findings on polar stereographic projections for both poles?
Tom Bakewell
Thomas C Bakewell said:
Yes, but it would likely take me three days of programming to get it to where I’d be able to display it … I’ll put it on my (long) list of things I’ll do when I get time.
w.
“At the end of the story, I’m left with my usual amazement at the stability of the system”
Exactly. A system of finite volume with finite heat flow from a source, will experience a steady state firmly anchored around the mean values. And gh-gases have nothing to do with the temperatures in such a steady state.
The laws of thermodynamcs determines the state, and gh-gases are not included, because they don’t add any energy to temperature.
Once you start averaging tgen detaiks are easily lost. Willis says source is ” pole warming”. Here decadal changes are confined to seasons. The chart is pretty much why CO2 is an undetectable impact. But perhaps ozone can be. Erl has lots more to say here. https://reality348.files.wordpress.com
Macha