Guest Post by Willis Eschenbach
Let me start with the standard explanation of why the earth warms when greenhouse gases (“GHGs”, e.g. water vapor, CO2, methane, etc.) increase. This is from NASA:
When averaged over the course of a year, the amount of incoming solar radiation received from the sun has balanced the amount of outgoing energy emitted from Earth. This equilibrium is called Earth’s energy or radiation balance. Relatively small changes in the amounts of greenhouse gases in Earth’s atmosphere can greatly alter that balance between incoming and outgoing radiation. Earth then warms or cools in order to restore the radiative balance at the top of the atmosphere.
SOURCE
That explanation is clean and clear. When greenhouse gases reduce the amount of outgoing radiation, the earth’s surface has to warm up and radiate more, until the balance is restored.
According to NASA it’s quite clear and obvious—when CO2 increases, simple physics requires that the surface temperature increases to keep the radiation balance at the top of the atmosphere.
So, what’s not to like?
To explain what’s not to like, let me provide the simplest possible energy balance model of the earth. The values are all approximate.

Figure 1. Approximate energy budget of the planet. All values are in watts per meter squared (W/m2).
There are three layers in the model—the lowest part of the stratosphere; the troposphere; and the surface. Note that all three layers are balanced, in that the amount that is lost by each layer is equal to the amount that is absorbed. In addition, the system as a whole is balanced—237 W/m2 is absorbed by the system, and 237 W/m2 is radiated back out to space.
Now, recall the NASA claim that if GHGs increase and absorb more upwelling radiation, that the “Earth then warms or cools in order to restore the radiative balance at the top of the atmosphere.”
How large a change in the radiation balance are we talking about? Well, if we use the figures of the Intergovernmental Panel on Climate Change (IPCC), since the year 1958 when we started measuring CO2, the reduction in outgoing longwave radiation due to increased CO2 is about 1.5 W/m2. This is a change of a bit more than half of one percent of total outgoing radiation. Or to look at it another way, it’s an imbalance that is increasing at the rate of about two-hundredths of one watt per square meter per year … very, very small, in other words.
So let me ask you. Looking at Figure 1 above, is the warming of the surface the only way that the outgoing radiation at the top of the atmosphere (TOA) can be increased by about half a percent per half century to restore the overall balance?
Obviously, and totally contrary to NASA’s claim, surface warming is NOT the only way to restore the top-of-atmosphere radiation balance. Some of the other ways are:
• Decrease the incoming radiation. This happens by means of changes in the amount, composition, albedo, thickness, time of emergence, and/or nature of the clouds. It also happens over the ocean, from the ocean albedo changing due to winds causing breaking waves, spume, and foam. These are all white and reflect much more sunlight than does a calm ocean surface.
• Increase the amount of solar radiation absorbed by the atmosphere. This happens by means of changes in the amount of atmospheric water vapor, or by changes in the clouds.
• Increase the amount of latent heat removed from the surface via evaporation of water. This happens by changes in the wind, since evaporation is inter alia a linear function of the wind speed. It also happens by changes in the number of thunderstorms, which increase local evaporation due to storm-generated winds. It also happens due to increasing ocean water surface area due to spray, as well as due to the increased surface area of waves compared to smooth water.
• Increase the amount of sensible heat removed from the surface. This is also a function of the wind, since the sensible heat transfer increases as a linear function of wind speed.
• Increase the amount of surface energy moved high into the troposphere inside thunderstorm towers. These towers circumvent greenhouse gases in two ways. First, heat from the surface is moved into the bases of the thunderstorms as latent heat of water vapor, which doesn’t interact with the greenhouse gases. Then when the water vapor condenses, the heat is released. But it travels vertically inside the cloud tower, where it is not free to interact with the surrounding greenhouse gases. At the end of the vertical movement, the energy is released far above the surface, where there are far fewer greenhouse gases to absorb it.
• Increase the amount of surface upwelling radiation that makes it directly to space. This happens in the areas around and between the thunderstorms. These areas are composed of dry descending air which has been emitted at the top of the thunderstorms after having most of the water condensed out. Because water vapor is the major greenhouse gas, this lets much more surface energy go straight to space.
• Increase the amount of energy moved from the tropics to the poles. This is a huge amount of energy, about 10% of the total solar energy entering the system. Because the poles are much drier and colder than the tropics, much more of the outgoing radiation from the surface goes straight to space. When more energy is moved polewards, more radiation escapes to space.
Any one of these phenomena is certainly capable of changing outgoing TOA radiation by half a percent in half a century.
Let me summarize:
- There really is a very poorly-named “greenhouse effect”, which has nothing to do with greenhouses. It’s the main reason why the earth is not as cold as the moon.
- When greenhouse gases increase, the amount of outgoing top-of-atmosphere radiation does decrease.
- The theoretical imbalance over the last sixty years due to increasing CO2 is about 1.5 W/m2, or about half a percent of the outgoing radiation. Per year, it’s an annual imbalance increase of 0.02 W/m2, an amount far too small to measure.
- Unlike what NASA and other mainstream scientists endlessly claim, there are many more ways other than surface warming for this imbalance to be restored.
- In general, we do NOT have measurements of the various other ways of restoring the balance that are anywhere near accurate enough to tell us how much of each of these phenomena contribute to the 0.02 W/m2 change which is annually necessary to restore the balance.
The important takeaway from all of this is that there is no physics-based requirement that surface temperatures perforce must change when the level of CO2 and other greenhouse gases increases or decreases. The surface temperature may indeed change to restore the TOA radiation balance, but contrary to the endless claims of the alarmists, there is no physics that requires that it does so.
There is a further problem, which is that the amount we don’t know about the climate far exceeds the amount we do know. For example, here are 2,000 years of Northern Hemisphere temperatures.

Figure 2. The temperature history of the extra-tropical northern hemisphere from 30°N to 90°N. These have about an 80% correlation with global temperatures.
Here are questions that we don’t know the answers to about the thermal history shown in Figure 2:
- Why did the “Roman Warm Period” end around 150 AD and the world start cooling? Why did it not just stay warm?
- Why did the warmth end in 150 AD and not 50 AD or 300 AD?
- Why did the world keep cooling, in fits and starts, until about 550 AD?
- Why did the cooling stop in 550 AD, and not 350 AD or 750 AD?
- Why did the world warm from there, in fits and starts, until the peak of the Medieval Warm Period in the year 1000 AD?
- Why was the peak not in 800 AD or 1200 AD?
- What started the cooling from there to the depth of the Little Ice Age in 1700 AD?
- Why did the cooling end in 1700 AD, not in 1500 AD or 1900 AD?
- Why didn’t the cooling continue until we went into a true Ice Age, as the Milankovich cycles would suggest?
- What made it start warming again in 1700 AD, instead of just staying at the same cooler temperature?
- Why has the warming continued, again in fits and starts, for three centuries since 1700 AD to the present? (Protip—we know that the first two centuries of warming were NOT caused by CO2 increases.)
Given all of that, the idea that we understand the climate well enough to claim that we can predict the future climate a century from now based solely on projected CO2 levels is … well … let me call it insanely optimistic and let it go at that. As shown above, the system is far from as simple as it is claimed. The computer models are far too crude to capture all the complexities. And most of all, we simply do not understand enough about what natural processes made the past temperatures go up and down to stand a chance of predicting the future temperatures.
Sadly, despite all of that, a horde of obsessed folks, both scientists and laypeople, are insisting that based on nothing more than their inchoate fears of some imaginary future Thermageddon, we totally throw out a very successful energy source that has freed humans for the first time in history from lives of endless want and hunger, and replace that proven energy source with untested, unreliable, intermittent energy sources …
And they are still doing this despite the fact that we’ve been warned every year for half a century that the horrible Thermageddon is only a decade or two away. How many failed, cratered predictions will it take for people to notice that the underlying theory isn’t working?
This is madness. What we need to do is to continue to do what we’ve done so successfully in the past—use our proven, reliable energy sources to work to insulate and protect people from the endless, inevitable vagaries of the weather.
That is the no-regrets option. That way, whether or not CO2 turns out to be the secret knob controlling the temperature, we’ll be far less at risk from storms, floods, droughts, and all of the weather phenomena that have been killing people for millennia.
My very best to everyone,
w.
Keeping Things On Track: I am asking that you stick to the topic of the thread, which is the question of what can change the TOA radiation balance. In particular, if you think that there is no downwards radiation from the atmosphere to the earth, or if you claim that radiation from the atmosphere cannot leave the earth warmer than it would be if there were no radiation from the atmosphere, TAKE THAT ARGUMENT SOMEWHERE ELSE. I am NOT interested in getting side-tractored into debating that question on this thread, and I will assuredly snip it if you try. So save yourself the heartache of watching your genius argument disappear into the ether. There are lots of places on the web where you can debate that question to your heart’s content. This is not one of them. And don’t whine if you try it and get snipped. You’ve been warned, it’s on your head, not mine.
My Usual Request: I can defend my own words and I’m happy to do so. I cannot defend your interpretation of my words. So please, to avoid misunderstandings, quote the exact words that you are discussing.
“The important takeaway from all of this is that there is no physics-based requirement that surface temperatures perforce must change when the level of CO2 and other greenhouse gases increases or decreases. “
Perfect timing. I have just today put the finishing touches on my model of the infrared atmosphere. 10 years of research. It builds on the previous 19th-century (thermoelectric) technology-based model, of the same name, only mine includes the measurements by the modern laser-based Raman spectrometer/Lidar.
With this knowledge, there are no paradoxes or contradictions, for instance, that Nitrogen and Oxygen do not absorb or emit infrared radiation when by classical (and quantum) physics all matter with a temperature radiates infrared. There has been a systematic error in the measurement of the infrared. The so-called greenhouse gases are only special by the instrument they are measured by. Blackbody curves do not match the measurements from the Raman Lidars in use. N2 and O2 behave just like other gases.
Your attention can be drawn to the blue and green (Raman detected) lines. These lines are not included in greenhouse theory and as a result, the likes of Nitrogen and Oxygen (99% of the dry atmosphere) are claimed not to be greenhouse gases. By Raman (spectrometer) instruments they most certainly are. The Raman instrument can measure concentrations of the gases and their temperatures. It is superior. If we used it, there would be no debate. Or, put another way: if Tyndall had a Raman spectrometer and quantum mechanics in the mid-18-hundreds, he would have concluded all gases absorb and emit.
Not quite true. Monatomic gases neither absorb nor emit thermal radiation (infrared).
And no atmospheric or climate scientist I know of says that O2 and N2 don’t emit or absorb thermal radiation. They just say that the amount is so small that it can be and is neglected in analyses of the greenhouse effect.
w.
Did you mean to say “neither”, rather than “either”?
I did, thanks, fixed. I hate typos.
w.
Sorry for a newbie question: does the energy absorbed by the atmosphere and re-emitted as blue light heat up the atmosphere?
The atmosphere is far too cold to emit blue light. Think how hot your gas stove flame is when it is emitting blue light.
PCman,
Perhaps you are confusing one thing with another; suggest reading about Rayleigh scattering:
http://hyperphysics.phy-astr.gsu.edu/hbase/atmos/blusky.html
Airglow exists. The processes which cause it also probably cause some warming of the atmosphere. In terms of the total energy budget, it’s going to be a pretty small contribution.
The blue sky is not due to re-emitted blue light. It is blue because sunlight towards the blue end of the spectrum is scattered by air molecules to a greater extent than light towards the red end of the spectrum (Rayleigh scattering).
This is also why, here below the atmosphere, we perceive the sun to be yellowish; in space it is a harsh white. It’s because blue photons have been scattered from the direct path from the sun and into the whole sky.
That is too simplistic:
https://agupubs.onlinelibrary.wiley.com/doi/full/10.1029/2012GL051409
https://www.nature.com/articles/2091341a0
Can be quite significant if there is no water vapor.
Monatomic gases are indeed the exception therefore they really are used as insulators in double glassed windows. CO2 isn’t. No back radiation feature there. That should raise some eyebrows.
Ron, your link says:
Total atmospheric absorption of upwelling surface radiation is ~ 390 W/m2 surface – 240 TOA = 150 W/m2. The contribution of O2 and N2 to that absorption is a total of 0.38 W/m2, or about a quarter of one percent.
I’m sorry, but that is NOT significant on my planet.
w.
See also Table 1.
The whole story about measuring the emitted spectrum from earth and break it down to know spectra from its components is just too simplistic. That is not how mixed gases work. There is plenty of literature that tries to address this:
https://agupubs.onlinelibrary.wiley.com/doi/full/10.1002/2016JD025677
https://agupubs.onlinelibrary.wiley.com/doi/epdf/10.1029/2000JD900699
https://www.osapublishing.org/ao/viewmedia.cfm?uri=ao-36-3-563&seq=0
The interaction of gases and their changing composition is also discussed for the faint sun paradox:
https://www.nature.com/articles/ngeo692
Though if one assumes just way more nitrogen the effect could be also related to atmospheric mass hence higher pressure.
Ron; nitrogen and oxygen are NOT monoatomic gases they are diatomic. Non the less, they do not emit significant energy in the thermal infrared (4-50 microns) which is the spectral region where Earth radiates to space. The DEFINITION of a GHG is any gas that is capable emitting thermal IR radiation. If N2 or O2 were so capable they would by definition be GHG’s and since their atmospheric abundance is so high any talk of CO2 would be irrelevant.
I know, I never said that. I implied the halogens.
And that is exactly the question:
How much are all the gases in air contributing to the spectrum seen from space?
The literature I cited above implies that just looking at each gases emission spectrum individually is too simplistic to give the answer.
I would like to add here that this statement is not true looking at the Raman nodes but only for dieletric measurements. That is where Mr. Macdonald is absolutely right.
Halogens are not monatomic either.
VIII period is what I meant. Those with saturated outer orbitals. Caught me not being a native speaker here.
Just call them noble gases then: the term for group VIII elements.
Willis; there is so much one can say on this topic but one point I keep trying to make:- As you correctly point out the theory of AGW claims rising GHG reduces Earth’s energy loss to space (outgoing long wave radiation or OLR) and that creates an energy imbalance which causes warming. Trouble is, according to NASA OLR has been rising throughout the satellite era. If AGW theory says rising CO2 drives down OLR yet reliable experimental evidence shows the opposite is occurring the theory is disproved.
I know the latest position is that the claims have been modified:- it is now claimed rising CO2 does drive down OLR initially but the feedback causes OLR to rise but it causes absorbed solar radiation (ASR) to rise even faster and that is the net source of the warming. Problem with that, If the feedback causes the source of the feedback to reverse (ie the feedback changes the fall in OLR to a rise in OLR) then what drives the feedback. If the feedback negates the driver for the feedback then there is nothing to sustain the feedback. Indeed if the feedback reverses the sign of the the change in OLR the feedback should reverse as well.
It has a long been hypothesized that a warming planet would likely be accompanied by increases in both ASR and OLR as a result of the lowering of albedo from melting snow/ice. This is true regardless of root cause. And although energy budgets employing the concepts of ASR and OLR did not appear until the 1910’s scientists still understood the crucial role albedo had on the climate system at least as early as the 1890’s. It is really more of a recent hypothesis that the albedo feedback could be negative due to the contribution from clouds. It is important to note that most (not all) global circulation models do indeed predict increases in both ASR and OLR under a scenario in which the Earth Energy Imbalance (EEI) is perturbed initially by GHGs. And the fact that observations show increasing OLR with neutral or even increasing EEI is a line of evidence that supporting these early hypothesis that the albedo feedback would be positive. I don’t think it is enough to falsify the hypothesis that clouds have a negative albedo feedback yet since the snow/ice albedo feedback could simply be dominating right now, but it doesn’t look great for it either.
Ahh bdgwx, the usual explanation. The models predict it so it must be so. Trouble is models can predict anything one likes (just adjust the coding appropriately) and explaining away this paradox is something CAGW supporters would very very much like.
The impact of rising CO2 driving down OLR is supposedly the cause of the warming. But if OLR is not falling, how is rising CO2 driving arming? If rising CO2 did cause a drop in OLR at some magical time in the past but now it does not, then why would the ongoing rise of CO2 matter? One of the things that seems to perennially overlooked is that feedback is a response to stimulus – a change in some output parameter. If the feedback nullifies or even reverses that change in output parameter it negates itself. In this case, if the feedback changes a falling OLR to a rising OLR then the sign of the feedback would be reversed. ie: the feedback driving warming would instead start driving cooling.
As regards snow/ice reduction driving the rise in ASR, lets not forget that the fraction of such cover on Earth is quite small, the change is a small fraction of that small fraction and all this is occurring in a region where insolation is very low. Apart from which, measurements of cloud cover show it is reducing and the pattern correlates to the pattern of warming. NO correlation does not imply causation but it is a reassuring first step. SO now rising CO2 is driving down cloud cover? I thought the claim was that in a warmer world more water would evaporate. Surely that implies more rain and rain only comes from low dense clouds so presumably that would require more cloud cover not less. Yet another paradox. Seems to me, the simple way out of all these paradoxes is simply that the theory of CAGW is wrong.
Sorry bdgwx I simply cannot accept your explanation. To say the models predict it implying its not unexpected is, in my view, a copout -meaningless. The models can predict anything you like, just write the code appropriately.
According to what you are saying the rising CO2 at some time in the past lowered OLR which is got warming going but then feedbacks took over. I wonder when that magical time in the past was? The time when rising CO2 suddenly triggered warming and changed all the laws of cause and effect. But more to the point, feedback is a response to stimulus. If the feedback negates the stimulus then it negates itself. The only stated action of CO2 is to lower OLR. As CO2 rises further and further, according to the theory OLR should progressively reduce more and more. OK, as the temperature rises OLR will increase (Stefan Boltzmann equation) but the rise from temperature should be reduced by the rising CO2 yet it isn’t. The rise in OLR is exactly what one would expect from the rise in temperature given a climate sensitivity of around 3 watts/sqM/C. That suggests rising CO2 has zero incremental impact on OLR.
Positive feedback from snow and ice? I find that hard to credit, firstly because only a small portion of the planet is covered in snow/ice, secondly because the change in cover is only a small fraction of that and thirdly because all the snow/ice is in regions where insolation is very low. More to the point if you look at cloud cover, on Earth, it is falling and the pattern of fall seems to correlate with the temperature rises. Correlation does equate to causation but its a good start. Then again what is cause and what is effect; is changing cloud cover changing temperature or changing temperature changing cloud cover. CAGW suggests the latter whereas I strongly suspect the former.
Basically the claim is “the theory suggests rising CO2 lowers OLR however the fact that OLR is doing the exact opposite is completely consistent with the theory – the models tell us so”. That goes against everything I know abut science.
Donohoe et al. 2014 has a pretty good description of what is going on. Figure 1c and 1d help illustrate how an instantaneous pulse and a 1% gradual release might be expected to behave. The lag is 20 years for the instantons pulse and 80 years for the 1% gradual release scenarios respectively.
Thank you for your reply Willis.
Well, one can radiate N2 in isolation, in the N2-CO2 laser, and it absorbs at its 2338cm-1 mode. This can be done by either electron discharge or by photon. I am saying the reason we think they do not emit is because of our reliance on blackbody curves; they discriminate that mode out. The Raman picks it up and accurately measures the temperature. You need to look at what Raman lidar can measure. By thermopile blackbody curves they should not work. They do. https://www.google.com/search?q=raman+lidar+atmosphere&sxsrf=ALeKk03jSsr-hmfIArGRzRamZUIRBV8gMQ:1627374266309&source=lnms&tbm=isch&sa=X&ved=2ahUKEwjZ97zI6YLyAhVSw4sKHSv6CbsQ_AUoAXoECAIQAw&biw=1920&bih=937
Ah, wondering Willis….still trying to defend Trenberth’s loony Earth Energy Budget diagrams. Here’s the comment that should let you know what’s going on…
https://www.climateconversation.org.nz/2021/02/science-says-change-the-weather-and-break-the-countrys-heart/#comment-1596412
I’m not sure Willis is defending the diagrams. I think he’s saying: suppose NASA’s theoretical energy balance diagrams are correct. Can we jump from that to arrive at AGW? Willis says no.
Also, from a Russian physicist Tatartchenko concerning IR radiation from from water condensation. His claim is as much as 5% of the latent heat is directly radiated during condensation. This is talked about by a few but no consensus that I can find. Believe general models assume all the latent heat is thermalized. He has claimed to measure this by experiment.
Comments and insights would be apprieated. I have tracked references down but do not have at hand right now.
https://www.sciencedirect.com/science/article/abs/pii/S0012825210000176
As soon as the water vapor condenses it begins to radiate … but almost all of that is happening inside the cloud, in air that is moving very rapidly vertically inside the cloud tower. As a result, very little interaction with CO2 happens.
w.
How does that function work in broad relatively static marine layers?
Sorry Willis, I cannot agree with your comment. As water vapour condenses it releases energy essentially all of which is absorbed by the surrounding gases. This causes the air (whether rising or not) to warm and the emission from CO2 is directly dependent on the temperature as described by Planks formula. Thus condensing water vapour warms the air which increases CO2 emission. However this is quite irrelevant because the CO2 emission is again immediately reabsorbed by the CO2 around it. The total absorbance of the atmospheric CO2 column at present is around 3000 abs. That means 1/3000 of the total atmospheric column will absorb 90% of the radiation incident at the CO2 absorption wavelength 14.7 microns.
Conversely, it means the top 1/3000 of the atmospheric CO2 gas column radiates 90%of the emission to space at the CO2 wavelength and the top 1/1500 radiates 99% of the emission to space. Any emission from below the top 1/1500 the of the gas column is reabsorbed before it can escape to space. The only emission to space at the GHG wavelengths is from the very top of the GHG column which is typically at the tropopause or lower stratosphere.
Just as an indication, at sea level any surface emission at the CO2 wavelength is absorbed by the atmosphere within the first 5 meters. Conversely, any downwelling radiation at the CO2 wavelength emanates from within a few meters of the surface.
According to this view the top of the CO2 column is very high in the Stratosphere.
Search of complementary Raman Lidar Images, also in the infrared. Notice the H2O measurements are from the same spectra lines as IR (thermoelectric). Aksi notice the position of the O2 and N2. https://www.google.com/search?q=raman+lidar+atmosphere&sxsrf=ALeKk03jSsr-hmfIArGRzRamZUIRBV8gMQ:1627374266309&source=lnms&tbm=isch&sa=X&ved=2ahUKEwjZ97zI6YLyAhVSw4sKHSv6CbsQ_AUoAXoECAIQAw&biw=1920&bih=937
Take a look at the image in this paper of N2 at those altitudes. https://www.osapublishing.org/oe/fulltext.cfm?uri=oe-22-23-27833&id=303623
CO2 is generally a well-mixed gas, so as your graph shows, it extends way up into the stratosphere.
HOWEVER, the pressure is dropping as the altitude increases. As a result, the absorption of upwelling longwave drops off rapidly with altitude. Here’s data from MODTRAN for the US Standard Atmosphere.
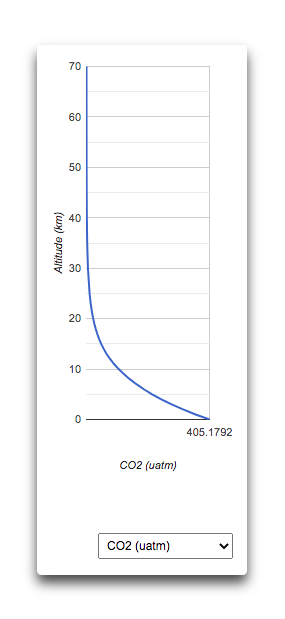
As you can see, by the time you get up to the tropopause at about 15 km, the atmosphere is so tenuous that there’s little CO2 per cubic metre, and thus little LW absorption.
Best regards,
w.
Hi WILLIS; I have to disagree to some extent. AT 15 km altitude the air pressure is around 11 kpa or a bit above 1/10 of that at sea level. If the total atmospheric column of CO2 is 3000 abs then that would imply 30 abs worth of CO2 above the tropopause – far more than needed to block radiation to space. Yet the tropopause is the coldest point in the atmosphere. One has to ask the question how does it get to be and remain the coldest point – surely only by radiating energy to space.
I well remember chemistry experiments in school when we produced CO2 and released it into a glass jar. We then had much fun in pouring it from jar to jar like an invisible liquid and showing that even after a few such pourings, the stream would still extinguish a candle flame. Even at sea level it can remain stratified quite well.
The stratosphere is static due to the temperature inversion and CO2 is far denser than N2 or O2. It is likely that it pools in the lower stratosphere. Is there any evidence for that? Yes, look at the nimbus plot and particularly the spectral notch due to CO2 at 14.7 microns. Note the strange very narrow upwards spike in the middle of this notch indicating emission comes from a higher temperature. Why is it significant? Because CO2 has a narrow central absorption peak the Q peak and two broader but less intense absorption bands on each side (P and R bands). The sharp upwards spike in the middle of the CO2 notch is due to the very last vestiges of CO2 at the higher latitude where it is warmer. Too little to impact the P and R bands but enough to impact the central peak. Its really quite definitive and allows one to see exactly the altitude of the last 1/3000 the of the CO2 column.
Michael, can you give a source for your “abs” or absorbtion path lengths?
If the surface is exchanging radiation with a layer say 10m thick, adding CO2 will vary the layer thickness marginally, but since all the radiation is absorbed, none is reflected, emmissivity is 1 and unchanging.
For the special case where the boundary layer is well mixed and isothermal varying the thickness will make no difference at all. Zero. Hence varying the CO2 level will make no difference.The majority of the Earth’s surface is temperate ocean, with winds and waves. I suspect it approximates the isothermal case.
You would think central questions such as this would be well studied and defined, wouldn’t you?
Google “Heinz Hug” measurement of carbon dioxide absorption
I take it you are responding here to Willis E.’s comment that, in weather systems, “as a result, very little interaction with CO2 happens”. Myself, I’ve noticed that simple models often seem to assume that the ground radiates IR directly upward through a more or less *IR transparent* airspace into a middle layer of the atmosphere, which layer is then suddenly both *absorbent* of IR *and* apt to re-emit IR both upwelling and downwelling from that particular IR “sponge-like” layer.
*Now* you are saying that at “at sea level any surface emission at the CO2 wavelength is absorbed by the atmosphere within the first 5 meters”. So at that point all the simplified CO2 control models ought to be thrown out the window — and if that is fair enough, it is seemingly the same kind of conclusion that Willis is reaching here – !
David, Michael’s claim about absorption is incorrect. See my comment above.
w.
Willis; to use your plea to use the exact words: I did not say all absorbed upwelling radiation is absorbed in the first 5 meters. I said the radiation impacted by CO2 is absorbed in the first 5 meters, Google “Heinz Hug”. The total CO2 column at 400 ppm amounts to 3000 abs. A 1 abs column of gas absorbs 90% of the incident radiation 2 abs absorbs 99% and so on. At sealevel the density of air is 1.225 kg/cubic meter. Thus for a pressure of 101 kpa (10.1 kg/sqM) one would need a gas column (assuming constant pressure) of 10100/1.225 meters = 8244 meters. 1/3000 of this is 2.7 meters. So 90% is absorbed in the first 2.7 meters. 99% in the first 5.4 meters. I consider 99% an engineering approximation of “all”. Your plot is for ALL absorbed upwelling radiation not just the CO2 component.
If CO2 were well mixed throughout the stratosphere the radiation at the CO2 wavelengths would be coming from a region where the air pressure as 101/3000 Kpa or 33 pascals. It is actually coming form a far lower altitude. Yes that number of 3000 is for the peak of the central Q branch and the absorbance of the P and R branches is about 5 times lower so if could be claimed my analysis is not quite accurate. Sure but the main trust still applies.
Thanks, Michael. I took a look at Heinz Hug’s work. I was totally unimpressed. He shows a needle-sharp absorption band for CO2 going from 14.9 to 15.05 microns.
This is VERY different from modern work, which shows a broad, flat-topped band from about 12 to 18 microns.
http://www.astronomy.ohio-state.edu/~pogge/Ast161/Unit5/Images/atmos_mirtran.png
(Note that this is flipped from Dr. Hug’s work, one showing absorption and one showing transmission.)
Since I find the same absorption band in all modern references, I fear that I’m gonna pass on Dr. Hug’s work. Not sure where he went wrong, but every modern reference says he is wrong.
w.
WILLIS; in other responses you mention your career as having some relevance to your competence in a certain area. In this context let me say that while I am now retired I spent over 40 years working as a research scientist/engineer for a large multinational spectroscopy company.
Your comments comparing Heinz Hugs measurements to those of other has a very simple explanation. Gaseous absorbers normally have inherently very sharp narrow absorption bands. However as the concentration increases the bands start to broaden. The absorption peaks are lorenzians which are very close to gaussian in profile. Imagine you pass some electromagnetic energy through 2 identical parcels of gas which absorb. The absorption peak created by the first parcel will be point by point multiplied by the absorption peak of the second parcel. Poorly explained I know but mathematically it is equivalent to convolving the two peaks which in the case of 2 identical parcels of gas is equivalent to convolving the gaussian with itself. When you convolve a gaussian with itself the result is a new gaussian with a larger standard deviation ie: a broader gaussian. This is in addition to pressure broadening and doppler broadening.
In practical terms the gas starts to absorb over a larger range of wavelengths. Its why there is a logarithmic relationship between concentration and total energy absorbed by a GHG. Each convolution broadens the absorption band by about the same amount but each convolution implies a doubling of concentration hence logarithmic. By the way, its also why the comment “that if CO2 is saturated then increasing the concentration cannot have any further effect” is wrong. In fact it would be more accurate to say that a GHG only STARTS to have an appreciable effect after the line center saturates. In the case of CO2 the unbroadened peak is only from about 14.9 to 15.05 and the amount of energy in such a narrow range of wavelengths is really quite small.
Heinz Hug measured the absorption profile at very low concentration and so correctly got the native absorption profile. The ones showing a band from 12-18 microns are taken for the entire atmospheric column of around 3000 abs at the peak of the Q branch. There is no conflict between the two, simply radically different measurement conditions.
In practical terms, the upwelling radiation at the GHG wavelengths from the surface is all absorbed by the atmosphere very close to the surface (and the downwelling radiation comes from those same altitudes). Energy at these wavelengths is continuously emitted and reabsorbed by the gas column (emission and absorption are reciprocal processes and absorptivity must equal emissivity for a given wavelength). The energy density at those wavelengths anywhere in the atmospheric column is simply a reflection of the temperature at that altitude as defined by Planks formula. It is only at the very top of the atmospheric column of the GHG that the energy is able to radiate away to space.
Thanks, Michael. You say:
That’s my point exactly. The way that Dr. Hug measured it has nothing to do with real-world conditions.
I also find nothing about pressure-broadening in his work.
Finally, you say:
Not true. There’s a good explanation here. The money quote is:
Best regards,
w.
Willis: I cannot agree that Heinz Hug’s measurements have nothing to do with real world conditions. He is measuring the inherent absorbance characteristics of CO2 which is the basis of everything else that follows. To use a photographic analogy, this is the “sharp” image. The real world conditions “blur” the image because of concentration broadening and pressure broadening both of which can be determined given the inherent absorbance. To say the sharp image is irrelevant because we only see the blurred version is to my way of thinking questionable. However I can see we are not going to agree on that point, maybe its my spectroscopy indoctrination.
On the subject of emission altitude, what I actually said is the very top of the atmospheric column of the GHG. More specifically – which I made clear in the entirety of what I said was that 90% of the emission to space comes from the last 1 abs of the column and 99% from the last 2 abs. As you can see from the plot you provided for CO2 that’s at the tropopause or more accurately the lower stratosphere. The emission from 17 microns up is due to water vapour not CO2. There are two points to this, firstly water vapour has a lower extinction coefficient cf CO2 (ie; it is not as strong an absorber/emitter at those wavelengths) so the last 1-2 abs will be at a point where water vapour concentration is higher. The claim in what you cite is that this is at about 5 km altitude. Maybe but its still the last 1-2 abs of the column. However there is another factor that needs to be taken into account. Water vapour at those wavelengths (17micron up) has a HUGE number of very closely spaced absorption bands. Think of a picket fence. The result is that the “last 1-2 abs of the column” varies dramatically in height for even very small changes in wavelength. The result is the extremely “noisy” spectrum you see. So if one was to scan with a spectrometer with an exceptionally good wavelength resolution one would see a spectrum varying wildly in intensity with very small changes in wavelength. With a spectrometer of more average resolution you see a low pass filtered version. The filtered version suggests a 5km emission altitude but it is quite possible that the higher resolution version would show little from 5km with some from higher and some from lower.
Next point, your plot shows very nicely the extremely narrow upwards spike in the middle of the CO2 absorption band at 14.7 microns. This is exactly what I was referring to in a previous comment. It is due to the central peak of the Q branch and shows the altitude where the very last bit of CO2 is in the stratosphere. It also incidentally shows that Heinz Hug’s data is of significant relevance even in the real world atmosphere.
Two further points. On the long wave side, the plot you cite shows clearly how the CO2 absorption band overlaps the water band which reduces the impact of further broadening of the CO2 band. It means that only the shortwave side of the band has appreciable impact. Secondly, if the effective water emission altitude is 5km the temperature at that altitude is is higher cf the tropopause so the attenuation of emission to space is less.
Michael Hammer July 27, 2021 12:51 am
Again, as I mentioned elsewhere in this thread, that’s simply not true. Mean free path at the surface is about 30 meters, but only half the radiation is absorbed by that altitude.
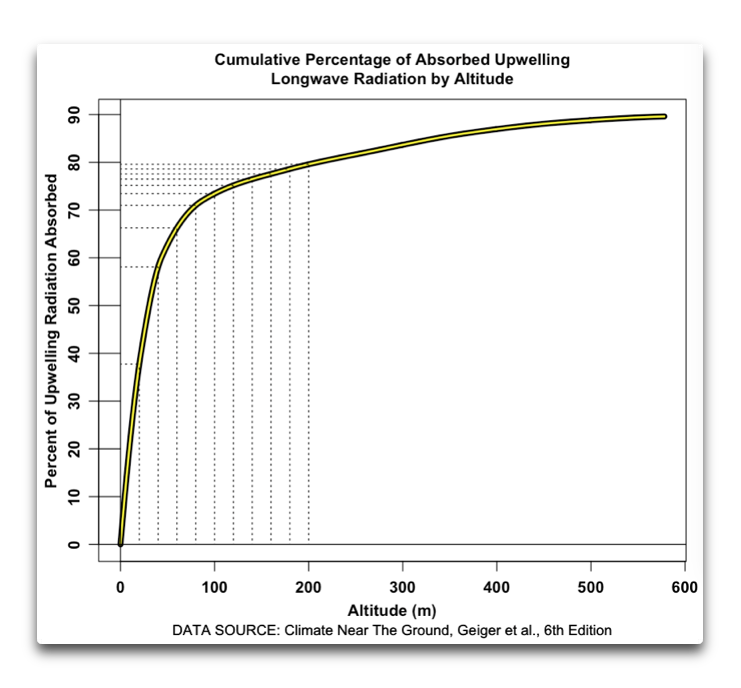
w.
Interesting graph, absorbed LWIR by altitude.
So that would put the main absorbing layer, (and therefore presumably the main emission layer for *cooling* the Earth) at less than 200 meters above the surface! Much less than the height of the CN Tower in Toronto, say.
All kinds of complicated things occur at that kind of height! Clouds, hills, mountains, buildings, not to mention the tornadoes, weather systems and such.
Yet some people presume to know that some special sort of IR modulation by greenhouse gases can throttle the energy flow up or down through that layer in a way that readily predicts surface temperature.
To the climate scientists of the world:
Some people use goat entrails!
Give it a try!
Kudos to Micheal and Willis for this discussion btw. I enjoy it pretty much.
Hi Willis and others.
Let us not forget the puely geometric effects. A surface element emits uniformly over a hemisphere.Consider a hemisphere of height mean free path. One half of it’s area lies beluw latitude 30 deg.Furthermore, by the time an oblique ray travelling at 30 deg reaches a vertical height of MFP it will have travelled twice that far so 75% has been absorbed. Perhaps one third of the photons will be below somewhere in the mid 20s and will travel far and be totally absorbed. Mull on it a while. I suspect the curve now becomes more similar to Hug’s.
If CO2 absorbs so much energy and energy released is also absorbed by CO2 then why is it so cold up there at the top of the troposphere? According to your description it sounds like a ‘runaway‘ greenhouse gas effect up there!
You didn’t cite any published empirical studies to support your claims. Why should we believe anything you say? It’s not as if you’ve not been bombarded with money in the last 13 years (since Obama’s first term). You’ve had massive funding but somehow can’t actually give us the evidence you’re certain is there! What has this funding got us? Fanatical defense of a 53 year old model which is contradicted by real world evidence. The main purpose of the 53 year old model seems to be to blackmail the world, and scare children into suicidal despair. Because you model projections are always wrong. Then again, if the main purpose is blackmail, it doesn’t matter whether you’re right or wrong. It only counts that enough people believe you.
Mark; I can only assume you are confusing me with someone else. I wish someone had been bombarding me with money for the last 13 years but alas no. I am a private retired individual living in Australia. I have absolutely no connection to Obama or any other organisation in the US and the only money I have received was from my salary working for a commercial spectroscopy company..
To move on to your point about the tropopause being cold it would appear you have not understood what I have been saying. To recap; CO2 absorbs very strongly at 14.7 microns. There is so much CO2 in the atmosphere that this absorption band is dramatically broadened to around 13-17 microns. The surface radiation in that band is absorbed very quickly (at very low altitude) by the CO2 in the atmosphere. Throughout the atmospheric column 13 -17 micron radiation is continuously emitted by CO2 and reabsorbed by the surrounding CO2 so that the amount of 13-17 micron radiation present at any given latitude throughout the troposphere is simply determined by the temperature at that altitude.
It is only at the top of the CO2 column that the radiation emitted by CO2 can escape to space. The top of the CO2 column occurs at the tropopause or more accurately the lower stratosphere. Indeed I claim this is not a coincidence and rather that’s why the tropopause is where it is. This radiation to space cools the tropopause and its why the tropopause is so cold. This radiation to space also forms the “cold” junction of a heat engine with the surface being the hot junction. That allows the atmosphere to function as the working fluid of a heat engine. In other terms it allows convection to occur which is the basis of weather on Earth.
I admit I had thought that the tropopause was also the top of the water vapour column since the troposphere is rich in water vapour whereas the stratosphere is extremely dry. That meant that not only CO2 was radiating to space from that altitude but water vapour was as well ie: the bulk of the GHG’s. Willis however has suggested strongly that emission from water vapour comes from far lower altitudes. If that were true (it would mean water vapour had a far lower extinction coefficient than I would expect) it would mean that CO2 alone was dominantly responsible for weather and climate on Earth as we know it since it alone was setting the tropopause altitude. Why; because while convection drives the warm air upwards it has to cool before it can descend again and the point where it cools enough to do that sets the top of the convective loop. I find Willis’s claim that water vapour emission comes from 5km altitude difficult to accept partly because I doubt that the CO2 emission alone is enough to drive the tropopause temperature so low and partly because if water vapour radiated so strongly from 5km altitude I would expect to see a secondary convective loop with a top at 5km altitude and to my knowledge there is no such loop. I suspect the 5km is a furphy due to the huge number of closely spaced absorption lines from water vapour. These lines are so close together that the instrumentation blurs them giving the impression that what is really a bimodal emission pattern looks like an average emission pattern from a warmer region. However I do not have data to back that up and I do not dismiss Willis’s input so quickly. His input deserves further thought and research.
Please accept my apology for caricaturing and dismissing you. Here is my point of disagreement:
You said: “CO2 absorbs very strongly at 14.7 microns“. OK, I agree. And you said essentially all latent heat released due to water condensation is emitted as radiation by water, and absorbed by CO2.
So: the effect of (CO2) absorbing radiation is to energize a CO2 orbital.
The energized orbital can decay (emit a photon), or it can be thermalized (when the CO2 molecule collides with another molecule of air)
Which, in practice, means collides with O2 or N2. The net effect is an increase in KE of the air.
The process is 2-way. CO2 can also absorb KE (from other air molecules, by collision; this increase in CO2 KE can excite an orbital; which can decay to emit a photon; or be thermalized again.
But if the energy stays (is not emitted) then it must manifest itself as an increase in KE of the atmosphere at that location. Which is an increase in temperature.
When you say “essentially all” the energy is absorbed, you’re saying it all becomes KE, which means the air temperature increases.
Yet it is cold up there!
Hi Mark; copying your words from above “And you said essentially all latent heat released due to water condensation is emitted as radiation by water, and absorbed by CO2. So: the effect of (CO2) absorbing radiation is to energize a CO2 orbital.”
No I did not say that; infact I have not mentioned latent heat at all so far. However let me correct that deficiency now. When water vapour condenses it indeed releases latent heat – agreed. Some of this heat may be in the form of infrared radiation but much will be simply as kinetic energy. Either way it will be absorbed by the gas around it (not only CO2) and will end up making that gas warmer – which is more or less what you said so again I agree.
The warmer air continues to rise getting drier and drier as the water vapour condenses out and expanding as it rises which causes cooling. This continues until it reaches the top of the GHG column at which point the GHG components radiate energy to space causing the air to lose energy. The thermal lapse rate is a by product of the expansion as the air rises however it is only maintained while the air is rising. If there were no GHG’s in the atmosphere there would be no way for the air at the tropopause to lose energy. If it could not lose energy it could not descend again and that means convection would stop. There would be no rising air expanding as it rises so no lapse rate. The atmosphere would eventually become isothermal – same temperature at all altitudes. With no way to lose energy, water vapour would not condense so no clouds and no rain. The atmosphere would become saturated wrt to water vapour. Also without convection dust would settle out and there would be no wind ie: no weather A static atmosphere.
In that case there would be no energy transfer between surface and atmosphere and the surface would radiate to space as a black body. The only difference between Earth and Moon would be the length of the “day”. Earth’s is 28 times shorter but one only has to see how fast concrete or beach sand or even dry soil heats up on a sunny summers day to realise that typical surface time constants are very much shorter than 24 hours. So, while the Moon at noon gets to 116C Earth would still get close to 100C and of cause FAR FAR below zero at night. By creating the conditions where convection and thus weather can occur, GHG’s dramatically ameliorate temperatures on Earth. Raising minima and lowering maxima. Given that why would one not assume that a slight increase in GHG will simply further ameliorate temperature making Earth even more benign?
By the way I think you may be confusing atomic emission and molecular emission. Atomic emission involves electrons moving from one orbital to another. Molecular emission involves vibrations between atoms within the molecule. Thermal emission is all about molecular emission. Atomic emission is typically MUCH shorter wavelength emission in thee visible or often in the ultraviolet. It is not relevant to what is happening in our atmosphere because the gases are nowhere near hot enough for it to occur.
kindest regards
“If it could not lose energy it could not descend again and that means convection would stop. There would be no rising air expanding as it rises so no lapse rate. The atmosphere would eventually become isothermal – same temperature at all altitudes.”
Not all altitudes. If Michael looks at the 1976 standard atm., the midlatitude tropics atm. DOES become isothermal above the tropopause by measurement for about 9km of height due to ~ceasing convection since the fluid becomes warmed to a great extent from above. This is why passenger jets like to fly in the smoother air at those altitudes.
If there were no GHGs (meaning no IR active gas) in the earthen atm. thereby reducing the IR opacity, there would still be a lapse rate up to the lowered tropopause from the ~255K median surface (at same albedo) where the fluid would again become warmed from above, convection would cease, and an isothermal atm. become established for a comparable height above that new tropopause.
“Atomic emission involves electrons moving from one orbital to another.”
Atomic emission also occurs due to atomic spin being quantized with nonzero radiant intensity at all temperatures, at all frequencies. All the time.
Trick, you have completely missed the point. The lapse rate is maintained by convection. No convection no lapse rate as you pointed out yourself when you mentioned the lower stratosphere has no convection and is isothermal. What I was trying to explain is that without GHG’s allowing energy loss to space from the tropopause convection would stop and with it the lapse rate would disappear.
Why can I say that with such confidence? Because the atmosphere is the working fluid of a gigantic heat engine converting thermal energy (sunlight) into mechanical energy (wind, rain etc). The laws governing heat engines were described by Carnot back in the 18th century. 100% efficiency is not possible, there has to be a hot junction where heat enters the working fluid and a cold junction where heat leaves the working fluid. The presence of GHG creates the cold junction (it allows the air at the tropopause to lose energy so it can descend again). No GHG no cold junction and thus no heat engine ie: no convection.
I have no idea what point you are trying to make with your atomic emission comment. Are you suggesting thermal emission IS atomic not molecular because if so you are wrong?
“…the lapse rate would disappear…No GHG no cold junction and thus no heat engine ie: no convection.”
There is still convection at the surface with nil GHGs because there the earthen atm. would still be warmed from below in a gravity field.
Therefore, an earthen T(z) lapse rate starting from about 255+K (same albedo) would exist from no IR active gas earthen atm. surface up until the much lower tropopause where the atm. would turn isothermal(z) with nil convection in the stratosphere for some height. The weaker atm. heat engine would still operate driven by N2,O2,Ar.
The point about atomic spin (rotation) is to show that unique mode of atomic absorption/emission also exists in addition to your “Atomic emission involves electrons moving from one orbital to another.”
Thermal is short for therm-odynamic intern-al so thermal gas emission can be both from atomic and molecular atm. constituents.
Please be more specific with your “essentially all” comment. What proportion of the energy, “which the surrounding gases absorb“, is EMR, and what part is KE? Cite the studies which show “essentially all of which is absorbed by the surrounding gases”
“As water vapour condenses it releases energy essentially all of which is absorbed by the surrounding gases“.
Whether it’s kinetic energy or it is electromagnetic radiation, it’s absorbed by the surroundings. Where else can it go?
w.
Oh Mark I meant to mention but forgot. In case you are in any doubt, I do not believe in the theory of CAGW. I, apparently like you, believe that the theory is wrong and strongly suspect that it is being promulgated for political ends. However I am at heart a scientist and I would like to understand exactly what is going on in our atmosphere and the role that GHG’s play. That is why I put comments on blogs such as these in the hope that some discussion can ensue. Unfortunately, what I find nearly all the time is that such comments are dismissed with almost contemptuous speed and casualness. Depressing but I live in hope.
I have serious doubts that GHG are necessary for a lapse rate or energy loss to space. Every matter can and does radiate IR.
If you want to follow and or help my work, https://www.facebook.com/groups/2232562903730446
Maybe go back to here:
https://euanmearns.com/periodicities-in-solar-variability-and-climate-change-a-simple-model/
Warming is simply due to both Eddy and Bray moving to a maximum.
These power flux “energy budgets”/balances are garbage.
Besides being thermodynamic rubbish they don’t even meet generally accepted accounting principles.
And don’t say “they ” measure it.
IR instruments measure temperatures and calculate power flux assuming emissivity and assuming 1.0 is assuming wrong.
Nick posted: “IR instruments measure temperatures . . .”
To the best of my knowledge, IR instruments derive temperature readings by measuring IR radiation. Since most IR instruments have optical lenses (some even provide 2D images!) I am very interested as to how you think they directly measure temperatures (of material objects) without physical contact.
Gordon, EVERY instrument that measures temperatures does it with some proxy, whether it’s the expansion of mercury or the unwinding of a spiral bimetallic strip or the amount of IR radiated … so I’m not clear what your objection is.
w.
I tilted at Nick Schroeder’s reply to me above wherein he gives these two back to back statements:
“And don’t say ‘they’ measure it.
IR instruments measure temperatures and . . .”
(my underlining emphasis added)
That was, and is, my objection.
Actually, Willis, I had to do some Web searching to test if your statement “EVERY instrument that measures temperatures does it with some proxy” is correct. I found a special limit case where it appears to be false, as stated by science researchers.
From How are temperatures close to absolute zero achieved and measured?
(https://www.scientificamerican.com/article/how-are-temperatures-clos/):
“How do we measure very low temperatures of atoms? One way is to simply look at the extension of the cloud. The larger the cloud is, the more energetic the atoms must be, because they can move farther against the magnetic forces . . . Because the magnetic fields are precisely known, the size of the cloud is an absolute measure of the atoms’ energy and temperature.
“Another method to determine temperature is to measure the kinetic energy of the atoms. For that, the magnetic trap is suddenly switched off by switching off the current running through the magnet coils. In the absence of magnetic forces, the atoms simply fly away, and the cloud expands ballistically. The cloud size increases with time, and this increase is a direct observation of the velocity of the atoms and therefore their temperature.“
(my underlining emphasis added to the above quote extracts)
Despite this nit picking on my part, your statement is true as applied to “real world” thermometry.
In one case they are actually measuring cloud size, and in the other they are measuring cloud expansion rate … both of which are proxies for temperature.
w.
The proxies they use include complex atmospheric computer models of what, they call, a greenhouse gas effect. These proxies (the computer models) disagree with other, simpler, proxies.
Given their most important proxy is wrong, why would I trust their other proxies?
They are all designed, fabricated and calibrated around thermopiles/thermocouples which have a temperature/mv relationship NOT a power flux.
There’s a target thermopile and a reference thermopile and the calibration procedure assumes the calibration source body is black which is not the case except in a vacuum.
The IR instrument can be spoofed to display energy that is not there.
See slide.
Further more:
The earth is cooler with the atmosphere/albedo not warmer. W/o the atmos/albedo earth becomes much like the moon.
GHGs require “extra” energy upwelling from the surface radiating as aBB.
As demonstrated by experiment such is not possible.
https://principia-scientific.org/debunking-the-greenhouse-gas-theory-with-a-boiling-water-pot/
“The principle of science, the definition, almost, is the following: The test of all knowledge is experiment. Experiment is the sole judge of scientific “truth.””
Richard P. Feynman, “Six Easy Pieces”
Nick, you and thermo and heat transfer textbooks have obviously not been in communication since around the 1980’s when it became more topical in engineering courses to explain how microwave ovens heated food and CO2 lasers can cut steel despite their cold temperature and calculably cold radiative temperature as well….
What wavelength does the IR thermometer respond to?
Hint—It is not anywhere near the principle CO2 absorption bands.
Say what? The IR thermometer doesn’t respond to one wavelength. It measures the wavelength (frequency) and converts that to temperature, including in the principle CO2 absorption bands.
w.
temperature is immaterial to the energy state of the atmosphere… Remember that our 53°F planet is sitting in a million degree plasma that can’t even raise the 45°F black-body temperature at the same orbit… and they’re all the same energy level…
Prjindigo; temperature is simply a measure of the average kinetic energy of the atoms and molecules making up the environment. The total energy available however also depends on the number of atoms and molecules. If this is very low the temperature may be high but the total energy available could be extremely low.
There is no stuff or KE in the void of space so temperature is meaningless.
But radiant energy has value.
How do we know?
Put stuff in the way.
Earth sits in a 394 K, 121 C, 250 F solar wind.
That’s 1,368 W/m^2 plus S-B.
Nikolov knows that.
Kramm U of AK knows that.
UCLA Diviner mission measures that.
That’s why the ISS and MMU have air conditioners.
And without an atmosphere or GHGs or albedo that’s what the earth would see.
20% to 30% more kJ/h and hotter not colder.
So Nick, as an engineer, you should know what I’m talking about….Does the ISS air conditioner have a condensing temperature above 121C so it can release heat to the solar wind….or is the condenser on the shady side of the ISS where it can radiate heat to outer space ? Careful now, it might be a gotcha question.
Nick S. I don’t understand your declaration. Can you explain what you mean? Especially, why would observations of a natural system meet or track with a set of rules contrived for human commerce? Perhaps I misunderstand your use of the terms?
That pic is too small and unreadable
retract I didn’t see its clickable
Click the cursor on the thumbnail and it should maximize.
ESC to minimize
If it doesn’t, I’d say it’s your [problem.
Nick, I was the Chief Financial Officer for a company with $40 million in annual sales, so I can assure you, I understand GAAP very well. Please point out where the balances shown in Figure 1 contravenes those principles?
As to them being “thermodynamic rubbish”, sorry, not the place to disput that.
w.
The 396 double dips doubling the energy in the system.
The net/net 160 arrives at the surface. Under NO circumstances can more than 160 leave.
Except maybe through a second set of books in the Caymans.
BTW 396 is more than arrived from the sun in the first place. Good trick.
When I turn on a 100 watt light inside my bedroom, the whole room becomes very bright.
I can easily read even though the part of the bed behind me is dark wood.
That 100 watts of light is bouncing all around the room who knows how many times, becoming a diffuse and bright general light.
When I take a 100 watt lamp outside at night to my driveway, it is not enough to read by even if I stand a few feet away from it with the light shining right on a book.
Try it sometime.
Anytime.
The same light that makes a room bright, does almost nothing outside at night.
Because there is none of it bouncing back.
If I aim a light meter at the walls and the floor and the ceiling and he bed covers and the tables and the lamp shades (the ones on the unlit lamps) I have a whole bunch of square meters of bright surfaces, which adds up to far more than the number of lumens coming from the bulb.
How so?
Reflections and whatever else causes light to bounce around a room.
Probably some amount of fluorescence from anything washed in laundry detergents, maybe from the paints…
I suspect that since I have a net downvote total, the point I was making, somewhat obliquely I confess, was not made well.
Inside a room, light reflects around.
Outside at night, light does not.
But IR does reflect, and gets re-emitted, etc.
This is how it can be that we have what Nick Schroeder refers to as “double dips.”
They are not double dips.
They represent the fact that the same energy can flow this way and that on it way from where it came from to where it is ultimately heading.
Has anyone actually taken a regular lamp outside and placed in in a dark place at night, where there is nothing to reflect any of the light?
Inside it reflects all over the place, and 100 watts is enough to light a room very well.
Paint the walls and floors and everything in the room flat black, and that light is not doing so much anymore.
Radiative gasses like H2O and CO2 cause IR to bounce around.
The mechanism by which they redirect it may not be exactly the same, but they result in the diagrams in question.
I am no big fan of these diagrams, but they are what they are.
Consider another analogy, this time a river.
The river flows by a point A where there is a device that measures the total flow past that point.
Half a mile downstream, the river forks into two equal streams, one of which continues on in the same direction, and the other travels in a big loop that doubles back and rejoins the river upstream of point A, resulting in the water that looped back being counted twice by the flow measuring device.
Except for the fact that it would require some sort of impeller on the looping segment of the river to keep it flowing in the loop, this situation is not an impossibility, and yet it would not result in water appearing from nowhere.
The water flow two miles upstream would match the flow going downstream after the fork, but at point A there would be a larger flow of water than was coming down the river from the source.
Anyone who cannot understand this just needs to think harder.
Nicholas: “the point I was making…was not made well.”
Your point was not made very accurately either which may have caused some proper minus red selections.
In your room (at room temperature on Earth surface) with the 100W incandescent light bulb serving as the only illumination of ordinary surfaces, sure, the shiny polished opaque metal parts reflect a lot (maybe around 90% reflectivity) but the other opaque surfaces are only reflecting about 5-10% of incident light. About 90-95% incident 100W light is absorbed by each non-shiny object then emitted (generating the color we can observe of each surface) at each surface’s emissivity factor at each frequency of illumination.
Nick Schroeder has long missed that emissivity is not net of absorptivity since for a 100W incandescent illuminated object its:
emissivity + reflectivity + transmissivity = 1
for your ordinary upholstered room chair or couch, and wood desk/table, and the solar illuminated L&O surface of earth observed from orbit, it then follows approximately integrated over all view angles:
0.95 + 0.05 + 0.0 = 1
…. except in the work of Nick Schroeder where emission is used net of absorption.
You can prove this to yourself by obtaining a $30 IR thermometer (e.g. Ryobi IR002) with fixed emissivity factor of 0.95 reading out room temperature for most objects in your room except possibly some of the very shiny reflecting ones with a lot of surface reworked from natural material.
I have several of them of varying quality.
Also light and moisture meters, and all sorts of other gadgets.
I am a gadget lover.
The fact remains that a single light bulb will illuminate a fairly large room well enough for the light to be adequate for any sort of regular task.
And the same bulb outside at night with nothing to reflect light back is not even sufficient for things like adjusting a sprinkler from a few feet away, or reading the directions on the package.
I came to this by being outside a few weeks ago and finding that a regular light bulb will do very little outside.
I also have all sorts of flashlights and spotlights, which is what I needed to use to get anything done.
Maybe this is not a very good analogy, but something is going on with light inside a room with white walls that is not going on outside at night, or inside in a room with dark walls.
BTW, I also painted one of my bedrooms a medium shade of blue last year, and found I need a lot more lot than I needed in the same room when the walls were white.
As for accuracy, all I did was describe a subjective effect, so I do not know what you found inaccurate.
I said nothing about emissivity or any of that stuff.
My sense of it is the main controversy here is that some people utterly reject notions of IR shining down from the sky.
Radiative gasses are a fact.
Trick,
This is the comment I was addressing, trying against hope to get Nick S to have an epiphany and finally after all the endless conversations and explanations, let him find a way to conceptualize in his mind where he is going wrong with this notion that back radiation violates conservation of energy:
“The 396 double dips doubling the energy in the system.
The net/net 160 arrives at the surface. Under NO circumstances can more than 160 leave.
Except maybe through a second set of books in the Caymans.
BTW 396 is more than arrived from the sun in the first place. Good trick.”
What do you think about the river analogy?
A tabletop apparatus can be easily set up to show how a certain flow rate in and out of a system can nonetheless result in places in a system where the rates are higher than the rate in and the rate out, without violating conservation of mass.
No water has to appear out of nowhere, it simply has to cycle around in between the entry point and the exit point.
Nick S does need an epiphany to accurately comment on measured emissivity of natural objects like earthen L&O surfaces which has had plenty of time to occur but hasn’t and shows zero signs of ever happening.
For you, my point is to consider the object’s emissivity (which I agree you didn’t say anything about) as the reason for seeing objects in your 100W bulb illuminated room and not nearly as much (1/20th) seeing the object’s reflectivity (scattered illumination right back into your eyes).
Your river flow comment does not occur naturally; your analogy will need some sort of energy consuming pump built for the water to flow uphill and rejoin the river upstream in which case the spec.s of the pump are important and unspecified. You might consider the natural backwater eddy or flow around a stationary rock creating upriver flow.
Good you have the instrumentation; point it at both your blue and white (or matte black) walls – it will read ~room temperature. Go outside in the dark and point it away from the 100W bulb, it may not read ambient depending on the optical path length it is observing and any object that may be in its view that you may not see since you are blind to the emitted IR.
Yes, all gases have non-zero radiant intensity (emission) in the IR at all temperatures including the noble gases (e.g. Ar) as found in the 1930s when that research was of interest (and now forgotten). Why? Their spin was found to be quantized.
Noble gas particle translation however is not quantized but does affect their frequency of illumination and their emission. Noble gases are also translucent affecting the optical path length (for relatively low) emissivity. They also exhibit collision induced absorption. Some gases are IR band active however the noble gases are not.
They look like double dips to me. Especially as no scientific study shows the surface warmed by GHG.
Modelers say: 396 hits the surface. 160 comes from the sun. Which implies 236 comes from elsewhere, from the GHGs. Given the average temperature at the surface is 288C. 160/396, 40% of that must be due to the sun, and 236/396, 60%, due to the magic of GHG. So why do modelers say GHG only warms the surface some 32C above what the sun alone does? Now the warming effect is clearly not linear (as I implied), but it seems to me, the majority of the warming is GHG (in the models), so why is it only warming by an additional 32C? 32 is only 32/288, 11%.
In short, modeler’s own logic is senseless.
”….double dips…” no it doesn’t, the net fore-minus-back radiation is only about 60 watts…..390 is what it has to be for the surface to radiate at its known 15 C….. and the back radiation is what it has to be for the “sky” to appear to be 4 C from the ground….no double dipping involved….and the IR instruments are proveable against “normal” thermometers.
So if you have such difficulty understanding basic Stephan-Boltzmann physics, probably you need to just accept that there is about 60 watts going from the sun-warmed surface to the cold sky….and leave it at that. However people who believe that a flat Earth is a close enough approximation for their purposes have a lot of difficulty if their job involves Earth-Moon missions….
390 is what it has to be for the surface to radiate at its known 15 C…
With a 1 emissivity.
Actual emissivity is 0.16 for 63 or 56 or whatever.
Hmmm… no, IR emissivity of the surface of soil, water, leaves, most painted surfaces is about 0.95. Which is why IR temp guns usually come with that emissivity pre-set….which for $25 you could verify is correct by taking the temperature of a few room temperature surfaces in your house, then reset the emissivity for polished metal surfaces, which can be as low as .05, and prove again your IR gun gives the correct temperature for those surfaces.
Saying the actual emissivity of the planet surface is 0.16 is simply using the net radiation number incorrectly.
No it doesn’t. You’re diagram says IN = 161 + 342 = 503. If you accept the 1LOT and want the surface to be in a steady state then OUT would have to 503. It turns out that 84 + 20 + 398 = 502 leading to about +1 W/m2 as a modest imbalance. All energy is accounted for in this diagram. There is no violation of the law of conservation of energy here.
IN = 161 + 342 = 503
This is nonsense.
What is nonsense is the idea that all the energy that comes to the Earth from the Sun is on a one-way, never-look-back journey that does not allow for backflows and reservoirs to exist.
It occurs to me that economics actually provides an excellent example that disproves Nick S’s contentions that energy is being created from nowhere.
It is the simple fact that when one person earns money and spends it, the person or company that is on the receiving end of the transaction then spend it themselves, and whoever gets the money from that second transaction spends it again, and so forth and so on, on and on.
How fast all of this occurs is sometimes referred to as the velocity of money, IIRC, and represent a multiplier effect on the total amount of money in circulation.
In fact, the very word “circulation” alludes to the fact that money cycles through the economy.
Far more money can get spent in a year than is actually in circulation, because the same dollars loop through the economy, the same way that the energy in IR photons loops through the environment of the Earth’s atmosphere and oceans, between when it is emitted by the Sun, intercepted by the Earth, and ultimately shines back out (radiates) into space.
Nick posted “These power flux “energy budgets”/balances are garbage” followed by a diagram of his choosing.
Nick, be that as it may, what about the diagram Willis posted as his Figure 1?
They are ALL clones of the K-T diagram, mother of them all.
They are properly termed Sankey diagrams after the Irish engineer who used them to describe the thermodynamic heat flows for a steam engine.
Interesting, D., I’ll have to look that up.
Thanks,
w.
I wonder…. who might be using a VPN proxy to multiple down-vote those who find fault with Nick’s quackery.
Can I get grits with that ad hominy?
I think such diagrams began appearing in Earth science textbooks about the time Kevin E. Trenberth was born (he is 76).
I’d start a search for the 1st Edition of Arthur Strahler’s (Intro to physical geography), 2nd Edition in 1970. Therein there might be a citation.
No, these are not.
Go to EIA.org where they have real Sankey’s.
Nick, you claimed of my diagram: “Besides being thermodynamic rubbish they don’t even meet generally accepted accounting principles.”
I pointed out that I was the CFO of a company with $40 million in annual sales. I represented the company through three annual audits done by Price, Waterhouse, Coopers, which was plenty of fun.
In addition, I also worked as a tax prepared for H.R. Block; for three years I was the accountant for the Farallones Institute (a 501 3c non-profit); I kept the books for the Solomon Islands branch of the Foundation for the Peoples Of The South Pacific (which involved accounting to the donors for grants in four different currencies); I did all the accounting for the Liapari branch of Liapari Limited (including the fuel depot), and I passed the IRS test to become an IRS Enrolled Agent.
As a result, yes, I’m quite familiar with GAAP.
So I invite you to demonstrate EXACTLY where and how Figure 1 doesn’t “even meet generally accepted accounting principles”. Please show your math.
I’ll wait.
w.
(I must say, I find it quite amusing when someone assumes I know nothing about a specialized subject, so they make overbroad claims that I’m wrong, wrong, wrong …)
160 enter, under NO circumstances can more than 160 leave.
The 396 or whateveh is fake, left there by your uncle Vinnie from Las Vegas. Don’t touch it, not yours.
Not so. It is well known that Earth generates heat internally from from decay of radioactive materials in its mantle and crust, as well as from still losing “primordial heat” since its formation.
“The flow of heat from Earth’s interior to the surface is estimated at 47±2 terawatts (TW) and comes from two main sources in roughly equal amounts: the radiogenic heat produced by the radioactive decay of isotopes in the mantle and crust, and the primordial heat left over from the formation of Earth . . . Estimates of the total heat flow from Earth’s interior to surface span a range of 43 to 49 terawatts (TW) (a terawatt is 10^12 watts). One recent estimate is 47 TW, equivalent to an average heat flux of 91.6 mW/m2, and is based on more than 38,000 measurements. The respective mean heat flows of continental and oceanic crust are 70.9 and 105.4 mW/m2.” — source: https://en.wikipedia.org/wiki/Earth%27s_internal_heat_budget
Sure, 70 and 105 mW/m^2 are a relatively low power fluxes compared to that arriving from the Sun, but this heat flow OUT of Earth to deep space clearly falsifies your statement “160 enter [from the Sun – GD}, under NO circumstances can more than 160 leave.”
N.B.: since you did not specify units associated with your value of “160” in your post, i have no idea where that value came from or what it means . . . but I ASSUME it is your assertion of net incoming solar power flux absorbed by Earth . . . not that it matters to the main point being made in this response.
Nick, you assume the surface of the Earth is the reference point. The atmosphere (including clouds) is the reference point for energy transfers in and out of our climatic system. TOA and the Earth’s surface are simply the boundaries at which the atmosphere interacts.
From an energy standpoint at TOA, one has SW(sun) = SW(reflected) + LW(atmosphere). At the surface, one has SW(net) + LW(atmosphere) = Sensible + Latent + LW(surface). Between the two boundaries, our atmosphere (including clouds) has a hellava lot of energy transfers taking place and loads of work being done. Get over it.
I can’t find the thin layer of dead dinosaurs… you sure that’s the K-T?
Or this one.
They are all basically the same.
WRONG!!!
So erase the bottom right arrow and change the up arrow to 58 watts. That’s the same net IR upwards. This should satisfy your concerns. However, if you are teaching a class of 2nd year engineering students, some of them will say “but the Earths surface averages 15 C so must radiate about 390 watts worth of photons according to last semester’s physics class…where have they gone?”….You will find yourself talked into a corner very quickly with your dubious 1890’s concepts.
averages 15 C so must radiate about 390 watts worth
With 1 emissivity which I have noted elsewhere and demonstrated by experiment is wrong.
I get it; you believe the emissivity of the Earth’s surface is less than about 0.95. Somewhere around 0.16?
Willis’s fig 1. is better than Trenberth’s or NASA’s ….or anyone’s.
Definition of emissivity
: the relative power of a surface to emit heat by radiation : the ratio of the radiant energy emitted by a surface to that emitted by a blackbody at the same temperature
K-T diagram
“…the ratio of the radiant energy emitted by a surface…”
63 W/m^2 at 16 C or 289 K
“…to that emitted by a blackbody at the same temperature…”
396 W/m^2 at 16 C or 289 K aka the same temperature
63/396=0.16
Looks to me like it fits the definition like a glove.
Nick: If you had paid any attention in the heat transfer class you claim to have taken, the first thing you would have learned about radiative heat transfer is the principle of “radiative exchange” and the difference between gross and net radiative transfer.
You finally cite a reasonable definition for emissivity — after getting it completely wrong for years — but still fail to realize emissivity is about the gross radiative output. It has nothing to do with how much it is absorbing.
Where has your 63 W/m^2 been measured?
Anybody who has ever foolishly stepped with bare foot on hot beach and by reflex immediately lifts that foot just 2 inches (3.08 cm for you intellectuals) to cool it off knows that that classic energy budget diagram grossly underestmates the role of direct conduction of energy to the air. It ain’t even important if N or O absorbs infrared or not in affecting the weather.
5.08 cm for us non-intellectuals.
For the -2 voters: 2.54 cm/in. 2 in = 5.08 cm
Thanks for pointing out the typo- while missing the meager attempt at humor.
It seems that after 30+ yrs of discussions on GW/GHGs, everyone concentrates on the Stefan-Boltmann & QM aspects while ignoring the much more basic concept of kinetic theory of gases vis-a-vis atm temps. If non-GHGs can’t absorb significant EM rdiation, then how does all that N & O (99% of atm) stay above absolute zero?..It’s conduction & convection that determines weather & climate, and we have differential weather around the planet due to that differential mixing. …Radiation out the TOA is the ultimate .factor in maintaining balance, but Willis; contentions in the article are important details of that, and he’s quite correct.
so how many energy reach the earth surface ?
About 169 W/m^2 according to Figure 1 of the above article. To convert to units of energy, multiply by the cross-sectional area of the Earth (this will be an approximately due to different path lengths, aka “slant ranges” of sunlight passing through the atmosphere going from the equator to the poles).
Also assumes an average Earth albedo of about 105/342 = 0.31, but this can vary significantly day-to-day, month-to-month, and year-to-year, especially considering global volcano activity.
More to consider.
And more.
The cooling stopped around AD 1700 thanks to the end of the Maunder Minimum.
The Holocene still has around 3000 years to run, based upon the tilt cycle. But if you go by the eccentricity cycle, it could be a super interglacial, like MIS 11.
John, the only way your Maunder Minimum comment would make sense would be if the cooling had started at the start of the Maunder Minimum … but it didn’t.
w.
The answers are in the second law of thermodynamics
S=Kb ln W
Unfortunately W is the elephant in the room. Any macro-state in the set of questions is defined by number of the micro-states permutations (W), number of which is next to infinity, no supercomputer would ever be able to crack. We will never know the true answer to any in your set of questions.
I’ve said it before, invoking the second law of thermo in the issue of AGW shows that person does not understand it. The first law is ALL that is needed.
Willis,
An excellent article, all around.
Just two relatively minor nits:
1) Your Figure 1 clearly shows the flows (and net balance) of power fluxes, in units of watt/m^2, and not the “energy balance” of the planet as claimed in the Figure 1 title. Power flux values at TOA are more closely aligned with the term “radiative balance”, but the diagram also contains processes that are not at all “radiative”. Yes, I do know that there are means to relate “power flux” to “energy” (“radiative energy”), but nevertheless they are not the same thing.
2) You clearly pre-establish Figure 1 to be representative of “equilibrium” values, but do not comment that this condition is never actually achieved in the real world . . . the heat capacities of the world’s oceans alone introduce time lags that prevent achieving “balances” in the noted power flux flows. Likewise, long term variabilities (order of centuries to millennia) time constants in factors such as total absolute humidity—and likely resulting cloud coverage—in the atmosphere, ocean “global” circulation patterns, CO2 solubility in ocean water as a function of temperature, constant-temperature enthalpy changes (latent heat) associated with ice-water phase change, etc., pretty much rule out equilibrium conditions ever developing. Nevertheless, useful insights can be obtained by considering a theoretical equilibrium situation, as you have done above.
Thanks, John. Yes, Figure 1 shows “the flows (and net balance) of power fluxes, in units of watt/m^2”. Not sure why that’s a problem. I don’t think I said that all the processes are radiative, in fact I described latent and sensible heat transfers in both the figure and the text. In line with your comments, however, I’ve changed the description of Figure 1 to read “energy budget” rather than “energy balance”.
And while you are correct that an equilibrium never exists in a single point in time, over any period longer than a year there is a clear steady-state. As you point out, this can slowly change over time, but if the imbalance were at all sizeable, we’d have frozen or boiled long ago.
Thanks for your comments,
w.
Willis, I appreciate the reply.
Your comments “. . . over any period longer than a year there is a clear steady-state” and “. . . but if the imbalance were at all sizeable, we’d have frozen or boiled long ago” just invites mention of Earth’s last glacial period that ended only some 12,000-13,000 years ago. 🙂
While I don’t know how controversial the numbers are, if I recall correctly, ice core data indicates a temperature rise of either 16 or 18 degrees C at the end of the last glacial cycle, the larger part of which was achieved in the first two decades, the rest in the next 80 years. This was of course, a local rather than a global magnitude but is still rather rapid relative to any instrument measurements.
Excellent article and statement!
Let sanity rule again.
By far the most concise and yet elementary debunking of the AGW-hysteria I came across. Thank you!
One of your better ‘killer’ posts, WE. Kudos.
There is an ‘official’ variant of your first figure that purports to estimate the uncertainty in each flux estimate. (Stevens et. al., Nat. Goes. 5: 691-696 (2012)). I used it in essay Sensitive Uncertainty (attribution fn 7) in ebook Blowing Smoke to simply point out that the peer reviewed total UNCERTAINTY in the flux estimates was plus/minus 17w/m2, over 10x (on each side) the supposed net total ~1.5w/m2 radiation imbalance change caused directly and indirectly by CO2 since Mauna Loa records began about 6 decades ago.
An officially quantified sum (albeit probably too low) of the many physical uncertainties you note concerning these fluxes. >10x, an order of magnitude.
Or, to paraphrase in English something a German client colleague taught me many moons ago in Munich: ‘Herr Doctor, anything stated absolutely is absolutely wrong.’ (Und in Deutschland, Ich bin doch ein abgestemplt Herr Doktor.)
Perpetuum mobile energy amplifier strikes again
AS I REQUESTED, please take this argument elsewhere.
w.
Is it just me or does Willis come out with this back radiation BS on a monthly basis?
No wonder warmist alarmists have such an easy time when lukewarmists pay homage to their junk science.
You know, if you understood the energetics of backradiation from the colder ERL to the warmer surface, you would not promote this nonsense.
But you don’t, so you do.
Is it just me, or does every time Willis explains how the world works, those who can’t accept that jump up and start throwing insults?
Not just you, Mark.
There are also people who seemingly have no interest in trying to educate anyone, or helping anyone understand something they seem to not understand.
I see a lot of overlap between the group you mention, Mark, and the one’s I just described.
All heat, no light, from Leit.
It is annoying, to say the least.
Nick S to his credit seems to be sincerely trying to use information to change minds.
But he never sticks around and has back and forth conversation.
He seems to not hear what anyone says who tries to explain anything to him, and just picks up someplace else as if it is the first time the subject has arisen.
Which is very annoying for a different reason.
It seems as if Nick chooses to misunderstand different arguments.
“It’s the main reason why the earth is not as cold as the moon”
No! First of all the moon is not so cold at all, it’s just very imbalanced. That is because a lack of atmosphere (and convection it provides), long day-cycle, lack of (liquid) water and low thermal conductivity of regolith. Allowing for the t^4 law, the average surface temperature is about 276K. Not that cold.
Equally GHGs only have a moderate effect on the surface temperature of Earth. They provide some 35W/m2 “exclusive” GHE and another 50W/m2 overlapped with clouds (with another 30W/m2 CRE or GHE due to clouds alone, totalling a GHE of 35+50+30 = 115W/m2).
The interesting part, and that is what all the models and ECS estimates got completely wrong, is that only those 35W/m2 are even subject to change if GHGs concentrations change. Frankly therefore ECS estimates, at least within a first iteration including vapor feedback, produce results almost by a factor of 4 too high.
E. Schaffer July 26, 2021 3:06 pm
I didn’t say it was the only reason. I said it was the MAIN reason. And if you think the average temperature of the moon is 3° above the freezing point of water, I suggest you re-examine your assumptions.
I have no clue where you got those figures.
Same problem as above.
w.
Well, again, it is all there.
https://greenhousedefect.com/
And specifically..
https://greenhousedefect.com/the-beast-under-the-bed-part-1
https://greenhousedefect.com/basic-greenhouse-defects/the-beast-under-the-bed-part-2
Please provide clearer logic and math to help us understand you.
I have previously posted several different independent ways that the climate model ECS estimate is likely high by a factor of about 2, not 4 (which would take it nominally below 1 and so present serious theoretical and observational problems related to the inescapable entrained math proposition that more CO2 net cools—when we know from Earth’s history that it didn’t).
I have largely written a series of articles hereto, but I am going to publish others first, just to complete the whole GHE audit. Why the GHE looks the way it does and how you necessarily get roughly the numbers I quoted above is well described on my site, so I will refer to that.
With ECS it is basically the same problem, the same rationale, although there are some weird “tricks” on top of that. And remember, you can basically verify it with modtran.
http://climatemodels.uchicago.edu/modtran/
If you use US standard atmosphere (close to 288K!), remove all other GHGs except CO2, then double it from 400ppm to 800ppm, emissions drop by 3.768W/m2. If you apply that forcing to about 240W/m2 of current emissions TOA, you get 288 – ((240-3.768)/240)^0.25*288 = 1.14K warming for 2xCO2. Note, this is totally consistent with all the models and ECS estimates.
The problem is this: in reality the surface is not a perfect emitter, CO2 is overlapped with vapor and most of all clouds. In modtran just bring back other GHGs (reload) and add some clouds (stratus …. Top 2.0km), so that emissions are somewhat realistic 242.91W/m2. Now if we double CO2, emissions drop to 240.618W/m2, only 2.292W/m2 less.
It means 1.476W/m2 (=3.768 – 2.292) of the original 3.768W/m2 are overlapped with other GHGs and clouds and so they do not make any difference, as you can not block emissions twice. I mean not with having an additional effect.
And that is why all these models are so toxic, because they combine the purely theoretical result for 2xCO2 with unreal preconditions, and then apply this figure to the real world, including clouds and everything. I mean even if we would stick to the theoretical CO2 only situation, where emissions where more like 345W/m2, you would only get 288 – ((345-3.768)/345)^0.25*288 = 0.79K for 2xCO2.
Instead.. 288 – (240.618/242.91)^0.25*288 = 0.68K
If you try the “temperature offset” in modtran, you will find that 0.61K are actually enough to get back up to 242.91. That is because modtran holds the lapse rate constant and so percentage wise temperatures increase more strongly higher up the atmosphere, and less at the surface. And then of course, this figure is still too high since we did not correct surface emissivity, and 242.91 emissions TOA are a little too high as well. Realistically what you get for 2xCO2 is about 0.55K
The same thing, though way more severe, is also true for vapor. The difference is that a) vapor is more strongly overlapped with clouds and b) vapor is a kind of feedback loop. I mean if you have 1K warming (due to CO2 for example) and you get a feedback of 0.5K by vapor, then you are not done. You will have to add a feedback for those 0.5K, let us say 0.25, and then a feedback to it as well..
1 / (1-x) helps to cut this short. If x = 0.5, then you get 2 in the end, meaning vapor would double the effect of CO2. If x = 1, then you get indefinite feedback and a division by 0. If x = 0.2, then you only get 1.25, or just +25% including the feedback loop.
Climate models like to assume some 0.5-0.55K primary feedback, which is accurate for non-overlapped vapor. In reality, this primary feedback allowing for real conditions is only 0.15-0.2K. After the loop vapor feedback is exaggerated by about a factor of 5. And the real vapor feedback is actually smaller than lapse rate feedback, which of course is negative in nature, so that vapor is negative feedback all over.
I hope your brain is fried 😉
Nope, not even close to fried. But thanks for your refs. Invaluable in refutation, You made several fundamental errors in your now indelible response.You will hear back concerning those soon.
You are an even better debunk target than the solar/remo water subject CtM just suggested. So you are maybe not first up in my debunk que. But definitely in the que.
You are welcome, I am looking forward to hear/read any rational thought from you!
I’ve been reading a lot lately on Telegram regarding the flat-earth concept, with a “firmament” protecting us. Have you done any research on it?
This site has a lot of info, don’t know it’s validity.
https://theunexpectedcosmology.com/flat-earth-in-the-bible-the-firmament/
I grew up with a paleontologist and an earth science teacher in the 60’s, so I have never doubted the earth being round….
The…. one flat-Earth theory applies to the propensity of models to analyze energy, matter, and heat distribution over a simplified field to facilitate computational tractability. It is a consensus-oriented belief that enables policy when there is a scientific deficit.
No need to do any “research” on the concept of a flat Earth, unless one is totally science-illiterate.
There are so many ways a flat-Earth has been proven to be impossible, both theoretically and observationally, it’s no longer even entertaining.
If you are being honest when you state “. . . so I have never doubted the earth being round”, your post, on its surface, merits the designation of being a troll for posting the URL that you did.
Well, that august body the United Nations accepts the idea of a flat earth …
 &f=1&nofb=1
it’s on their flag & logos –
but then they also accept the idea that man can control the climate; arrogant half-wits !
Interesting that at least 7 people on this site think that man CAN control the climate !!!
I suggest they read some books on Physics, Geology & Paleoclimate, or ( if books are too hard ) try the reference pages on this site.
Gordon, your sarcasm is not appropriate. I have been on this site for years.
(I do not believe CO2 controls the climate.)
I was simply asking Willis if he had ever looked at the energy balance based on there being a firmament.
Brad, stated: “I was simply asking Willis if he had ever looked at the energy balance based on there being a firmament.”
Not so. You made repeated references to the concept of a “flat Earth”, one of those being the URL that you posted.
Furthermore, there is nothing in the Bible indicates the “firmament” is associated with a “flat Earth”:
“And God made the firmament, and divided the waters which were under the firmament from the waters which were above the firmament: and it was so.
“And God called the firmament Heaven. And the evening and the morning were the second day.
“And God said, Let the waters under the heaven be gathered together unto one place, and let the dry land appear: and it was so.”
—above quoted passages from Bible, Genesis 1:7-9, KJV
One one hand, to the extent the “Heaven” was literally associated as being the “dome” above Earth that contained the Sun, the planets and all the stars, a firmament currently exists—although not of the limited extent imagined in Biblical times—and this concept is integral to claiming that solar energy arrives at Earth TOA and that Earth TOA can radiate to deep space.
One the other hand and quite simply, there is no statement in the Bible that the Earth is flat (referencing the URL that you posted).
I’m sorry if you view this as being sarcasm . . . it is meant to be factual.
We should have a contest for who can give the best rationale for the Earth being flat.
And then make the prize an around the world cruise.
(If you do not know if I am being sarcastic or not, just pay close attention to the tone of my voice.)
I want that cruise !!
Bobby told Lucy, “The world ain’t round…
Drops off sharp at the edge of town
Lucy, you know the world must be flat
‘Cause when people leave town, they never come back”
[ Hal Ketchum, 1991 ]
Gordon – if the Earth was indeed flat then by now the cats would have knocked everything off the edge.
Why bother? I think the flat earthers are just having fun being obstinate. They should launch their own probe, even just piggy back a camera, suitably secured against tampering, on another launch if they think the whole world is engaged in some coverup. By the way, way would the firmament be a dome if the ground underneath was flat? You could poke your head into outer space at the edges. You would get a dome firmament over a globe – the atmosphere!
I vote for this one. This one is hugely important. It is the difference between being in an icehouse period (Ice Age) or in a hothouse period, as determined by the equator-to-pole temperature gradient.
Besides this one is very likely the one affected by solar activity.
https://wattsupwiththat.com/2021/07/23/can-we-predict-long-term-solar-variability/#comment-3300119
And if one is so bold and has a look at other rocky bodies in the solar system it becomes apparent that the amplitude between poles and equator shrinks with increasing atmospheric mass/density.
If atmospheric pressure/mass was higher in earth’s past that would solve the hothouse phenomenon as well as the problems with the flying ability and long necks of dinosaurs.
But there are no pressure proxies. So nobody is looking into this.
Actually, there are pressure proxies. See here for a discussion.
w.
Thanks, I remember now reading about the lava once.
Though I would have preferred somebody would have done a pressure chamber experiment to see if the drop size changes are according to the model for the turf. Should be possible to conduct such an experiment.
Funny thing btw:
More nitrogen is discussed to solve the early faint sun paradox:
https://www.nature.com/articles/ngeo692
Though instead of a radiative mechanism as discussed in the paper the same would apply to a change in pressure.
Agree….
Would like to see a justified plot of the earth’s atmospheric pressure from the formation of the moon onward.
Would settle for a discussion about what in the nitrogen cycle keeps current day earth at 1 ATM
Earth is constantly losing mass to space through solar wind but at the same time the mantle is degassing.
Given that seismic and solar activity are relatively stable on geological terms the equilibrium stays at it is. One or the other needs to change to shift the balance.
Here’s a presentation from ESA about the mechanisms behind atmospheric mass loss:
https://www.cosmos.esa.int/documents/1700208/1718761/11_Russell+Strangeway_Atmospheric+escape+on+Earth.pdf/ce51f874-82ca-2220-5b5e-d4bf878f8bf9
Thanks for link, but still looking for what controls earth pressure.
I find the general lack of discusion and controversy around issue very surprising considering volatility of all other discussions
The reference to rain drops in lava above, very unconvincing…
The oceans pull the co2 out of the atmosphere, what mecanisum controls nitrogen…
That is atmospheric mass and earth’s gravity. If the atmospheric mass changes so does pressure.
Look at Venus: Way more atmospheric mass hence way higher pressure. Mars the opposite. The gravity difference plays a minor role between the three celestial bodies Earth, Venus and Mars.
But what controls the atmospheric mass, no one really knows.
Why I have found the answer to this question key to really understanding a lot of questions.
Could it be as simple as the pressure going up increases the ocean uptake of gases and the opposite as it goes down.
As the oceans rise and they experience a lower atmospheric pressure, evaporation and thus cooling effects increase and the opposite as they fall. Lots of conflicting pieces.
But, how can anyone expect to understand climate if this basic question is not answered first…..
Regards
Pressure on earth at least defines today’s sea surface maximum temperature.
So if a sea surface temperature proxy shows higher temperature than today it could be pretty likely that pressure was higher.
“But what controls the atmospheric mass, no one really knows.”
I think it is related to how many gas molecules are floating around.
Yes, sure. But are these constant on geological scale or not?
We are losing constantly matter to space and at the same time there is gas leaving the mantle. But are the magnitudes of these two processes just irrelevant, are they balancing out or are we gaining/losing atmospheric mass?
That is the interesting question.
If there was that much more air a few million years ago, where did it go?
Where did the atmosphere of Mars go? Space is one plausible guess.
Where did Venus’ atmosphere come from? Another good question.
But where did all the nitrogen go to? Well, I doubt there has been that much nitrogen been bound in organic molecules (including ammonia and its derivates) at that time. But I could be terribly wrong here.
“• Increase the amount of surface energy moved high into the troposphere inside thunderstorm towers. These towers circumvent greenhouse gases in two ways.”
indeed the transport of latent heat (and sensible heat) circumvents greenhouse gases. Nevertheless it contributes to the greenhouse effect as the heat is not radiated directly from the surface to space but from a lower temperature level higher in the atmosphere.
Figure 2 calls itself Fig.3 internally. Mildly confusing.
Willis, thanks for the relatively simple explanation. Is the T-Storm effect you describe related to the ‘Iris’ tropical thunderstorm effect Dr Lindzen proposed?
Not Willis. But yes, albeit indirectly.
No, the “Iris Effect” describes the thin clouds that are made out of ice that extend from the tops of deep convective thunderstorms. These reflect heat but let longwave through, cooling the surface. See here for a discussion.
.
Willis,
Thin or cirris clouds do not originate out of thunderstorm anvils. The people writing the article at your link have obviously never been near the tops of big thunderstorms on a regular basis. Most cirris is normally associated with cold temperatures and strong winds above 30,000′ and have nothing to do with thunderstorm formation.
D K, while thin cirrus clouds do form with cold temperatures and strong winds above 30,000 feet, they also form from the top of thunderstorms. See here for discussion and photographs.
w.
Willis,
They don’t form from the tops of thunderstorms. Cirris are thin wispy clouds that normally stretch for hundreds of miles at high altitude. Thunderstorms are cumulonimbus and nothing else.The use of the word cirris by those in your link as emanating from thunderstorms is incorrect. A lot of cirris actually exists as cirro stratus and cirrocumulus and there are good pictures here of the various types. sci_corner_cloudchart.pub I have seen the tops of many thousands of thunderstorms and never seen cirris or cirro stratus associated with them and that comes from first hand experience from a long airline career.
R K, for thirty years, Dr. Richard Lindzen was the Alfred P. Sloan Professor of Meteorology at the Massachusetts Institute of Technology. He’s been the recipient of the NCAR Outstanding Publication Award (1967), AMS Meisinger Award (1968), AGU Macelwane Award (1969), Alfred P. Sloan Fellowship (1970), AMS Charney Award (1985), and he is a member of the National Academy of Sciences. He has published more than 200 scientific papers and books on climate, meteorology, and clouds.
He writes about his theory of the Iris Effect (emphasis mine)
Now, if we were talking about airplanes, I’d take your word over his in a hot second. You’re a pilot, and I suspect a good one.
But we’re not, we’re talking about anvil cirrus … so you’ll have to excuse me for taking his word over yours.
w.
That’s OK Willis,
You believe what you choose. There are many people in Academia, Bureaus of Meteorology and Universities etc that write their thesis on all sorts of things and much of what they produce is theoretical. It is not a term I have heard used in 56 years in aviation, nor have I ever seen cirris associated with the anvils at the tops of thunderstorms. He might have written 200 papers on weather and clouds but what is his first hand experience of thunderstorms? I have had first hand experience with thunderstorms at all levels up to 70,000′ high and seen lines over 1000 klms long and quite frankly most forecasts today are poor in much of the world because there is too much theory.
I wonder if Dr. Lindzen knows that there is a very big difference between.thunderstorms in the tropics compared to those that form in temperate zones? In the way they form, their height and size and the level of turbulence that could be expected. Would he know by looking at storm what height it was,whether it was likely to contain hail, at what stage of development it was at, when was it starting to dissipate? Anyway, I only commented to try and inform.
Best wishes
H Willis, Trying to answer the questions from the past may never be answered but regarding what’s happening now to me is NO mystery ,
first up What is heat? What is Heat? A brief introduction at the particle level. – YouTube
Next up is What’s a dipole? Dipole-Dipole Interactions – Chemistry LibreTexts
Next is What’s a rectenna? Rectenna – Wikipedia
Next up Wireless power transfer Dr. William Brown Wireless Power Beaming Tests – YouTube
Next small part of the Electricity man pumps into the atmosphere Radar Bands | Frequency bands and power used in radar (rfwireless-world.com)
Man pumps enormous amounts of electricity (energy) into the atmosphere 24/7 and should be added to the energy budget diagram both up and down. You can’t keep going round and round regurgitating the same old crap and think your going to come to some sort of different conclusion , that’s the first sign of madness, so start putting these above pieces together and let the Truth set us free from all the gobbley gook you keep spouting.
Well crazy guy, add up all the energy put out by man, subtract what goes straight out to space and compare that with the 340W/m2 raining down on the planet. On a side-note, did you know that termites put out about 50% more co2 than all of humanity. We’re just not that big a deal.
Ha knucklehead , try growing a brain and follow the links I provided.
None of the links you provided demonstrate that any of that energy is going into the atmosphere.
Well, jmorpuss, let’s see how that plays out. On average, the sun puts about 123 petawatts constantly into the climate system. That’s 1,075,500 petawatt-hours per year.
Humans consume about 22 petawatt-hours per year. I’d be surprised if 1% of this goes into generating radio, microwave, radar, and other electromagnetic waves. But let’s use a generous 5%, so call it 1.1 PWh/year of radiated electromagnetic energy.
That’s 0.0001% of the solar energy.
Sorry, but that’s not going to make the slightest bit of difference, even if it were ten times as large … which it is absolutely not.
Math is your friend.
w.
Van Allen Probes Spot Man-Made Barrier Shrouding Earth | NASA
Willis , show us your math skills and show us mathematically how this took place. you can’t always use math to explain observations . PS did you even try to follow the process (links) above?
Once again, utterly irrelevant.
Nobody doubts that we humans are creating a lot of radio energy.
The issue is how much of this energy winds up warming the atmosphere.
The answer is, so close to none that it doesn’t make a difference.
All of that “human consumption” of energy is either radiated through the atmosphere directly to space or ends up heating the atmosphere. Even if all of it heats the atmosphere, it doesn’t amount to a rounding error.
How much energy do you think humans produce each year?
bdgwx, first you need to define “produce”.
w.
Some of us seem to be quite energetic.
Others, not so much.
Lol. I get it. Let me reword for jmopuss. How much energy do you think humans injected into the climate system?
To
Willis Eschenbach
bdgwx
Nicholas McGinley
AndyHce
MarkW
PCman999
Here’s just one transmitters ERP
About our WSR 88-D Radar (weather.gov)
Maximum Transmitted Power
Whereas the power output of the WSR-57 is 410,000 watts, the output of the WSR-88D is 750,000 watts. The return power is directly proportional to the transmitted power.
Antenna Gain
Radar (cod.edu)
So start adding up all the transmitters (not just weather radars) around the world, find their power in watts and their gain in dBs and use this calculator
ERP & EIRP Calculator – M0UKD – Amateur Radio Blog to calculate ERP
(effective radiated power)
Let’s assume there is 10,000 WSR-88D equivalently powered radars. that are injecting energy into the atmosphere. That is 0.000014 W/m2.
What bdgwx said. The earth is BIG.
w.
bdgwx
Your right BUT start adding all the other wireless transmissions together, military, private and public that are pumped into the atmosphere 24/7 day and night . you could start here
United States Cell Tower Map – SCADACore on each tower there would be a company provider. How many cellphone providers in the U.S List of United States wireless communications service providers – Wikipedia
What is the typical gain, or power output of a cell tower transmitter? – Quora
Here’s a thought , say you were to point say 10 focused microwave weather radars at the one spot in the atmosphere you think it would heat up enough to create weather changes or change the climate of an area or deflect the Jetstream.
Willis Eschenbach
That’s why to cover the whole globe we need a network of infrastructure that is constantly growing in size.
The atmosphere is almost completely transparent to radio frequencies.
Not so mark. Hear is a couple of links for you to read.
Attenuation – Wikipedia
Telecommunication networks[edit]
Telecommunication – Wikipedia
Photonics – Wikipedia
The Science Of Radar
Reflectivity
How Radar Works (bom.gov.au)
Publisher Summary
Radio Wave Scattering in the Ionosphere – ScienceDirect
How does weather radar work?
How does weather radar work? | The Why Files
There are two basic ideas that come to mind when discussing “balance.” The alarmists see balance like a person on a tightrope, when tipped a little too far in one direction or another, catastrophe results and balance can never be achieved again. I believe the energy balance of the Earth is much more like the balance of a marble in a bowl. Tip it a little, or a lot, and it will eventually settle back to the center, always seeking balance. Balance is the most basic aspect of the natural world. It is why planets are spherical. It is why planets orbit the sun without crashing into it. It is why I’m not worried about a little more CO2.
“to claim that we can predict the future climate a century from now based solely on projected CO2 levels is … well … let me call it insanely optimistic and let it go at that.”
I can’t let it go without saying that the claim is insanely pessimistic, and arrogant. Relentless, however, since those who want power can money get it most easily from political diseconomy based on CO2 hysteria.
CO2 was imprisoned earlier this century by international peer pressure because it was the fashionable thing to do. No trials were held. No direct evidence exists. (In Canada the Chrétien government denied requests for hearings before it simply declared CO2 a pollutant by administrative fiat.)
Like a bad TV police drama, CO2’s rise over the past 150 years which happened to coincide with an upward variation in temperature was enough to imprison it, because Al Gore and friends said so because it suited their interests for it to be so.
CO2 was passing by on the wrong side of the street at the wrong time. If it had just stayed home doing nothing, like it had for the prior two thousand years…
Now compare with observations. At zenith 1000-1030 watts of sunlight. Surface normal average 339.4 watts per square meter. 1016.77-620.05+958.01 = 1354.73. In winter surface normal average is 320 watts per square meter 1029.04-570.39+958.4 = 1444 watts. The sun is closer to earth around January (> 1400) than in July (< 1360). Reason global sea ice in January is 17 million km² while in July global sea ice is 24 million km². Hot summer land in northern hemisphere is offset by so much ice in southern hemisphere. But still increases the earth by 20 watts in summer and lost in winter.
Yay 😀 ! More radiative fun – have at it!
Thank you Willis. And welcome back.
Forwarded to Camille.
Mercy beaucoup
Thanks, amigo.
w.
Ahhh 😱!! As we all know, none of this is as easy as they portray in the popular believes; many of us scientists know that science is not exactly based on common sense, as issues like thermodynamics show that what really hides behind the eye is the uncommon sense of science, which shows us how things not seen by the naked eye tie issues in the most unexpected ways. Now, I did not quite follow all of the explanations, and I don’t want to support any argument without any deep assessment in terms of statistical/quantum/thermodynamics as we did when in school, nor I want to trash the views based on superficial observations. However, I’m very interested on the mentioning of “latent heat”, which is used here without a clear explanation. As a chemist, I can guess that this technicism refers to the heat that is used to separate the molecules of a heated substance as when the temperature crosses the phases of melting/evaporation AKA Delta-H (enthalpy) of fusion/boiling. My point is that this is a form of heat that does not involve a change in temperature, and so it is not registered by an thermometer. We cover this in college classes of general chemistry 2 in the chapter of intermolecular forces, appearing in all chemistry textbooks. Now, I’ve always wondered how much of this heat is involved in this climate change issue, what role does it play, and how is it accounted for in models of “predictions”, since we know that the weather belongs to chaos theory with impossibilities of predictions, exemplified by issues such as Brownian Motion and the lack of its consideration in statistical quantum systems such as the atmosphere. I’ve always also been interested in connecting all of that with what I call the elusive measurements of atmospheric heat capacity (Cp), which should be defined as the amount of heat that the atmosphere can take in order to show an increase in temperature by one degree. As we know all substances have this measure reported in handbooks such as the CRC, and it is used as a method to identify unknowns, well exemplified in general chemistry lab classes when students are given equal-size metal rods to guess the material of its makeup. As far as I know, there’s no atmospheric Cp value reported, and I wouldn’t even expect a single value due to the radical changes in average temperatures across the globe. Another issue connected to all of that is the amount of absorbed energy in watts possible for a single molecule of CO2; as I have studied the opinions of the greatest scientists posing the hardest questions about climate change, the claim is that no one is sure about the exact amount of IR light that CO2 can absorb from UV solar radiation reflected as IR by the earth’s surface. I’ve seen a possible range of values and the accusations go saying that the (unrealistic) computer models of predictions have been fed with the extremely high values they think that CO2 can take of heat in watts, and that explains in part why the exaggerated/obsessive alarm. I’m a PhD precisely in Environmental Science & Engineering (ESE) from UTEP, 2006, and I should say that we should start clarifying research issues by going back to basics and defined as explained 1) the role of temperature-independent latent heat, 2) the Cp of the atmosphere, 3) the real values of heat absorption of CO2, and 4) the thermodynamic concepts that would need to be clarified to see if it’s true that CO2 can cause what they claim. All I find in the literature is more studies that simply push forward the claim of CO2 driving climate change; the basic stuff is very hard to find. My personal opinion goes around an analogy: as an expert in toxicity, the molecules of steroids are biologically relatively small molecules that do cause a huge effect in cellular processes, like nanograms controlling mitosis/growth/homeostasis; they have in their chemical structure electromagnetic effects coming from electron delocalization in benzene rings, which are effects of structure and function not quite clear in the literature, that I’m convinced have a lot to do with their ability to cause huge changes in low concentration amounts. As a comparison, we know that CO2 amounts are in parts per billion (ppb) in the atmosphere, representing a very low percentage of the gases in the atmosphere (way below 1%). So, how can CO2 cause such a huge change in the atmospheric temperature in such low concentration amounts without any specialized molecular character in the structure as steroids do? I don’t see yet how can I trust CO2 driving climate change. Thanks. Dr. Vigo.
One hardly knows where to begin . . . so I won’t.
Doc, you like to explain how co2 creates plasma.
Making a Mini Sun in a Microwave! Microwaving Fire to Make Plasma in My Top Secret Microwave – YouTube
Is it because of this dipole-dipole interaction ?
Dipole-Dipole Interactions – Chemistry LibreTexts
“we know that CO2 amounts are in parts per billion (ppb) in the atmosphere,”
???
Well, he is right.
412,000 ppb or so?
We could also call it 0.4 parts per thousand.
Paragraphs are your friend.
Aint that the truth.
I gave up around when the first paragraph break should have been.
Huh???????
The amount of UV solar radiation that is reflected as IR by the earth’s surface is exactly 0.0000…
I am sure of that.
P.S. In other words, I don’t need to calculate the velocity of Sun-Earth separation needed to red-shift solar UV all the way down to infrared frequencies . . . it would be enormously high.
Brilliant analysis as usual Willis, but here you are preaching to the choir (as well as a group of clapping monkeys, who you have so succinctly put on notice, and thank you for that), The problem is that there is no argument or theory, or even data that can dissuade the alarmists from their pursuit of this. We may as well hold fire until time, in its own relentless way, reveals what is to come. In the meantime, I’ll continue to enjoy your posts.