From The Cliff Mass Weather Blog
Last week we witnessed a major failure in science communication regarding the Northwest heatwave.
A failure that misinformed you and millions of others, and a failure that highlighted glaring weaknesses in the media’s ability to cover important scientific issues. And it revealed the disappointing behavior of some members of the scientific community.

The Northwest Heatwave Attribution Study
During the last week of June, the U.S. Pacific Northwest and southwest Canada experienced the most severe heatwave on record. So extreme that all-time high-temperature records were not only broken but obliterated. My recent blogs describe the situation in detail.
Within a week, an international group of scientists, policy researchers, and others rushed to create and distribute an attribution analysis of the heatwave. A study trumpeting an extreme claim in the first sentence of the report:
“Based on observations and modeling, the occurrence of a heatwave with maximum temperatures as observed in the area was virtually impossible without human-caused climate change”
As I will show below and previously demonstrated in my recent blogs, this claim is not supported in the document or by the rigorous science, and, in fact, the material in the attribution report contradicts this assertion. I will provide substantial evidence that the heatwave attribution report, which has not been submitted for peer-review, is profoundly flawed, with serious technical and interpretative errors.
But the lack of peer review and the obvious problems with the study did not stop it from becoming front-page news in both mainstream and secondary media, including the NY Times, the Seattle Times, the Washington Post, CNN, and many more. Some samples of the hyped headlines are shown below:


With the exception of one story in USA Today, none of the writers questioned the grand claims of the attribution study, nor noted that other scientists had differing viewpoints. Here in Seattle, an incurious Seattle Times staff did not bother to examine contradictory evidence. It has become clear that much of our media is more interested in promoting a political narrative than providing citizens with factual information.
As a result of the media’s failure, millions of people were misinformed about the heatwave and its connection with global warming. And such poor information undermines society’s ability to deal with climate change.
A Technical Examination of The Heatwave Attribution Analysis
In the following sections, I will note a few of the major problems with this attribution study.
I should note that this research area is one in which I have an extensive background, having published several papers in peer-reviewed journals on Northwest heatwaves. Some of my papers are referenced in the report and one of the authors contacted me for advice and assistance.

As I shall demonstrate, the study is deeply flawed, does not support the claims in the headline bullets, and has serious scientific and other errors. If submitted to a journal for peer review, it would be rejected.
The main findings are not supported by scientific evidence or the materials in the report
As noted above, the first bullet of the main findings states that the heatwave was “virtually impossible without human-caused climate change.” Sounds very certain, doesn’t it? Virtually impossible.
Then read their next bullet:
“The observed temperatures were so extreme that they lie outside the range of historically observed temperatures. This makes it hard to quantify how rare the event was”
On one hand, they say it is hard to quantify how rare or unusual the event was, but on the other, they claim the event was virtually impossible without human-caused climate change.
Both statements can not be true. You can’t be uncertain and certain at the same time.
But the contradictions don’t end there. In the next bullet, they state there are two possible sources of the extreme temperatures. The first is a low probability event that was aggravated by climate change. This is what I suggested in my blog–and I am not the only one who believes that the best science supports this hypothesis.

Their second possibility is that global warming was the essential cause of the heatwave, with “non-linear interactions” increasing the probability of extreme heat beyond the gradual increase that has been observed during the past half-century. They state that “we need to investigate” the second possibility and ADMIT that “climate models do not show it.”
This is startling. They acknowledge that for global warming to cause the extreme heatwave, non-linear interactions that amplify the global warming signal are required and further admit that such interactions are not found by the key technology for doing so, climate models.
To put it succinctly, they have no evidence that global warming played a major role in the event.
Their next claim is that the June heatwave was enhanced by 2°C by global warming, which is not out of the realm of possibility.

But think about it. Considering that they state that the heatwave had maximum temperatures 16-20°C warmer than normal, by their OWN ADMISSION only about 10% of the heatwave was the result of global warming. Thus, a record-breaking, unique heat wave would have occurred without global warming.
Imagine if they had stated that. You would not have seen many headlines: Global warming contributed 10% of the heatwave!
In the final bullet, they note that if global warming continues at an aggressive rate (their SSP8.5 heating scenario assumption), futures heatwave would be ONE DEGREE °C warmer by midcentury. Not much compared to the amplitude of the June heatwave.
Daily High-Temperature Trend Problem
In the next section of the report (1.2), they claim, based on widely scattered observing stations, that the daily high-temperature trends in the Pacific Northwest are higher than the global average. This is deceptive. First, the Earth is 72% water and daily high temperatures generally increase more slowly over water than land. Northwest observing stations are over land.
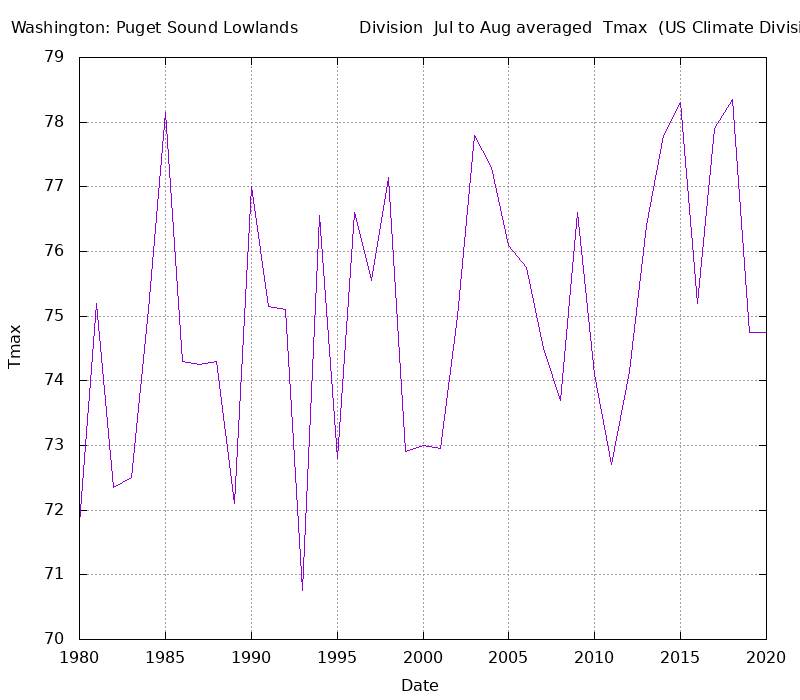
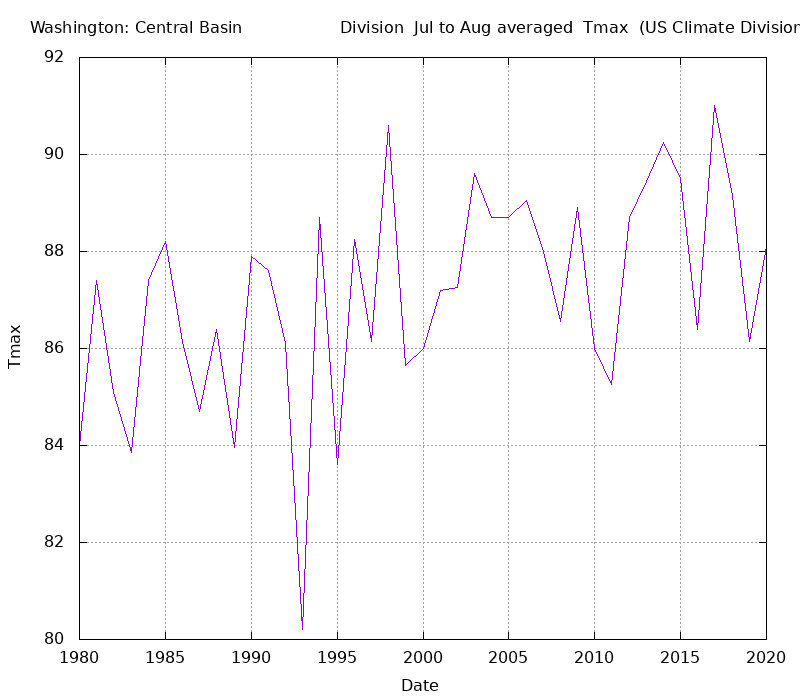
But more importantly, the authors of this report appear not to know that the observing locations west of the Cascade crest have experienced LESS warming than inland stations because of the marine influence. This is obvious if you plot (see below) July/August maximum temperature trends around Puget Sound and the Columbia Basin during the period of largest global warming (1980-2020). The temperature trend is twice as large in the Columbia Basin compared to Puget Sound (1F versus 2F).

Puget Sound Temperature Trends

Columbia Basin Temperature Trends
Data and Methods Problems (Chapter 2)
In this section and others of the report, it is apparent that the investigators have limited knowledge of key aspects of Northwest weather. For example (section 2.1), they suggest the importance of Lake Washington in local weather, suggesting it significantly influences the climate of Seattle (it doesn’t). They neglect the critical effects of Puget Sound, such as its substantial cooling of downtown Seattle and Seattle Tacoma Airport,
The study makes use of low-resolution Global Climate Model (GCM) simulations, which lack the resolution to get the basic aspects of Northwest weather and climate correct, These models do not simulate the important effects of the Cascades, the BC Coast Mountains, the mountains of Vancouver Island, the Olympics and the coastal mountains. The regional land-water contrasts in the GCMs are seriously in error and the global climate models fail to even grossly simulate the snowpack and soil moisture distributions of the region.
To make a bad situation even worse, the simulations they used are driven by an unrealistic, excessive greenhouse gas emission scenario (SSP-8.5) that leads to unrealistic warming during this century. Furthermore, the just-released CMIP-6 global climate model simulations were used, and these projections evince unrealistic warming.

The selected emissions scenario is highly aggressive, making unrealistic assumptions (such as massive increases in coal use)
Return Time Analysis of Historical Gridded and Station Data
In the next section, the paper attempts to determine how unusual the high temperatures were during the event. One goal was to determine the return time of the extreme heat based on past annual high temperatures; would such warmth be observed every ten years, hundred years, etc.? This section included an extreme value analysis, in which investigators fit a Generalized Extreme Value (GEV) distribution to the observed annual high temperatures. You can think of the GEV as a theoretical probability of temperatures occurring at various values, with the probabilities decreasing for more extreme values.

Their analyses provided an important finding: the Northwest heatwave of last month was extraordinarily improbable EVEN IF SUBSTANTIAL GLOBAL WARMING occurred. Global warming could not explain it.
This study clearly showed that the heatwave was a very rare black swan event. And this finding contradicts the headline in the first bullet of the report and in headline banners around the world.
And there is more. They determined the probability of getting a similar extreme temperature event ANYWHERE on Earth (similar sized area, similar or greater magnitude). Importantly, they found that the probability of observing the event anywhere on Earth was MUCH higher (about 60 more chances each year because the June heatwave encompassed about 1.5% of the Earth). The return time of a similar extreme event somewhere on the planet was between once every 1.5 to 15 years. Thus, such black swan events occur somewhere quite frequently– just not necessarily in the Pacific Northwest.

After this important finding was revealed, the authors made a critical admission:
“It is, therefore, conceivable that it was pure chance that it (the heatwave) happened at this location.” And they called for further research. Wow.
Multi-model AttributionIn many ways, this part of the report is the weakest. They provide little explanation of their analysis approach, other than to refer to a previous paper (Kew et al. 2021) whose methodology was questioned by the reviewers of that paper (not sure how that paper even got published with those reviews).
For some reason, they combine observations and models at the same time in their analysis, which does not make any apparent sense. In addition to a confusing and inadequate description of their approach, they provide grand claims of global warming producing major increases in the probability of extreme heatwaves. Such findings were inevitable considering they used models driven by unreasonable global warming inputs and the use of highly sensitive CMIP6 simulations.

But that is the least of it. The probabilistic approach to climate attribution is highly flawed, something I touched upon in my previous blog on the event. If the probability of an extreme event increases from .001 to .1 percent it has gone up by 100 times, but still, the probability is still low. That is why the claims of global warming increasing the probability of a once in a thousand-year event by 150 times are so deceptive. Furthermore, the results of the various models they used were all over the place (their Fig. 12), with a huge range in the probabilities of the heatwave (the majority suggested it was very, very unusual).
Meteorological Analysis: Major DeficienciesIn this section, they state ‘The circulation pattern itself also appears not extremely anomalous” and that the Heat dome “is not that anomalous.” These claims are not correct.
In truth, the amplitude of the ridge of high pressure aloft was the greatest ever observed and the high pressure was in position for a very long time, allowing air plenty of opportunity to warm by sinking.
At 850 hPa (about 5000 ft above sea level) the temperatures were not only unprecedented but extraordinarily extreme (see graphic below from Dr. Joe Zagrodnik). And an approaching trough of low pressure played an important role in forcing strong offshore flow, but this is not mentioned in this report. I could go on, but the message is clear: the meteorological setup was extreme and exceedingly rare, something not recognized in this work.

Global Warming and the Jet Stream, Drought EffectsThe report considers but finds no evidence for global warming causing the jet stream to experience more blocking or ridging (high pressure) events. Record-breaking high pressure aloft played a central role in this event and without a global warming connection, the role of natural variability comes into the forefront.
Finally, the report notes that drought and dry soil conditions could have enhanced the high temperatures due to less evaporative cooling. But they admit that soil moisture conditions and precipitation were not below normal in British Columbia, where many of the warm records occurred. Furthermore, as described in my previous blog, moistening the soil in model simulations only cooled the region by about 1°C, a value dwarfed by the heatwave amplitude (16-20°C).
The Bottom Line: The ominous claim in the first sentence of this report, suggesting an overwhelming global warming origin of the Northwest heatwave, was not supported by the remainder of the document. If anything, much of the material in the report is highly suggestive of a random, black swan event that is slightly enhanced by greenhouse gas warming.

An Advocacy DocumentIt is clear that this attribution study was not intended to serve as an objective examination of a scientific issue (e.g., the contribution of global warming to the Northwest heatwave) but rather is an advocacy document.
It is easy to demonstrate this. For example, the first section of the paper calls for immediate policy changes, including adaptation and mitigation. The final section “Recommendations” promotes policy changes and specific adaptation recommendations. The inconsistency between the dramatic claims of the first sentence and the more nuanced material within the document suggests a clear intention to highlight a message that promotes notice and action.

Afterword
The future of our society depends on scientists dedicated to determining truth and communicating their best estimates of truth, including the inevitable uncertainties. Scientists, in their professional roles, should never become advocates for politicized viewpoints or actions.
Likewise, the media in their news reporting must strive to avoid political advocacy and communicate truth, with all its uncertainties. The media must be engaged and curious enough to not only understand the science but to actively question the reliability and rigor of scientific claims.
In the recent heatwave case, we have seen a profound failure on both sides of the equation: scientists who created a rushed, sloppy, and flawed attribution study of the Northwest heatwave for reasons you can probably guess, and the media who headlined such poor work because it fit a comfortable, politically favored narrative.
Hopefully, this unfortunate situation will serve to encourage reform in both the scientific community and the media. The cost to society is too great for such behavior to continue.

Black Swan rare heat wave events happened before CO2 was a factor.
Here is a graph of the hottest 40 heat waves in the weather history of Stdney Australia, for the annual hottest waves 3 consecutive days long.
The 1960 event was about 7 degrees C hotter for those 3 days than the average hottest waves in other years.
Note that the heat waves in Sydney have NOT become hotter over the years by these criteria..
http://www.geoffstuff.com/black_swan_heat.jpg
Geoff S
Just back from 10 days in central Kansas. Have to thank the left coast for sucking all the heat their way. It was noticeably cooler than normal in Kansas, with only one day of the 10 at the highs you would expect. May be more noticeable, it was very cool overnight and gradually warmed during the course of the day, hitting the peak and quickly dropping into the evening. Mornings had unusual cloud cover, maybe from the rains and moisture radiating from the green covering the fields and pastures. Nothing like NorCal, where I was in early June visiting #5 and #6. (When you get to 6 sons, you just start numbering them.)
Or you could do as George Forman and name them all George. I had 5 brothers. My father got so frustrated when calling for one of us, he just started calling us all Sam. None of us was named Sam so to get at my father, I named my horse Sam.
Where is the 2 C global warming figure coming from? My understanding is that we have yet to reach the 1.5 C threshold. And warming from 1950 is certainly less than that.
As a now retired computer modeller can anyone explain to me why computer models are even considered relevant now it is no longer GLOBAL warming but regional climate change?
Sure with global warming and one world you need a comparison reference. Now it is regional you only need high anomaly areas with a lower temperature boundary and low temperature ones with a higher boundary. Comparing this with fossil fuel use would give a definitive and immediate yes or no answer about climate change and its relationship to fossil fuel use.
I think by “computer model” you actually mean “global circulation model”. Note that there are many different kinds of climate models with GCMs being only but one type. GCMs are by far the most complex. They are useful because they provide the widest array of predictable quantiles (more than just temperature and done over smaller areas). They also happen to be the best at reproducing both the trend and variation of the global mean temperature from 1880 to present.
Also note that “global warming” is the long term secular increase in the global mean temperature while “climate change” is the change in any attribute of the climate system as a result of “global warming”. Also note that “climate change” predates “global warming” by several decades. In fact, the first use of the term “climate change” was by Chamberlin in the late 1800’s. Anyway…the point is that “global warming” and “climate change” while related are different concepts.
Where do you get your definitions? I can’t find any peer reviewed papers that say what you say and you didn’t list any to back your statements.
Ten years ago, weather events were not climate. Climate was defined as weather in a given area over 30 years. Did the goal posts change again?
The CliSciFi GCM modelers admit GCMs are not accurately down-scalable to regional areas.
GCMs miss the late 18th Century Warming, subsequent cooling, the 1910 to 1940 warming, subsequent cooling and the hiatus of the 21st Century. Skipping over those variations gives the GCM’s 1880 to present trend. Oddly, the only trend they replicate is that of the late 20th Century period where observations are used to tune the models.
The GCM models’ average global temperatures vary by 3 C; they are not modeling the same physics. While the GCM outputs neck-down during the late 20th Century “tuning” period, hindcasts and forecasts of the individual models vary wildly. They are not modeling the same things and their average outputs are meaningless.
This is neither a “failure” nor a “weakness”, it is hugely successful and deliberate MISINFORMATION campaign.
The failure is ours since this BS is now established in the public mind and we have little recourse apart a very few low impact outlets like WUWT to challenge it.
People who read propaganda and believe it have no one else to blame but themselves when their dreams do not come true.
If anyone believes this is limited to “climate change”, you haven’t been paying attention. Climate change is just another social wedge driven to separate you from your god given rights, along with any wealth you might have accumulated along the way.
You can tell because fear is used as the prime motivation. Whenever fear is used to motivate action, its a scam. Rule #1.
H.L. Mencken.
I read: including adaptation and mitigation.
The best adaptation and mitigation would be achieved by using sufficient and reliable nuclear and fossil fuel power to keep the Air Conditioners running and the water pumps on.
There is almost always a flood somewhere and a drought somewhere else.
Use adequate power to move water from where there is water to where there is not enough water.
Each region needs adequate power generated inside the region to be self sufficient. The long transmission lines are an easy target of manmade and natural disasters.
Large Complicate Grids can fail due to software failure or due to manmade and/or natural disasters.
Man-made global warming is real, and easy to understand.
All measuring stations, downwind of wind and solar farms, will all record higher temperatures, that is a simple fact, and yes, that is manmade warming.
That is only local warming, the climate system will self correct and counter warming from any cause.
To cool the climate system, energy must be transported from warm places, warm tropical oceans, into polar regions where it removes sea ice and promotes evaporation and IR out and sequestering of ice. This IR out does no immediate cooling, or very little, the stored ice will be thawed as it is dumped into turbulent saltwater currents, hundreds or thousands of years later, chilling the polar oceans to form sea ice and prevent significant snowfall until the store of ice is depleted.
This is why there are “Always” alternating warm and cold time periods. The warm periods last until enough ice is pushed into oceans to form sea ice and turn off the snowfall. The cold periods last until enough ice has depleted and there is not enough to maintain the sea ice.
This is simple, easy to understand, stuff, supported by ice core records from Greenland and Antarctica. Proposed by Maurice Ewing and William Donn, more than a half century ago, even before ice core records were available. They were the Climate Science Giants of the last century.
Consensus, Peer Reviewed, Climate Science is much like Lysenkoism in Russia, Those who disagree are attacked by the 97% and the media and corrupt politicians and companies that are getting rich off of the green, subsidized, junk that is the cause of power and water shortages.