Guest Post by Willis Eschenbach
Back in 1987, V. Ramanathan noted that we can measure the very poorly named “greenhouse effect”. This effect has nothing to do with greenhouses. Instead, what happens is that some of the upwelling longwave radiation from the surface is absorbed by “greenhouse gases” in the atmosphere, mainly CO2 and H2O. This absorbed energy, of course, is added to the thermal energy in the atmosphere, which is then radiated again with about half going to space and about half going back to the ground.
What Ramanathan noted is that to calculate the size of the “greenhouse effect”, you simply subtract the longwave emitted to space at the top of the atmosphere (TOA) from the longwave emitted upwards at the surface. Here’s Ramanathan’s drawing of the concept:

Figure 1. Drawing by Ramanathan showing upwelling surface longwave of 398.6 watts per square meter (W/m2), TOA radiation to space of 267.5 W/m2, and atmospheric absorption (greenhouse effect) of 131.1 W/m2. Note that Ramanathan has also calculated the absorption as a fraction of surface radiation (0.334, or 33.4% of radiation absorbed).
The use of a percentage to measure the “greenhouse effect” eliminates one of the variables. Where it is warmer the ground emits more radiation, so naturally more will be absorbed by the atmosphere. That means if we want to compare different areas of the earth, we need to use percentages instead of absolute values. Below are two graphs showing the percentage of the upwelling surface longwave radiation absorbed by the atmosphere, shown from two opposite sides of the planet.


Figure 2. Percentage of upwelling longwave absorbed by the atmosphere, Pacific-centered and Atlantic-centered.
There are a few things of interest here. First, where it’s very cold, almost no upwelling longwave is absorbed by the atmosphere. Second, in the cloudy areas around the equator, about half of the upwelling radiation is absorbed. Third, you can see the Gulf Stream along the east coast of the US …
Much is made by climate alarmists of the fact that the percentage of the upwelling surface radiation absorbed by the atmosphere is increasing. This indeed shows that the greenhouse effect is real … but it shows nothing about whether that affects the temperature. Figure 3 shows the rate of increase.

Figure 3. Change in absorbed upwelling surface radiation from March 2000 to February 2021.
Now, I entitled this post “A CO2 Puzzle”, and true to my word, here it is. The increase in the absorbed upwelling radiation is supposed to be from the increase in CO2 … but in fact, the increase in absorbed upwelling longwave is slightly less than half of what we’d expect from CO2. And that’s without the claimed increases in absorption due to methane and other minor greenhouse gases, from”water vapor feedback”, and from “cloud feedback”, all of which are said to increase the slope of the trend in absorption.

Figure 4. As in Figure 3, but also showing the expected trend from the increase in CO2 over the period.
So there’s the mystery. Between CO2, methane and minor greenhouse gases, water vapor, and cloud feedback, the percentage absorbed should be increasing far faster than it actually is … why isn’t it?
And what is the answer to the puzzle? I don’t know, other than to note that as I’ve pointed out in a number of contexts, emergent climate phenomena act to minimize factors that tend to warm the earth. However, I have no idea exactly what is occurring here, all suggestions welcome.
Me, I’m currently in Florida with my gorgeous ex-fiancee, enjoying the rain, the sunshine, and the pleasant and friendly people here. Our profound thanks to the most interesting and kind WUWT folks who have hosted, educated, and entertained us on our peregrination, you know who you are, much appreciated.
My best to everyone from the land of oranges and bikinis …
w.
PS—Two things. First, I implore you not to turn this into a discussion of whether a cold object can warm a hot object, or whether the greenhouse effect is real. There are plenty of places for you to have those discussions. This is not one of those places, and I will snip comments that go over the line. And please, if you get snipped, don’t whine about censorship or the like. It is merely my effort to keep the conversation focused on the topic of the post, you’ve been asked in the strongest terms to stay away from those topics, and if you don’t, it’s on your head, not mine. Oh, and please, leave out the politics … there’s plenty enough division of opinion in the climate world, no need to increase it by including politics.
Second, as always, I request that you quote the exact words you are discussing, so that all of us can understand just who and what you are referring to.
Wouldn’t that mean that the effect is primarily driven by water vapor which is far less at the poles?
there you go using SENSE…..
What do you exactly mean be “this effect”? The total “greenhouse effect” or just the recent change of it? For the former, think most would agree, water is the most important “greenhouse gas”.
The effect shown in the graphs: the change over the last 10y in % or radiation absorbed. Honestly I don’t think the “average” of a %age is a valid physical quantity but it may have a similar form to the change in radiation flux.
Willis’ fig 3 look a lot like UAH TLT over last 10y.
I think that change is radiation is primarily due to change in water vapour ( a fn of temperature ). Most of the variability in that graph is temperature driven natural change.
Now was the overall rise in temp driven by CO2 , it may be very difficult to separate the eggs from the chickens here.
The so called change in Greenhouse radiation in the chart doesn’t follow CO2 it follows the 2015/16 El Nino.
And one of the reason why there is less absorption than predicted is because, as Harper has demonstrated, the ability of the atmosphere to absorb is near saturation already.
Happer?
I think these images do reflect water vapor + absorbed heat. The poles are too dry due to the frigid temperatures, the equatorial region has high density, over large to medium continents not so much.
Seems this would have to be explained away before going to CO2. Why would CO2 be denser along the jet stream?>
Another really important point – H2O over the poles is zero (or almost), so any absorption that happens over the poles will be from CO2 only. So that presents a perfect opportunity to actually measure the absorption from CO2 only – and from what we see, that is almost zero. Otherwise if CO2 was as good an IR absorber as AGWers claim, then we would see much higher percentages over the poles. Since we see almost zero absorption over the poles, than means CO2 absorbs almost zero. You cant argue with actual measurements.
Probably the IR wave lenght isn’t compatable with CO2 absorbtion capabilities (?)
dgp,
water vapor and CLOUDS, WV being a greenhouse gas that warms the surface by a few watts, CLOUDS being a 80% upward reflector of the 1361 watt incoming sunlight, as well as a downward IR emitter at equivalent to about 0 C due to cloud bottom temperature…WV covers the entire planet in varying amounts depending on troposphere temperature, CLOUDS cover about 2/3 of the Earth’s surface and grow and shrink as much as it needs to achieve radiative balance. CO2 is a bit player, overwhelmed by the Clausius-Clapeyron equation which controls the amount of water vapor above the ocean surface and the temperature it becomes CLOUDS as it rises into the troposphere.
Isn’t one of the big problems of AGW, the fact the absorption spectrum of long wave IR has a large overlap between CO2 and H2O. So that either CO2 or H2O can absorb it – but NOT both. The AGWers claim that only CO2 absorbs it but it might be that very little of the upwelling IR can ever be absorbed by CO2 because H2O is already absorbing it
And over open water, H2O is dominant. Any change in CO2 is irrelevant.
Agreed. My first thought was that this was also a map of the amount of water vapor in the atmosphere. There is a very good correlation between water vapor and absorption. This shows that CO2 is not doing most of the absorption.
It was also “far less” back when CO2 was 280ppm but the Earth wasn’t warming then.
The point is that CO2’s GHE works best where there is little WV.
Hence we see the Arctic warming a 2-3x the rate of the average.
Hot air balloons rise. Is convection of the reabsorbed (multiple times) energy in the equation?
When you look at the conventional diagrams of the planet’s heat budget, convection is given a tiny part. I think that’s a grave error.
Radiation is not the only way heat is removed from the surface of the planet. Willis has observed that tropical thunderstorms move a huge amount of heat from the surface to the upper atmosphere where it does two things:
1 – some of that heat is radiated to space
2 – some of that heat travels poleward.
The moisture is directly evaporated from the surface of the ocean and no upwelling radiation is involved.
I strongly suspect that the greenhouse effect is over stated and that convection is not given sufficient credit.
I also suspect that a whole bunch of climate scientists don’t understand thermodynamics nearly as well as they think they do.
A, sort of, side comment:
Thermodynamics is a bear. When I was a pup, the lore in engineering school was that, no matter how badly you did in Thermodynamics during the semester, take the final exam anyway. For sure all the marks would be put on a curve and you stood a very good chance of passing.
Funny, I got my best grade of my university career in thermodynamics. For some reason it resonates with me…
Thermogoddamnics…
Yup, and if you memorized a couple of equations with (k-1)/k in them you got a “B” and if you could calculate a couple of dQ/T equations, you got an “A”… It turned out, for me at least, this level of knowledge was woefully inadequate for career purposes…..
Just try this with a ‘radiator’: put your hand in front, then put your hand above it. It gets far warmer above a radiator, which is poorly named because it is a convector. Convection trumps radiation every time.
Space has no air … assume you right and get the heat right up against space where to next as convection now stops?
As CommieBob said you still need that hotter air to radiate so the only effect you can attribute to convection is to lift the heat to better position to radiate.
That’s true as far as it goes.
If it weren’t for convection, the only way heat could leave the surface (ignoring conduction which is puny in this case) would be to radiate through the full mass of greenhouse gases.
With convection, heat can be hoisted to the top of the atmosphere without being hindered by those greenhouse gases.
As I also point out, the effect of convection on the heat budget seems to be seriously underestimated. link Actually, on the linked diagram, the two rightmost budget items are thermals(conduction/convection) and latent heat(change of state). IMHO, the latent heat term is almost entirely due to convection. Same thing for the IR emitted by clouds (without convection there would be no clouds).
When you combine (1) thermals, (2) latent heat, and (3) clouds, it is apparent that the majority (56%) of heat radiated by the atmosphere is due to convection … and that’s on a diagram created by people who want to explain everything based on CO2 as a greenhouse gas.
I should add there is an obvious problem with CB’s idea you eventually cook the planet in any scenario because the surface area is almost fixed. Even allowing the atmosphere to expand and contract wont help look up the formula for volume and surface area for a sphere.
Interesting thought. When it is warmer, there would be more convection, which would add to LW loss to space and hence look like a lower rate of absorption. This could be the answer to w’s question.
If you want the real answer you can’t measure this in classical physics it will always make no sense. Large scale energy is passing into the quantum domain as spins and resonances and then ignoring there is energy bleeds and movements in that domain.
If you want a practical example of the problem you can do it at home, try to evaluate how hot a microwave will make something without knowing it’s water content. To give you an easy example you might know, how hot will a microwave make an empty plastic container?
If we hypothesise that w’s missing ‘absorption’ is really extra convection, then it may be possible to test that hypothesis: 1. Assume that the mechanism is evaporation at sea surface -> convection to cloud/cloudtop height -> condensation to form clouds (releasing latent heat of evaporation) -> released heat radiates to space. 2. Assume that the release of radiation is at the same time as the formation of cloud. 3. The missing ‘absorption’ should then lag sea surface temperature by 3 months.
The 3 months comes from my https://wattsupwiththat.com/2020/06/05/cloud-feedback-if-there-is-any-is-negative/
Thinks: It would be simpler to look for a no-delay correlation between the missing ‘absorption’ and dCloud (change in cloud cover).
I think the hypothesis fails. ‘Absorption’ goes up with higher temperatures, but it should go down. Eye-balling only.
Is their a consensus in the scientific community that the governments of the world can control global climate change by eliminating the use of fossil fuel around the world? What is the plan? Do the computer models tell us what will happen next?
As an aside, I have a magic 8 ball if they need an assist.
If it wasn’t for the fossil fuels the UK would be without electricity today.
Electricity currently generated from:
Gas 53%
Nuclear 15%
French +Dutch +Belgian import 14.4%
Coal 3%
Hydro 2%
Pumped 2.5%
Biomass 7%
Wind 2.3%
Solar 0%
https://www.gridwatch.templar.co.uk
How did they turn the Sun off in the middle of summer?
Solar at 1.56% at 20:15 BST. Pretty dang close to 0.
Have you ever been in the UK in one of our so called summers?
When William Blake wrote his poem Jerusalem, he wasn’t joking when he posed the question:
“And did the Countenance Divine,
Shine forth upon our clouded hills?
Sometimes it doesn’t. Nor shine forth upon our clouded lowlands either.
neither, not either?
Michael, who was the leader of the pedant’s revolt?
Answer: Which Tyler.
I think the use of either is right grammatically.
The English summer has set in, with its usual severity…
I blame Wimbledon: lawn tennis is a major factor in causing rain!
“Cue the clouds, Sir…”
I thought clouds didn’t count.
From both sides now…
Though provoking as usual, Willis.
My first thought is whether it is legit to “average” percentages of radiative flux. It’s an informative way to visualise the effect over the globe but ( assuming your graph is the average of all the points on your maps ) I think that %ages are not “fungible”. You should probably be plotting average W/m2 .
For example low % at the poles pull down the average but the absolute contribution is probably minimal anyway.
You do not explain how you convert to plot the CO2 “forcing” in W/m2 on to the graph in % but that looks like something to check.
Also, I can see where the TOA data comes from but how is upward surface radiation measured at ground level ( is it measured? ). Could you explain where that part of the data comes from?
Sorry if some of that is wrong but the description of the method used is a bit too cursory to comment in more detail.
You % graph looks a lot more like temperature variation ( and hence WV ) than CO2.
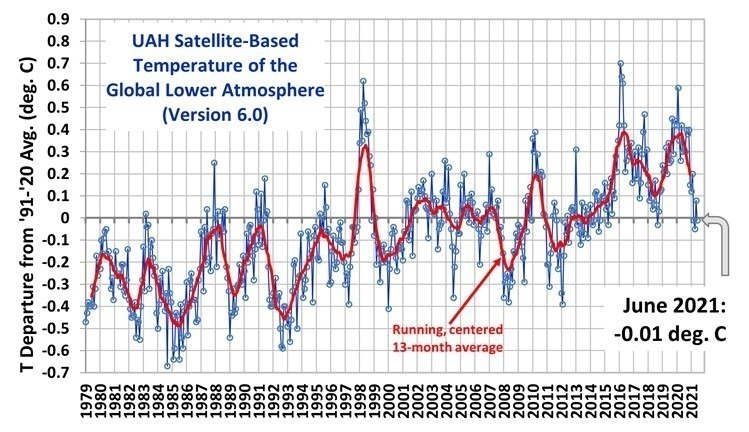
http://www.drroyspencer.com/wp-content/uploads/UAH_LT_1979_thru_June_2021_v6.jpg
troughs around 2004,2008; peak in 2008-09 general rise to 2016-2020 high. Recent dive. Probably something to found there.
Separating the chickens from the eggs could be tricky but not much of that variability can be attributed to CO2 change.
Greg wrote:

“Your % graph looks a lot more like temperature variation ( and hence WV ) than CO2.”
Good observation Greg and nice work, thank you Willis.
Upwelling Radiation Absorbed %
UAH LT Spencer and Christy
Global cooling started circa 2007 at the end of strong SC23 but just for a few years,
Global cooling again started Feb2020 at the end of weak SC24, as we correctly
predicted in 2002 (ahem), Global avg UAHLT dropped 0.6C in the last 16 months
to June 2020. At the same time, Upwelling Radiation Absorbed % dropped below
the “zero trend”.
It is obvious that increasing atmospheric CO2 plays NO significant role in global temperature – that was fraud – it’s ALL water vapor, driven by solar activity.
Alleged fossil-fuel-driven Climate Crisis Cancelled – total false nonsense – a fifty-year-old pack of lies.
New climate crisis – solar-driven global cooling has already started – hundreds of new extreme-cold events all over the planet – crop failures. vital energy systems compromised by green energy scams….
See Electroverse.net
How long global cooling lasts is estimated by some to extend to ~2050 – and humanity suffers greatly during cold periods.
Next steps:
Imprison the warmist fraudsters and adapt quickly to the new reality.
Quickly repair the damage to energy systems and bundle up!
Makes sense.
EXTREME COLD AND HEAVY SNOW TO SMASH SOUTH AFRICA, + ‘THE YEAR WITHOUT A SUMMER’, BY JOHN MAUNDERJULY 12, 2021 CAP ALLON
The SA Weather service has actually issued a rare Level 4 snowfall warning: “Blimey, it’s not often we see one of these,” is how thesouthafrican.com puts it.
what idiot is down voting that comment? Is snow “offensive” ??
White, so racist.
I didn’t down-vote it, but it is winter currently in South Africa, so “year without a summer” might be the reason?
We had a year without a summer last year in Sothern Australia. This winter, already 10 frosts – (and counting) where I am compared to the usual 3 or 4.
I don’t hold much hope for a hot summer this year either.
G’Day Allan,
An article by “JOHN MAUNDER”
Haven’t I heard that name somewhere before?
(The second part of the article dealing with 1816 is quite interesting.)
Be very afraid of global warming – it will freeze your grapes off.
BTW, the grape harvest in France and Germany is gone – frozen out in Spring 2021. Donnez-lui le gateau.
THE TROPICS JUST LOGGED ITS SECOND-COLDEST TEMPERATURE IN HISTORY, AS ALL-TIME RECORD COLD SWEEPS SOUTH AMERICA
July 13, 2021 Cap Allon
The mainstream media refuses to acknowledge the record-breaking ‘negative’ anomalies currently sweeping vast swathes of the planet as it continues to push its AGW propaganda on a criminally ill-informed public.
NATURAL GAS PRICES SKYROCKET GLOBALLY DUE TO HISTORICALLY COLD 2021 AND FAILING RENEWABLES
July 13, 2021 Cap Allon
This coming winter is of great concern: “If the weather is bad and there is not enough gas in the tanks, then there will be a big turmoil in gas prices” — millions could find themselves without energy during the harshest months of the year.
Let them eat cake. We are freezing our grapes off.
Donnez-lui le gâteau. Nous congelons nos raisins.
Gib ihm den Kuchen. Wir frieren unsere Trauben ein.
Дай ему торт. Замораживаем виноград.
把蛋糕給他。 我們冷凍葡萄。
Nah, translating idioms almost NEVER works.
Let them eat cake. original french: Qu’Ils mangent de la brioche.
We are freezing our grapes off. Try : on se gèle les couilles.
One wonders how much longer the BS mainstream media and our BS governments can maintain the catastrophic global warming fiction.
RECORD SUMMER CHILLS SWEEP THE UNITED STATES, AS SUB-POLAR COLD HITS AFRICA–THREATENING “AN ACUTE MAIZE SHORTAGE”
July 14, 2021 Cap Allon
It’s setting up to be a historically cool summer across much of the CONUS, particularly for the Midwest and the South. Plus, an unusually cold Antarctica (-4.2C below the 1979-2000 base) continues to ‘kick’ exceptionally frigid air over Southern Hemisphere land masses.
ANTARCTIC SEA ICE EXTENT LARGEST SINCE 2015, AND GROWING
July 14, 2021 Cap Allon
Additionally, NSIDC data reveals that ice around the southern pole has been increasing at ≈1 percent per decade since 1979.
CLIMATE CHANGE IS FOR DUMMIES
July 16, 2021 Cap Allon
Here are a few of the earthly events and phenomena blamed on “climate change” this week — only the clinically indoctrinated could fall for such nonsense…
The usual idiots are claiming that CO2-driven global warming caused the French and German wine harvests to freeze out. You have to be clinically stupid to say that.
“CLIMATE CHANGE IS AFFECTING THE TASTE OF WINE”In a garbage article coming out of the economist.com (written tomorrow, July 17???), a warming planet is making the timing of the harvest date for European wine more difficult, impacting the taste.
“Climate change threatens not only the flavor of wine, but the world’s wine supply,” continues the article, which then goes on to recall those Italian and French growers lighting thousands of bucket-sized candles in April to stave off the “killer frost”.
Despite farmers best efforts, the extreme cold wiped out 90% of crops in some regions, resulting in an estimated loss of €2 billion — the French government declared an “agricultural disaster,” and issued an emergency rescue package after rare freezing temperatures of -8C (17.6F) and beyond caused the worst damage in decades.
The article then makes the wild claim that “climate change may make such events more common”.
Here is quick an very dirty overlay of those two graphs. Time scale is pretty close to matched.
I’d like to see the CERES data in W/m2 but the similarity is already quite interesting.
Now this is just eye-ball science but it seems there is about 6mo lag of temp wrt. radiation, which hints at the direction of causation.
This needs more serious study but it looks interestin.
what needs to be compared is fig3 in W/m2 to UAH TLT . A lagged correlation plot could extract the lag with the strongest correlation.
Good work Greg.
Related papers – see especially the June 15, 2019 paper for the detailed mechanisms:
CLIMATE CHANGE, COVID-19, AND THE GREAT RESET
A CLIMATE, ENERGY AND COVID PRIMER FOR POLITICIANS AND MEDIA
By Allan M.R. MacRae, Published March 21, 2021, Update 1e published May 8, 2021
https://thsresearch.files.wordpress.com/2021/05/climate-change-covid-19-and-the-great-reset-update-1e-readonly.docx
THE CATASTROPHIC ANTHROPOGENIC GLOBAL WARMING (CAGW) AND THE HUMANMADE CLIMATE CHANGE CRISES ARE PROVED FALSE
By Allan M.R. MacRae, B.A.Sc.(Eng.), M.Eng., January 10, 2020
https://thsresearch.files.wordpress.com/2020/01/the-catastrophic-anthropogenic-global-warming-cagw-and-the-humanmade-climate-change-crises-are-proved-false.pdf
THE REAL CLIMATE CRISIS IS NOT GLOBAL WARMING, IT IS COOLING, AND IT MAY HAVE ALREADY STARTED
By Allan M.R. MacRae and Joseph D’Aleo, October 27, 2019
https://wattsupwiththat.com/2019/10/27/the-real-climate-crisis-is-not-global-warming-it-is-cooling-and-it-may-have-already-started/
THE COST TO SOCIETY OF RADICAL ENVIRONMENTALISM
By Allan M.R. MacRae, B.A.Sc., M.Eng., July 4, 2019
https://wattsupwiththat.com/2019/07/04/the-cost-to-society-of-radical-environmentalism/
CO2, GLOBAL WARMING, CLIMATE AND ENERGY
by Allan M.R. MacRae, B.A.Sc., M.Eng., June 15, 2019
https://wattsupwiththat.com/2019/06/15/co2-global-warming-climate-and-energy-2/
Excel: https://wattsupwiththat.com/wp-content/uploads/2019/07/Rev_CO2-Global-Warming-Climate-and-Energy-June2019-FINAL.xlsx
I had the same idea. The whole Fig. 4 looked very much like the temperature data.
Temperature seems to drive LWR “absorption” not the other way around.
Nikolov is pointing this misinterpretation of cause and effect out since quite a while, He might be right.
Well since CO2 rise is fairly monotonic, clearly that is not what is causing most of the variation here. That does not necessarily mean WV is the cause. There could be another cause : either solar or simply internal variation in the climate system.
Causation is not so easy to establish but it would seem most likely that temp drives WV rather than the opposite. If not you still need a cause for changes in WV.
see especially the June 15, 2019 paper for the detailed mechanisms:
[excerpt]
6. The sequence is Nino34 Area SST warms, seawater evaporates, Tropical atmospheric humidity increases, Tropical atmospheric temperature warms, Global atmospheric temperature warms, atmospheric CO2 increases (Figs.6a and 6b).
Other factors such as fossil fuel combustion, deforestation, etc. may also cause significant increases in atmospheric CO2. However, global temperature drives CO2 much more than CO2 drives temperature.
Fig.6a – Nino34 Area SST warms, seawater evaporates, Tropical atmospheric humidity (offset) increases, Tropical atmospheric temperature warms… ?resize=628%2C280&ssl=1
Fig.6b …and UAH LT Tropics Atmospheric Temperature leads UAH LT Global Atmospheric Temperature, which leads changes in Atmospheric CO2.
I suspect it is evaporation that is the initial cause. It drives TPW which drives absorption. More water vapor equals a higher absorption percentage.
Of course, evaporation also leads to the release of latent heat when the water vapor condenses which drives up the UAH temperature.
Finally, more evaporation is caused by increase in ocean temperature SSTs.
https://woodfortrees.org/plot/hadsst3gl/from:2000/to/offset:-0.2/plot/hadsst3gl/from:2000/to/offset:-0.2/trend
You might want to try comparing the %absorption with TPW from RSS. The TPW is more seasonal and might explain some of the differences better.
> “I have no idea exactly what is occurring here, all suggestions welcome.”
It doesn’t matter how beautiful your theory is, it doesn’t matter how smart you are. If it doesn’t agree with experiment, it’s wrong. ~ Richard P. Feynman
We don’t have to come up with an alternative to disprove the forcing theory.
The variability over this record has clearly no correlation with CO2. It is only by reducing all that detailed data down to one global average and fitting a linear trend to the entire data set that you can find a correlation.
ie reduce a decade of daily, 1deg x 1deg grid : megabytes of data down to one scalar number. Once you have a scalar “trend” you can always claim correlation to CO2.
This is why the last 40y of climatology has been so obsessed with “trends”.
Rob_Dawg:
What experiment on a global scale has ever proven that the “greenhouse gas” hypothesis is correct?
The only viable experiment should show that if CO2 levels are decreased, cooling will occur, and if they are increased, warming will occur.
And since the ice core reconstructions consistently show negative correlation at every inflection point (where temperatures stop falling and start rising, and where temperatures stop rising and start falling), with temperature leading and CO2 following, PLUS the fact that temperatures consistently start RISING when CO2 levels are FALLING, and near their LOW point, and temperatures consistently start FALLING when CO2 levels are RISING, and near their HIGH point, we have all the observational evidence we need to scientifically conclude that CO2 is driven by the temperature, and NOT the other way around.
AGW is not Science:
Ice cores also show a very rapid transition to warmer temperatures, This abrupt change is the result of a cessation of volcanic activity, where their dimming SO2 aerosols settle out, probably within 25 years, or less, and warming begins.
Isn’t this statement the defining mark of an honest observer / enquirer / researcher / scientist?
Willis scores again.
Were that there were many more Willises in the in halls of establishment climate ‘science’.
„If the facts don’t fit the theory, change the facts.“ ~ A.Einstein
No, I think that was ~ M. Mann.
“Quotations of famous scientists on the Internet are always truthful” – Isaac Newton
LOL
I would like to see those graphs with zero at the origin on the ordinate. Otherwise great article, luv ya Willis.
I am stunned when I consider how complex a single inorganic water molecule and its different forms can be and even more so at a tiny living organism like a ciliate – one of which has 16,000 chromosomes compared only 46 in a human. These can be studied in a lab. However, when it comes to the different climate zones and the enormous complexity of the systems and their interaction is it unadulterated intellectual arrogance to think we can distil this into some mathematical formulas. The most brilliant minds cannot let alone some Swedish teenager activist.
It would seem that if we had a long enough time series that had daily highs and lows at the appropriate level of the atmosphere, fitting the dellta-Ts should show that the time variant dynamic range would correlate with increasing atmospheric GHG constituency. In other words, converting the temperature times series to instantaneous amplitude, we use a similar process to find Oil & Gas from seismic data by utilizing the Hilbert transform.
Ramanathan is mostly right and is describing a gray body, where the ratio between the emissions at TOA and the RADIANT emissions by the surface is the emissivity. Many get confused by non radiant energy like latent heat, failing to understand that it has a zero sum effect on this ratio. If a Joule emitted by the planet can trace its source to latent heat, a Joule of radiant surface emissions that would have ultimately contributed to TOA emissions will need to be returned to the surface instead in order to offset the lost latent heat.
Surface emissions attenuated by an emissivity before leaving TOA must either be returned to the surface or sent into space, so the emissivity is a complete representation of the GHG effect and all that contributes to it.
Because he’s missing the fact that only about half of the surface emissions absorbed by the atmosphere are returned to the surface, he’s underestimating absorption by about a factor of 2 and is also over estimating the emissions at TOA. Although, his absorption value would be more accurate if he was trying to reconcile absorption by GHG’s alone, which is only about 1/3 of the total absorption, while clouds absorb the rest. If A is the total absorption by GHG’s and cloud and half of this is sent into space, the equivalent emissivity can be calculated as 1 – A/2, or visa-versa, as in practice, the equivalent emissivity is much easier to measure.
I would also point out that in Fig 1, the radiative surface at the top of the atmosphere is drawn to have the same surface area as the earth’s surface. That’s impossible. 1 w/m2 radiated at the earths surface will become something less than 1 w/m2 at the top of the atmosphere merely because of the larger surface area it has, even if there is no absorbing medium between the two surfaces. Radiation energy decreases by r^2 (inverse square law) as you move away from the radiating source.
Thanks, Tim. This is another of the things that I call “a difference that makes no difference”. Earth’s radius is ~6,370 km. That gives a surface area of 4 pi r^2 = 510 million square km. If you go up say 13 km, the average height of the tropopause, it increases to 512 million square km. This is an increase of less than half a percent, so for first cut analyses this is always ignored. Yes, there’s a difference … but it makes no difference.
w.
Generally speaking, TOA emissions are normalized to the surface area, since it’s the temperature of this surface that’s of interest. Certainly 1/r^2 matters, but only in the distribution of power relative to a point source of emissions. In this case, there’s a emitting volume of space (the atmosphere) positioned above an emitting surface and not a simple emitting point, which requires a different kind of analysis, although at a sufficient distance from Earth (at least several Earth diameters), there’s no practical difference between the two.
Tim, mathematically this is described by Stokes’ Theorem and Gauss’s Law. It is the integration of the flux over the surface area that matters.
The oceans near the equator absorb solar energy and evaporate water which convects to the upper atmosphere. When the water condenses it gives off heat, some of which is radiated to space. Some of the heat is returned to the surface farther north. link
So, we have a large part of the downwelling solar radiation which is returned to outer space and the greenhouse effect isn’t involved in that part of the transaction.
Isn’t the radiation to space dependent on “greenhouse” gases?
Good question. Yes.
Both absorptivity and emissivity rise with increasing CO2 or WV. However, the LW absorption is primarily from one side and emission is in both directions, so there is a biased effect from increasing GHGs.
To the extent that a Joule emitted into space can trace its origin to latent heat, a Joule of surface emissions absorbed by the atmosphere must be returned to the surface to offset the lost latent heat. Despite the fact that non radiant energy does not belong in the RADIANT balance, it still needs to be conserved at the surface. Trenberth did climate science a great disservice by including non radiant energy in the radiant balance. A large part of his ‘back radiation’ term is not even in the form of radiant energy, but in the form of weather and rain that’s warmer than it would be otherwise.
If anyone thinks it matters, then the question that needs an answer is what effect will latent heat plus its offset to the surface have on the average temperature and the corresponding steady state emissions beyond the effect it’s already having on that average temperature and its emissions?
The energy arriving at the surface is in equilibrium with the energy leaving. The mechanism by which it arrives and leaves is irrelevant.
I would add to that, the percentage change in absorbed upwelling surface radiation has had a general negative trend since about 2016 (El Nino), and more steeply negative since about 2019, all the while CO2 has been increasing.
Where it is very cold, the water vapor tends to have very low concentrations.
Could the cooling have something to do with upwelling air = adiabatic cooling (low pressure system or cyclones) vs. downwelling air (anticyclones, adiabatic heating) in the atmosphere.
Has somebody done any statistical work comparing the relative number (and maybe pressure differences) of weather systems vs. surface temperatures. These are also “emerging phenomena” although not as “compact” as thunderstorms, but huge volumes of air (and water vapor) are involved…
Willis,
When I look at your graphs, I don’t really see a linear trend. What I see rather is no trend between 2000 and 2015, with a sudden short-lived increase around the 2015 – 2019 El Ninos.
As you have previously shown that atmospheric water vapor content increases with EL Ninos, could the phenomena that you describe in this post simply be an effect of increasing atmospheric water vapor due to the El Ninos?
Yes, this whole idea of “trends” is ridiculous. It is an artificial way to ensure you always have a result which can be attributed to CO2, since CO2 is a monotonic rise, everything else has to be reduced to a monotonic rise.
This slight of hand have never been called and the scam has been running 40 years now.
I presume the 1997 El Nino was not covered by data I presume, if it were there I would suggest a very different linear relationship
That is another reason NOT to fit “trends”. The result is totally subjective and depends on where you start and end. Even it that the start and end of your data, it totally arbitrary w.r.t. climate when we decided to launch a satellite of drop a bunch of ARGO floats.
TRENDS MEAN NOTHING, please stop talking about “trends”.
So you don’t care if your annual income starts trending downwards at say $20,000 per year, because that trend “means nothing”?
SMH …
w.
Invariably, income “trends” downward following retirement. Means nothing as consumption is in lockstep. 😉
“consumption is in lockstep” forced by the downward trend of income.
Streetcred, I have been surprised at how my income in retirement has trended upwards, to the tune of about $20,000 a year. I have tended to put the spare in utilities and oil and gas. Who’da thunk it?
Thanks Willis. I care if my income has dropped not if it is “trending”. If is has dropped I will look at why and see whether that cause will continue and how to address that. I will not extrapolate the trend outside the data and assume the tells me what I will earn in the next 10 years.
The trouble with a “trend” is that there is an implicit assumption that that helps you imply future change. See all the garbage claims made about Arctic sea ice in 2007. Sea ice is very close to the same level this year than it was in 2007.
Folks make a lifetime of fitting “trends” to stock market data, very few manage to predict the future well enough to make a cent from doing so.
My main point is that “trends” are a trap. All data has a “trend” and thus something which can be spuriously correlated with CO2. This is why “trends” have been central to climate mythology for the last 40y.
Most of the variability in this data is clearly not AGW since it is not monotonic rise and if you fit a trend the result depends a lot on the where your sample is in the short term variability. That means the paradoxical difference in slopes is even larger.
Fitting a slope is a statistical analysis. Calling it a “trend” is climate astrology.
There’s probably a lot more to be pulled from this data. The similarly to temperature is the first thing to look at. See the graphs I posted above. This strongly suggests most of what you are seeing is WV – temp relationship. Since that is your favourite point of interest, there’s probably some useful info there.
Maybe look at just the tropics, that is where the energy budget is driven and controlled.
I would like to know where the surface upward flux comes from for the percentage calculation. We don’t have global flux measurements taken under cloud level, so that must be derived from “clear sky” TOA ( which does NOT mean free of WV) or surface temps + WAG of surface emissivity.
I’d be pretty sure there’s some merrily tweaked pararmeters in there, chosen to give the “right” amount of GHE.
I think what he’s saying is “trends mean nothing” in the context of climate. Particularly when there’s so many chickens vs. eggs unaccounted for and when short term trends cloud (pardon the pun) the true long term changes.
In the context of salaries is of course an entirely different matter! 😀
Trends can be useful talking points. However, one needs to be careful how they are defined.
Why would that be “useful” if it is based on unwarranted extrapolation?
At the time of writing TotalEnergie shares have been “trending” downwards since opening of trading this a.m. 37.35 euros, down 0.12 . What will be their value tonight?
It’s “trending” down, is this time to sell ?
This trend is negatively correlated to CO2 rise, is this the “new normal”. Is my investing going to diminish ” as the world warms” ??
Extrapolations are always fraught with problems, and often are very wrong. However, the alternative is to throw up one’s hands and say it is impossible to forecast the future, so why bother? If a particular trend has a history of 30 years of approximately linear behavior, an extrapolation has a higher probability of being right than the non-linear outputs of any of the GCMs (except maybe the Russian model).
One is left with the choice of doing nothing and being unprepared, or accepting the fact that extrapolations are rarely exactly correct, but may be close enough for Day Traders to make a profit most of the time.
A trend is always perfectly linear by definition. I’ve not seem ANY climate metric which is even remotely linear over a short or extended period. Obviously you can fit a trend to anything more than one data point.
But if you want to fit a linear model you need to explain why you think that is an suitable model.
In climatology, the reason is that they “know” the long term change in temperature is due to CO2 and the intergrated CO2 forcing is roughly linear.
They are NOT even attempting deductive science, they are arranging fake “proof” of a predetermined result.
I think that you are confusing a first-order, least-squares regression, where the slope of the equation represents a trend, with the common English word “trend:”
https://www.merriam-webster.com/thesaurus/trend
See my article here for an analysis of Hansen’s temperature data:
https://wattsupwiththat.com/2018/06/30/analysis-of-james-hansens-1988-prediction-of-global-temperatures-for-the-last-30-years/
Temperature time-series data tend to not have high R-squared values because of the internal variation. You can over-fit the data with high-order polynomials and get high R-squared values. However, that tells one little about the actual ‘trend!’
Ja. Ja.
Is what I said from the start I investigated the probkem….
https://breadonthewater.co.za/2018/05/04/which-way-will-the-wind-be-blowing-genesis-41-vs-27/
The radiation from the surface is not the same as the radiation flux as it progresses through the atmosphere. Radiation is absorbed, passed back and forth with other molecules and reradiated in all directions. The net of these activities is a radiation flux.
A lot of the radiation activity does no warming. It simply passes energy from one molecule to another in a similar manner to conduction. There’s a lot more molecules lower in the atmosphere and hence more of this activity.
The surface skin is part of this passive energy movement just as it is part of energy movement via conduction. If all the energy conducted back/forth between gases and the surface was measured, it would likely be millions of w/m2. Yet, it does no warming. This is also true of the passive radiation.
To really understand the movement of energy to space you will need to remove the passive movement of energy in the same way you do for conduction. Of course, since none of the kinetic transfers result in energy going into space it is easy to remove them. You just ignore them. Not so easy with radiation.
Because of the density differences the amount of passive radiation is highest near the surface. A lot of that 398 w/m2 is passive radiation. I suspect that when you do remove it you will end up with an interesting result.
I believe the flux essentially works inversely to the ALR. The flux itself is a constant ~160 w/m2. The poorly named greenhouse effect is simply a measure of the passive radiation. The radiation exists and there’s no reason to deny it. But, it remains fairly constant (globally) and does no warming.
As an analogy think of musical chairs. During every musical period the people move around and all but one of them ends up in a chair when the music stops. Only one person is left standing. All the people located in chairs are like the passive energy. They moved around just like the person left standing but their status ended up unchanged.
I don’t think Willis will find an answer to his question since it is based on an incomplete view of what is actually happening.
I must admit I’ve always struggled with assumptions (or implementations?) of an adiabatic lapse rate. Maybe this is nearly true at sea level, but it must progressively become less and less true as the parcel of air rises up through the atmosphere and loses ever greater amounts of heat to space. Yet it always seemed to be presented as a constant, before I gave up taking courses in this area and switched to a science where you can unambiguously present your results in a flask or bottle.
Since “greenhouse” gases make up such a tiny portion of the atmosphere, and greenhouse gases are the only ones that lose any energy to space (in the IR bands), perhaps that radiation to space has very little effect on lapse rate, which is a property of the atmosphere as a whole. Besides, doesn’t the surface upward lapse rate end at the Tropopause and isn’t that where most of the radiation to space occurs?
I should not have said the flux was constant. It will be based on ocean SSTs over short term periods. Hence, it is only fairly constant measured over long time frames. In the short period of the graph you can easily see the period from 2000-2014 was almost completely flat. The absorption percentage only increased when the temperature increased as seen in the global SSTs.
https://woodfortrees.org/plot/hadsst3gl/from:2001/to/offset/plot/hadsst3gl/from:2001/to:2014/offset/trend/plot/hadsst3gl/from:2001/to:2020/trend
When the ocean temperature increased there was more water vapor released. This led to the increased absorption percentage.
This effect would overpower any changes relative to CO2 so I don’t think it tells us a lot about CO2. First you would have to subtract out the water vapor effect. OTOH, it’s pretty clear that no CO2 effect can be seen in the data.
The data pretty clearly shows it is our oceans that drive the climate train.
One might almost be led to the heretical idea that CO2 increase results in a negative feedback effect, with obvious implications for the TCS and ECS estimates. Could this be a globally averaged result of your emergent phenomenon hypothesis? Interesting.
Every time you add a CO2 molecule to the atmosphere it can participate in two energy transfer types. 1) Kinetic transfers and 2) radiation absorption/emission.
Type 1) events occur far more often than type 2) events. Although I don’t fully understand the physics, it seems to me a CO2 molecule is much more likely to receive energy from the atmosphere than from the surface. Once energized a CO2 molecule can emit that radiation to space.
It does seem like more CO2 could lead to cooling.
I’m not so sure. Can kinetic energy like this be converted to a photon? I don’t think so. I’m led to believe that an absorbed photon can be converted into kinetic energy, but I’m not certain of that either.
Edit:
I assumed by this that you meant absorbed kinetic energy is then converted into radiation. Perhaps I misunderstood.
Yes, kinetic energy is radiated as photons. The kinetic energy of gas molecules is a sum of translational kinetic and intramolecular kinetic energy (vibrations and rotations). The intramolecular kinetic energy is increased or decreased directly from absorption and emission of photons respectively. Emission and absorption also transfer momentum to the gas molecule and slightly affect translational kinetic energy.
On average, the partitioning of these two types of kinetic energy can be described as KE = 3/2kT + 3/2(r-1)kT where T is temperature, k is the Boltzmann constant, and r is the number of molecules. The first quantity is translational and the second is intramolecular. You can see that for any gas molecule comprised of more than 2 atoms, i.e. CO2, there is actually more kinetic energy contained within the vibrations/rotation than in translational energy. Thus, a gas molecule like CO2 or H2O has much lower velocity than N2 or O2.
Absorption of photons can temporarily imbalance the energy partitioning from the relationship above but spontaneous and stimulated emission as well as molecular collisions quickly restores the relationship.
The only thing that is perplexing to me is how people continue to believe in the dogma of “greenhouse” gas hypothesis when the data directly refutes it. It only takes one refutation of data or experiment to disprove a hypothesis, yet this one lives on. Last time I checked there was CO2 over the poles and CO2 is supposedly responsible for a large percentage of the supposed feedback according to the hypothesis – up to 76% is claimed by the climate cult. Yet the data shows there is no “greenhouse” effect over Antarctica at all.
The reason why of course was mentioned by Chris – CO2 molecules receive far more energy from conduction between other molecules than they do from absorbing LWIR, and since CO2 has higher emissivity than bulk air, the rate at which the atmosphere can cool is increased. This was experimentally confirmed back in the early 80s when IR active gases (including CO2) were tested in gas filled windows for their insulating properties and it was found that their increased emissivity more than offset their IR absorption.
P.S. Another interesting observation is of the desert regions of the horse latitudes. Much of these regions, especially the Sahara Desert, actually lose more energy to space than they receive from the sun, despite showing absorption of LWIR from the surface. This further suggests that you should probably consider increased emissivity when discussing the increased absorption from certain gases in the atmosphere.
Most physical processes are reversible. For example, we know gases which absorb radiation also emit radiation at the same rate.
The kinetic energy of a collision can affect the vibrational energy of the CO2 bonds. Hence, it can energize the CO2 and potentially lead to spontaneous emission.
The opposite is also true. The vibrational energy within the CO2 bonds can be transferred during a collision to other molecules.
“One might almost be led to the heretical idea that CO2 increase results in a negative feedback effect, with obvious implications for the TCS and ECS estimates.”
That’s what my intuition tells me. While we’re adding CO2 we’re seeing a warming effect and feedbacks may even be greater than 1x instantaneously but in the long term, my intuition tells me the feedbacks will be at most 1x of the 1.1C expected warming from a doubling and probably less.
My intuition is based on the fact that CO2 is a passive effect (ie there is no actual increase in energy) and hence an increase in surface temperatures and decrease in TOA temperatures (as AGW theory predicts) means a greater temperature difference from top to bottom of the atmosphere and hence a reduction in entropy.
Feedbacks will tend to fight the reduction in entropy, not enhance it. The whole 3x multiplier on the CO2 warming due to additional water vapour without due consideration for all the other feedbacks such as convection and latent heat transfer is an ill considered crock IMO.
I’ll offer my take on this question.
First, I’m not challenging the greenhouse effect. I do, however, question the enhanced greenhouse effect. Here is how the FAR puts it:
“An increase in concentrations of greenhouse gases is expected to raise the global-mean surface-air temperature which, for simplicity, is usually referred to as the ‘global temperature’. Strictly this is an enhanced greenhouse effect – above that occurring due to natural greenhouse gas concentrations. The word enhanced is frequently omitted, but should not be forgotten in this context.”
Second, I refer to the prediction of a tropospheric hotspot as a feature of models with significant climate sensitivity to CO2. This is a prediction of a rate of increase in temperature in the tropical troposphere which exceeds the rate at the surface. The ratio of the rate of temperature temperature aloft compared to the surface was referred to as the “Scaling Ratio”. In 2010, Christy et al noted the Scaling Ratio was predicted at about 1.4, but measurements produced an observation of around 0.8. Rather than amplified warming aloft, Christy observed attenuated warming.
There are good reasons for this. Even starting with the word “amplified”. Amplification is a dimensionless measure. It means “start with X, and you get more of X”. When you start with something and end up with more of the same thing, energy must have been added.
Therefore the enhanced greenhouse effect (characterised by the GCM prediction of a tropospheric hotspot) must answer the question: where did the extra energy come from?
IF there is a non-zero enhanced greenhouse effect, and an increase in radiative energy arriving at the surface, there must therefore be a radiator aloft. For any resulting warming effect at the surface, the radiator aloft must have increased its temperature by more than the surface. (That’s why the models must produce the hotspot.)
But, the enhanced greenhouse effect claims the surface is the source of the additional energy being absorbed in the atmosphere. Be careful here, it is only changes we are considering – the fact that the sun radiates to the surface is a constant, and has not changed. We therefore cannot consider the sun a a source of additional energy.
This is circular reasoning. The surface warms the hotspot, and the hotspot warms the surface. At very best, this is a perpetual motion machine: energy being supplied to the atmosphere and being (perfectly) returned to the surface.
However the atmosphere has no sense of up-versus-down. Any change in radiated flux and absorbed within the atmosphere will be radiated in all directions. This could be aggregated to 50% up and 5% down. So 50% of any additional radiative flux from the surface due to the enhanced greenhouse effect would be lost (not returned to the surface). This is a process which cannot sustain a rise in temperature.
By this reasoning, the enhanced greenhouse effect cannot sustain a rise in surface temperature by radiative exchanges of energy (which it is supposed to be). (Note, this does NOT say the underlying GHE does not exist.)
I like to envisage it in terms of energy in LW photons. Consider 2 photons coming back to the surface from the atmosphere SOLELY due to the enhanced greenhouse effect. After being absorbed in the surface (rise in temperature), consider the energy in 2 photons then leaving the surface as the warmer surface does not retain the extra energy. If both photons are absorbed and re-radiated within the atmosphere, one would be expected to be radiated back to the surface, and one would be expected to be radiated off to space. The enhanced greenhouse effect has therefore lost half of the energy in “one loop” of the energy exchange between the surface and the atmosphere.
As I said, the enhanced greenhouse effect would need to be a perpetual motion machine to sustain a rise in temperature at the surface. And that’s the mistake I believe the GCM’s make. They all claim to conserve energy, but they only do so at the TOA. Whatever goes on below the TOA can be whatever is programmed into them by the modellers. The enhanced greenhouse effect predicts a tropospheric hotspot because, I believe, the GCMs have energy exchanges which depend on a perfect (loss-free) exchange of energy between the surface and the predicted hotspot.
When Christy checked to see if the tropospheric hotspot could be observed by real-world data, it should come as no surprise that he observed an attenuated rate of warming aloft.
That’s my take on things. OK guys, shoot away and pick holes in it. I’d be interested to hear your views.
“However the atmosphere has no sense of up and down” Actually, it must since it differs with altitude and the amount of infrared from the sun is different from the amount from the surface of the earth and during the night the sun is removed from the action. The 20 year chart is not enough data…the first 15 years are a sideways trend interrupted by the upwards 5 year blip and then the data for the most recent months are back down…need at least 20 more years. Stop the earth’s rotation and one side becomes very hot and the other very cold…but does the average temp change?
Having no sense of up or down starts from the notion of a radiating portion of the atmosphere (particularly the predicted tropospheric hotspot that John Christy demonstrated does not exist) has no physical mechanism to know that the enhanced greenhouse effect relies on an increase in radiation being returned to the surface. If the direction of IR radiation from individual molecules in the atmosphere is random, there should be equal upward versus downward flux from the atmosphere in aggregate.
An equal upward versus downward flux breaks the idea that the surface warms the atmosphere which warms the surface ….. It therefore breaks the idea that an enhanced greenhouse effect can be sustained, and the models have assumed perpetual motion in the lower atmosphere (wrongly believing that a TOA energy balance would be sufficient).
If you think this is incorrect (and therefore the enhanced greenhouse effect is not a perpetual motion machine), you need to provide the physical mechanisms and demonstrate that your mechanisms operate in the real atmosphere. Your demonstrated mechanisms would then need to be included in the physical arguments for an enhanced greenhouse effect.
Correction of a typo in the above: “This could be aggregated to 50% up and 50% down.”
If the up and down fluxes were always in balance, where would fossil fuels come from?
Fair point that fossil fuels store some solar energy. But the stored energy is vanishingly small compared to incoming solar energy over the hundreds and thousands of years for their formation.
The enhanced greenhouse effect treats incoming solar radiation as a constant over the timescales of interest to the MMGW claim. Therefore the vanishingly small contribution to formation of fossil fuels can be treated as trivially small.
Then we need to address the suggestion that the surface warms the atmosphere which warms the surface which warms the atmosphere which …. is a loss-free process in the GCMs and a perpetual motion machine. It is the basis of the claim of the tropospheric hotspot and the “amplified” warming aloft in the tropical troposphere.
Amplified warming aloft depends on an active (energy accumulative) response to CO2. John Christy demonstrated that the GCMs do not represent the atmosphere when he showed the warming aloft is attenuated. Attenuated warming aloft is a characteristic of a passive (energy dissipative) response.
Two comments.
First, your figure two proves that water vapor is the main GHG. Near the equator where it is high (specific humidity), LWR absorption is higher than ‘average’. Near the poles were it cold and specific humidity is low, LWR absorption is low, presumably mostly from CO2.
Second, I cannot figure out how you computed your red line in Figure 4. The canonical 3.7w/m2 CO2 forcing per doubling leads to about +1.16C in the absence of feedbacks (I use Monckton’s equation and his standard inputs -Lindzen just uses 1.2C). We know ECS is likely about 1.7C observationally, mainly because the WVF is positive (see my recent ECS post for details derived using Bode 1/(1-f) and cloud and precipitation observations. So about 1.7/1.16 about 47% higher than CO2 alone. The yellow line in figure 4 is observationally everything Ceres ‘sees’ absorbed, including by water vapor. So logically, the red line should be about 70% of the yellow, not twice. Perhaps an assumptional or calculational translation error in estimating the red line?
Rud, my friend, always good to hear from you. I convert the CO2 forcing in W/m2 into % of upwelling the same way I convert the (surface_upwelling – TOA_upwelling) into % … by dividing that by surface_upwelling.
Also, while it’s true that the main GHG is water vapor, that doesn’t explain why the red line is larger than the observed change in the greenhouse absorption.
w.
Rud, Willis,
I know this will sound out of place and weird, possibly wrong too.
Remember experiment is a very important main method in science.
In consideration of the experiment dealing with radiative potential… RF impact in climate;
The GCMs,
clearly show that radiative global warming is not possible either in natural term, or man made.
GCMs produce a radiative “WARMING” that is not compatible either with natural climate or the assumed man-made one.
In both cases CO2 concentrations follows the CO2 emissions, and where even in climastrology is accepted that in the natural term CO2 concentrations follow temps, but in the assumed impact of man-made that changes and the temperature follows CO2 concentrations.
In the experiment, the models that actually do a radiative warming, that is completely different.
Not only temps follow CO2 concentration, by default of the setup,
but so too do the CO2 emissions for a good while at the first stage, following and lagging the artificial CO2 concentrations increment… the knob.
So according to models the only way the radiative warming can happen, is only if as for
some miracle there, where the CO2 concentration increases in it’s own, ahead and regardless of CO2 emissions.
Meaning that any radiative theory of climate should consider such clause very seriously.
No really sure how much this could help or not, but just saying.
Please do forgive me if gone out of line here.
cheers
Where do the numbers for surface upwelling come from? Could those be in error?
That is easy. The same up/down looking sensors used for both.
Where are the sensors that measure surface radiation? Surely not in the same place that measures atmosphere radiation to space. How could the two be differentiated?
Rudd, could you explain that. I don’t see any way a satellite can measure surface radiation.
Yes, this was my first qu to Willis which he did not address.
I can’t see any way this “upwelling” surface IR is anything other than CERES derived, so it’s either just “clear sky LWIR” ( which is NOT surface IR b/c clear skies still have plenty of WV ) or it is derived by some process involving some rather WAG about how things relate.
Since Willis did not document what he did and chose not to explain, it remains a mystery and the whole thing does not really tell us anything.
“We know ECS is likely about 1.7C observationally, mainly because the WVF is positive”
“Observationally” means at best TCS, not ECS.
Tim, the paleoclimate data show clearly that the CO2 effect in climate is zero point frickin zero.
So observationally there is neither CS or TCR or TCS.
Simply fictional components… useful perhaps, but still fictional.
When it comes to ECS that is plainly an AGW CS actually…
and trust me, you do not want to engage in an argument about it… as it being observational or not, at any value…
as that kind of argument will be an “electrolytes all the way down” argument.
🙂
cheers
“the paleoclimate data show clearly that the CO2 effect in climate is zero point frickin zero.”
It doesn’t. It shows other factors are much larger and drive the changes. But the paleo resolutions are very poor so it doesn’t show much at all about TCS.
Man it does.
There is swinging from 180 ppm to X value of ppms, in correlation of ~ 8 to 12C warming.
And there still is a swing from X to 180 ppm, in correlation of 8 to 12C cooling.
Where in both cases of ppm uptrend or downtrend, the CO2 forcing is the same, but the outcome completely different… in one case warming, and in the other cooling…
I am, sure and expecting a complete failure from you, as far as your ability to understand such as a simplicity permits…
Believe me… it is not your fault.
It is just what it is.
Got to live with it.
Bye bye.
Only a very few people on this forum believe CO2 has no impact whatsoever. But somehow it’s your belief that alarmists latch on to as being the typical sceptic view.
Okay, Willis, if you can persuade The Doctor to lend the Tardis to me so that I can go back to the Carboniferous period and take some real-time measurements in that hot, sweaty, dismal swamp that was land surface back then, I might be able to come up with an answer to your question.
Maybe we just don’t have enough treelike ferns doing their thing by absorbing mass quantities of CO2 and releasing O2. Don’t know. But if someone wants to build a HUUUUUUGE greenhouse with all sorts of plants crowded together – oh, wait: we’re already living on a planet like that.
Maybe the Sahara could be plumbed for subsurface water deposits and lots of trees, grasses and other plants could be grown there, but how long would it take to make the difference? And why IS the Sahara just a sea of sand but still gets snowed on?
Maybe it’s just how it is.
So many questions…..
Have a nice vacation.
The Sahara has always been cold enough at some points in the year for snow – but it is the very low levels of moisture in the air over that desert which has hitherto prevented snow from falling.
The change in the amount of water in the atmosphere due to global warming is meaning we now see snow
Very clever griff.
No body here I think denies the observed modern global warming.
That does not mean AGW though.
Now let’s see;
Do you griff deny or not the LIA?
That was as real climatic event as real as the modern LGW is. (Little Global Warming)
cheers
Incorrect, griffter. The Sahara’s surface has been found to allow snow to land and to stick around when it lands. There are more than enough photos of the sands of the Sahara with that white stuff sitting on the dunes to support this.
In regard to Saharan and sub-Saharan humidity levels, that has ALWAYS been that way. Global warming has little to nothing to do with it.
“And what is the answer to the puzzle?”
Could it be the “mysterious X factor” that David Evans (husband of Jo Nova) was seeking? I followed his posts (https://sciencespeak.com) with interest until they ended abruptly in 2015 without any conclusion. I thought some of his ideas (illustrated by Jo) were excellent. I thought he was on to something — then: silence. Perhaps he discovered he was chasing a phantom, perhaps he fell ill, I don’t know. Do you have any knowledge or ideas about this?
Yeah I recall David Evans’ exploration of the possibility of some sort of “step-change” in climate behavior loosely correlated with the approx 11 years of sun cycles.
IIRC Christopher Monckton was being kept in the loop too.
Intriguing to say the least.
He discovered an error in his code and had to rework everything. That is the last I heard, after having archived the entire first series at Jo’s. So perhaps the rework did not show what he originally thought.
I’m no mathematician but I do not understand how HALF can get back to earth. I assume that the radiation is a 360′ event. As a radiative molecule moves away from the surface, the surface will take up a reduced % of the irradiated area. Unless the molecule is on the surface, Earth cannot occupy 180′ of the output area.
i suggest when the heat energy interacts with a molecule of ghg that it only is in the molecule for a very short time and a new IR wave is released with NO directional push which means there is NOTHING going on in the atmosphere that sends any of the IR waves back towards the earth.
Sorry, but that’s not true. Radiation is emitted in the form of photons, each of which most definitely has a direction.
w.
what direction please? and why does the IR wave(photon) leave the earth in the first place? they clearly move AWAY from the surface and to me it would take some force to reverse that natural movement…..BTW ty for your response and the tone in it
Bill, each photon is emitted in a totally random direction, so ~1/2 of them are emitted going upwards and ~1/2 are emitted going downwards.
The photons leave the earth because all solid objects constantly emit thermal radiation.
Regards,
w.
sir with all due respect half going up and half down ignores sideways, and it remains there is NO directional push, so the natural movement away from the earth would continue
The re-emission is omnidirectional, true. But sideways means eventually intercepted by another GHG, and again emitted omnidirectionally. So eventually all the stuff ends up mostly up, where we measure it at TOA, or as surface backscatter using essentially the same IR instruments at the surface. Since we can sum TOA IR and surface detected backscatter IR and find them closely equalling original surface emission IR, we have pretty good observational closure (within a few percent) that sideways doesn’t really matter much in the end.
Or, if you prefer proof via simplified infinite series math rather than mere experimental observation, first re-emission 1/4 up, 1/4 down, 1/2 sideways. For the half sideways then recaptured and next re-emitted, 1/4 up, 1/4 down, 1/2 sideways. Now after just two remissions, you have (1/4+ [1/2*1/4] up, so 3/8 up, so also 3/8 down, so only 1/4 sideways— and so on. Sideways goes away pretty fast.
But earth is not flat…
And per math comment just above, that mostly does not matter.
By that logic, down goes away pretty quick as well; and it seems that up is equally retarded.
With three dimensions, & eight simplified directions, (one up, one down, and 4 sideways), a more complex simplified infinite series would be needed.
But, with respect to a sphere, and the given “averaging measurement at both the surface and 100 km above the surface”, there is in the long run only up and down. There is no perpetual sideways, like a satellite.
And it seems possible that the sideways doesn’t play by the given rules: “Where it is warmer the ground emits more radiation, so naturally more will be absorbed by the atmosphere. That means if we want to compare different areas of the earth, we need to use percentages instead of absolute values” … (how far of a push sideways is needed to skew the averages)
Good explanation, Rud.
It is nit-picking, I admit, but sideways emission has a tiny chance of escaping the atmosphere (which counts as “up,” even if at a slight angle), because it might not encounter another molecule.
Thus I think that the final chance of leaving the atmosphere (“up”) is slightly greater that returning to earth (“down”).
But the difference between “up” and “down” is too small to be significant.
There is 4 times as many ‘sideways’ as there is ‘up’, so you are seeing it correctly.
And, the logic used to discount the ‘sideways’ equally applies to the ‘up’ and ‘down’, so the ‘sideways’ can’t be discounted just because we don’t want to talk about it.
Think hemisphere!
Hemisphere works for the earth’s surface but not for the molecules. Since both CO2 and H2O are dipolar, the outward radiation does not follow spherical modeling.
Don’t think about a single point source, but an infinite number of points and what the aggregate result is.
And “sideways” in a spherical (ok, curved) atmosphere means more than 50% gets into space from TOA, as opposed to back into the atmosphere, one would think.
Also, because the atmosphere thins upwards, there’s a greater chance of a downwards moving photon being absorbed and the energy re-emitted in a random direction, including up, so slightly more in aggregate should go up to the TOA than back to the surface. Two mechanisms that should move even slightly more infrared to the TOA to escape must make it greater than 50/50, though maybe not even a percentage different. The higher in the atmosphere that a CO2 molecule is, the greater the chance that any re-emission would be ultimately away from earth.
All solid, liquid, and gaseous “objects” emit radiation in all directions all the time, except those at absolute Zero, of which there are none anywhere near our Solar System
Not entirely true.
Solid and liquid objects only emit radiation outward from their free surfaces. So their radiation is indeed directional.
And monatomic gases neither absorb nor radiate thermal longwave.
Other than that, yes.
w.
How naive are you Willis? Is this your bank exchange analogy thing again?
I made several clear scientific statements. If you disagree, pissing and moaning about me just makes you look dumb.
Quote the statement(s) you disagree with and demonstrate, not claim but demonstrate, why they are wrong.
w.
“I made several clear scientific statements.”
Hahahahahahaha!
When was that Willis? Quote me some so we can have a good laugh and slap each other on the back afterwards.
There is no evidence to support the claim that down welling radiation from the atmosphere causes surface warming. You are confused if you think that measurements from a pyrgeometer is an actual forcing.
Every article you write on WUWT is based on this evidence-free hypothesis yet you continue to push this narrative and I continue to ask you
SHOW ME THE EVIDENCE.
Or just snip or delete me as usual like a coward.
leitmotif
Leitmotif, in my comment you are replying to in your quote above, I’d said:
===
“Solid and liquid objects only emit radiation outward from their free surfaces. So their radiation is indeed directional.
And monatomic gases neither absorb nor radiate thermal longwave.”
===
Those are clear scientific statements.
Now, you’re free to provide evidence that those are not true. Or not.
But your endless personal attacks, in lieu of actually discussing the issues or falsifying my statements, are destroying whatever shreds that remain of your reputation.
w.
[Snipped]
[]
[]
Willis, I’m with Greytide re: how do we get to 50% returned to the surface, and Bill Taylor re: GHGs capture a photon for sub-sub second time frames. Emission is at random direction, so not directional other than random. Also combined with the GHG atmospheric density the % of phtons actually captured should be relativley small.
How small?
ZERO get captured, they get held for less than a second……with a criminal on the run if an officer gets a hand on them for a second but they escape do we all that a capture of that criminal?….and the no directional push is KEY…..there is NOTHING causing any of them to go back towards the earth.
Not really. Photons are “quanta”, that is, unique and discreet units of energy. That energy is transmitted by ElectroMagnetic waves of a given power. EM waves can have varying amounts of power, i.e., varying number of quanta. Examples are radio stations, microwave ovens, and even X-ray machines. You can have 1,000 Watt stations at 1 MHz and you can have 1 million Watt stations at the same frequency (wavelength). Same with microwave ovens, you can have 600 to 1200 to 1500 Watt ovens all operating at the same frequency (wavelength). The number of photons per second passing a point will vary with the power of the EM wave.
Use this link to try varying power levels and wavelengths to see how the number of photons in an EM wave can vary. CalcTool: Power to photon rate calculator
Heat is radiated in all directions at once via a spherical EM wave that has a certain power density or flux. The picture is from a textbook online, “A Heat Transfer Textbook, by John H Lienhard IV and John H Lienhard V. It is available online.
Planck also said the same thing:
Too many folks treat photons as bullets. They are not bullets, they are a fundamental part of the energy in an EM wave.
The picture didn’t come through apparently.
Einstein proved that there is no “spherical” radiation in quantum emitters. Each photon is on its own directional and the “randomness” of radiant emission is only an illusion caused by the random direction of the gas molecules themselves.
Einstein proved Planck to be wrong? Can you post a link to something showing how he did this?
http://web.ihep.su/dbserv/compas/src/einstein17/eng.pdf
He won his Nobel for it.
“This property of elementary processes as expressed by equation 2 makes a quantum theory of radiation almost unavoidableà The weakness of the theory lies, on the one hand, in its not bringing us closer to a union with the wave theory, and, on the other hand, that it leaves the time and direction of the elementary processes to chanceà in spite of this, I have full con dence in the trustworthiness of “
In other words, not even Einstein was convinced of the robustness of his derivation. If it isn’t consistent with wave theory then of what use is it?
Einstein didn’t disprove Planck. Here is what Planck said in his thesis:
Planck recognized that he was not dealing with individual atoms or molecules since that would be dealing with “complicated conditions”. Your own admission of random chance would allow for a “small volume” to radiate in all directions, thereby maintaining the substance of Planck’s conclusions.
Even Einstein said:
The illustrations I show are from The picture is from a textbook online, “A Heat Transfer Textbook, by John H Lienhard IV and John H Lienhard V.” It is available online.
You might want to write to the authors to say that they have missed Einstein’s paper on radiation and that their conclusions are all wrong and that their textbook should be withdrawn from use.
Greytide, while that’s true, it’s what I call “a difference that makes no difference”. First, much of the re-radiation takes place close to the surface, where mountains are higher than the actual horizon.
More importantly, the “dip of the horizon”, the angle below the true horizon, is
acos(R/(R+h))
where R is the earth’s radius and h is the height above sea level.
So suppose the radiation is coming from 5 km. That gives us
acos(6370/6380) = 2.25°
Since this is quite small, it is usually ignored in first-cut calculations of the type above.
See here for a discussion of the math involved.
Regards,
w.
Thank you Willis, I was under the impression that it all happened at altitude but, as CO2 is a well mixed gas, I guess that isn’t true.
Don’t confuse the lower troposphere where all this capture/re-emission with the effective radiating level (up in the troposphere after water vapor ceases to be a big factor because of the lapse rate) where the GHE ceases to be a factor. We can measure that level by the ‘temperature’ (frequency energy) of the TOA escaping IR. The ‘temp’ is about -19C, so with a lapse rate of about 6.5C/km the ERL is about 5 km up. Which is why, as WE pointed out, Earths curvature does not play a big role for these first order approximations.
Dead on. This presumption of “approximately half” of the re-emitted radiation going back to the surface drives me nuts as well. If you are close to the surface then it’s a good approximation, but as the energy rises (either via a photon or as kinetic energy in an atom) any re-emitted photon energy has smaller chance of striking the Earth again. One has to include the curvature of the Earth in any model meant to understand radiative atmospheric energy balance.
And as far as I know, you can’t simply ignore kinetic energy either. Warmed atoms emit excess energy as radiative energy. Atoms move. Warm atoms tend to move upward. So the emission of radiative energy due to warmed atmosphere tends to be moving away from the ground, and therefore less likely to strike it.
The state change of water is an especially efficient transport mechanism for heat energy which must become radiative energy to escape the planet. The state change from gas to liquid and then ice occurs high up – not at the surface. If you are simply measuring up-welling radiation, you cannot just presume it all came from the surface.
Robert of Texas, I had once thought you were Robert Felix, but since ha passed a month ago, I will put that thought away.
It’s a simplification. The thin skin of air is nothing compared to the radius of the Earth, so climate scientists can pretend that the world is flat…. maybe that’s why their models don’t work… 🙂
And the higher in the atmosphere the more long wave radiation from the sun will be radiated away from the surface, therefore having a cooling effect.
Thank you Willis for this puzzle!
I’m a newbie – so sorry for my silly questions!
My first thought was – if co2 is a “well mixed gas” – how can the chart show no ghe on the south pole? Could it be that water vapor is the main ghe and co2 is only a minor player?
(several scientist suggest ECS<1)
kind regards
SteenR
yes co2 is a very minor player in an equation with maybe a million factors at play
First, on my planet the only silly/stupid/foolish question is the one you don’t ask … because you’ll never get the answer.
Next, in addition to less water vapor, the longwave absorption of CO2 is temperature-dependent. See the colored lines here for details, compared to the CO2 notch showing absorption. (Set the CO2 to 0 to see what the notch does).
w.
Less intensity of radiation doesn’t mean there aren’t incident photons.
P.S. Have you addressed the “mystery” of large regions of the horse latitudes emitting more radiation to space than they receive from the sun? This clearly is not explained by simply saying it’s “temperature dependent” considering these are among the hottest surfaces on Earth.
https://www.researchgate.net/publication/320918200_Measurement_of_the_Earth_Radiation_Budget_at_the_Top_of_the_Atmosphere-A_Review
I think it may be that globally almost all downwelling longwave radiation is from water vapour and it’s too cold in Antarctica for there to be much water vapour. CO2 has, I believe, a much longer relaxation time (microseconds rather than nanoseconds) and so loses much more of its energy to thermalisation. Jack Barrett of Imperial College did a very interesting paper on this in 1994 “The roles of carbon dioxide and water vapour in warming and cooling the Earth’s troposphere”.
yep, runaway cooling is way more of a thing than runaway warming.
“…which is then radiated again with **************** about half going back to the ground.”
Without added work – just flat not possible.
“The principle of science, the definition, almost, is the following: The test of all knowledge is experiment. Experiment is the sole judge of scientific “truth.””
Richard P. Feynman, “Six Easy Pieces”
https://principia-scientific.org/debunking-the-greenhouse-gas-theory-with-a-boiling-water-pot/
The non-radiative heat transfer processes of the contiguous participating atmospheric molecules prevent the surface from upwelling LWIR as a BB and supplying the “extra” energy required by the GHGs to warm as advertised.
Don’t mention it!
apologies MOD … seems you have today
Maybe it is due to the installation of solar panels having an absorptive effect and emoting less bad juju
https://www.treehugger.com/ask-pablo-do-solar-panels-contribute-to-the-heat-island-effect-4857811
Judging from the graphs, I’d say CO2 doesn’t have any effect (the percentage was flat on average though the first half of the graph though co2 was steadily increasing) and only increasing water vapour from the last El Nino caused the percentage to dramatically rise above average, but then settle back down once El Nina took over, which would have been impossible under co2-doomsday physics.
Is that a non-binary meteorological event?
Pronouns ze/zir
Why do we insist on putting linear trend lines on these types of graphs, and then making profound conclusions/interpretations from them? The “trend” prior to 2015 is flat. The “trend post-2015 is higher, but still flat (or a curve). The linear trend only exists by gluing two periods of low flat to one period of high flat. If in the next 5 years the temperatures are up-and-down about a flat, the longer term trend will be flat but somewhat higher than previously, but not necessarily showing a linear trend of any substance or validity.
The constant insistence on creating linear trends to non-linearly increasing data, in my opinion, is a bad idea as it reinforces the false idea that a linearly increasing trend necessarily exists. I understand that linear trends are easier for the under technically educated public to grasp, but they fit into the not necessarily correct CAGW narrative of CO2 as a unitary control button. Here I don’t see a linear trend except for a manufactured, grossly simplified, mathematical product.
I’m a geologist. We have a term for changes over geologic time: “punctuated equilibrium”. That is what I see in the temperature records. Periods of not-much punctuated by periods of a-lot. IF there is a significant linear trend due to CO2 or other factor, it is well hidden in the records (though NOAA/GISS/Schmidt has done a good job of creating one with homogenization, corrections, data removal etc). A punctuated equilibrium says that extraordinary events precipitate sudden changes. Our focus in geology is on what those events are (mostly we don’t know but guess widely and wildly). For these climate/temperature records, we should do the same: why the sudden jump? Episodic temperature release from the oceans? Cloud cover patterns?
I think we should be showing these trends closer to how they are, and showing the public that linearity is a mathematical production. I don’t find a discussion of linear trends in (especially recent) temperature trends meaningful when we don’t first address why we have the “hiatuses” with subsequent jumps, and that the data shows this, and any linear trend is a third order gross simplification.
Of course the GISS global temperature plots don’t show this at all, which should be an overarching discussion as the alarmists and the skeptics simply don’t show/use the same temperature progressions over time, and so there is no possible meaningful discussion of what is going on.
At one time nearly all climate research was the realm of the geologist. Now I see economists, philosophers and all manner of academics pretending to be climate scientists. I yearn for the old days and mourn the loss of belief in pure data and observations. I often wonder if any of todays experts ever leave their armchairs to look out of the window.
The various phenomena in the atmosphere combine in a time series continuous function. The phenomena are not coherent causing varying conditions to be displayed in the climates on earth.
Using a linear trend to predict where this continuous function is going to go next is akin to plotting a trend on the numbers thrown on a dice and trying to predict what the next number will be. Put yourself in the time of 50 years before the Little Ice Age. Do you think anyone predicted it was coming. If you show someone today the preceding two centuries prior to the LIA, how many would say well it looks like the LIA will be happening soon?
How many times in the glut of climate propaganda have we seen “if the trend continues,” “at this rate,” “increasing by __ per __,” etc.?
All nonsense, because none of it is based on any knowledge of the causes of observed changes, only the stupid and incorrect assumptions of the cause, which is all down to the CO2 fetish.