The Truth About Heat Waves
By Jim Steele
For those who truly want to be guided by science, put aside the climate crisis hysteria. We can explain the natural dynamics of all heat waves by simply knowing 1) how heat is transported along the earth’s surface; 2) how heat is transported vertically; 3) how solar heating changes; and 4) how the greenhouse effect varies.
Below is a map of global temperature anomalies for the year 2014 that illustrates natural climate dynamics. There is no uniform warming that might be expected from a global blanket of greenhouse gases. Across the globe, surface temperatures alternate between regions of above average warmth (red) with regions of below average (blue). (Gray regions lack sufficient data). Indeed, the observed cooler eastern USA is dubbed a “warming hole” by climate scientists because its cooling trend contradicts global warming theory. It requires a natural climate dynamic explanation.

The temperature pattern is associated with regions where warmer air from the south more frequently intruded northward, while simultaneously, cold air from the north intruded southward. This pattern is due to a naturally wavy jet stream and associated pressure systems. The warm red regions indicate regions where high‑pressure systems dominate. In the northern hemisphere, high pressure systems cause clockwise atmospheric circulation that pulls warm air northward on its western side, and cold air southward on its eastern side. Low pressure systems circulate counter-clockwise, conversely pulling cold air southward on its western side. These combined circulation patterns partly explain both the extreme cold that dropped Texas temperatures as much as 50° F below average in February 2021, as well as extreme heating that raised USA’s northwest temperatures 30°- 40° F above normal the following June. Similarly in 2019, northward transport of heated air from the Sahara desert caused heat waves over Europe and Greenland. Such natural heat transport can also cause coastal Alaska to be warmer than Florida.
Below is an illustration of how high and low‑pressure systems also cause opposite patterns of vertical air circulation, as in the natural Madden‑Julian Oscillation. Low pressure systems are regions of upward rising air. As the air rises, water vapor condenses to form clouds. Although the clouds increase the greenhouse effect, clouds reduce solar heating to a greater degree. The net effect causes cooler surface temperatures. To balance the weight of rising air, the air must sink elsewhere, causing a high‑pressure system. However, that sinking air is now almost devoid of water vapor. The resulting clear skies reduce greenhouse effect, allowing more infrared heat to escape, but also increases solar heating. Because increased solar heating is greater, the net effect is warmer surface temperatures.
High‑pressure systems often cause heat waves due to how heat is transported, their associated clear skies and increased solar heating. The eastward moving Madden‑Julian Oscillation, as well as El Nino and La Nina events along with other oscillations, can unexpectedly interact to amplify regions of sinking air and thus determine the location of a high‑pressure system and heat wave.

Finally, vertical air motion adds another warming dynamic. The gas laws are unequivocally proven physics and state that by simply increasing pressure, air temperature will increase without any added energy (aka adiabatic warming). Thus, the increasing weight of the atmosphere on sinking dry air warms that air by 5.4°F for every 1000 ft it descends. In addition to surface wind transport, this dynamic contributed to record heat on the northern tip of the Antarctic peninsula where air was descending from the mountains. Along the west coast of the United States, air pushed from the Sierra Nevada to the ocean coast (aka the Santa Ana and Diablo winds) causes California to experience unusually warm temperatures (and larger fires) during the winter. A similar descending flow of air from the Cascade mountains, contributed to the June 2021 extreme heat wave in Washington and Oregon.
Even when descending air doesn’t reach the surface, it also warms the surface by suppressing convection. Air contacting the earth’s solar heated surface warms and rises (aka convection). However, air only rises if its warmer than the surrounding atmosphere. Descending air from several thousand feet in altitude warms as it falls. Yet despite that warming air only reaching 100 feet above the ground, it suppresses convection that normally carries heat from the surface to the upper troposphere. The effect is like the extreme warming of a car’s interior when rolled up windows prevent heated air from leaving.
The world’s expert on northwestern USA’s weather, Cliff Mass, has presented evidence showing the 2021 heat wave was a “black swan event” where all the natural dynamics discussed above converged. As illustrated by global warm and cold anomalies below, the northwest heat wave was a uniquely local event. Yet to support his agenda, President Biden has fear-mongered the Northwest heat wave as a global climate crisis. Biden doesn’t know science and would look foolish in a climate debate. Disturbingly, some scientists dependent on global warming funding also suggest only global warming explains that heatwave. However, they ignore the fact that the heatwave’s clear skies reduce the local greenhouse effect driven by water vapor. Additionally, global warming can’t explain cold events such as Europe’s record cold just 2 months earlier. So, beware! The media is promoting misinformation. Only natural climate dynamics scientifically explain recent extreme weather events.

Indeed, the observed cooler eastern USA is dubbed a “warming hole” by climate scientists because its cooling trend contradicts global warming theory. It requires a natural climate dynamic explanation.
Thank you for the opportunity to post this one again:
More than a few exhibit cooling since the 19th century
Perhaps there are so many weather stations in the United States that it’s difficult for the climate crusade to “adjust” them all.
“Changes in the occurrence of record-setting daily temperatures are also apparent. Very generally, the number of record lows has been declining since the late-1970s while the number of record highs has been rising. By extension, there has been an increase in the ratio of the number of record highs to record lows (Figure 6.5). Over the past two decades, the average of this ratio exceeds two (meaning that twice as many high-temperature records have been set as low-temperature records). The number of new highs has surpassed the number of new lows in 15 of the last 20 years, with 2012 and 2016 being particularly extreme (ratios of seven and five, respectively).”
https://science2017.globalchange.gov/chapter/6/
The IPCC tells us that the warming will be in the winter, at night and in the higher latitudes. So on an annual basis, there will be lots of warm winter days that set records, and not so many in the summer, see that map in the first post.
But it isn’t warm winters that the climate crusaders scream about. We are forever treated to images of summer droughts with cattle skulls and dry cracked river bottoms and scary headlines.
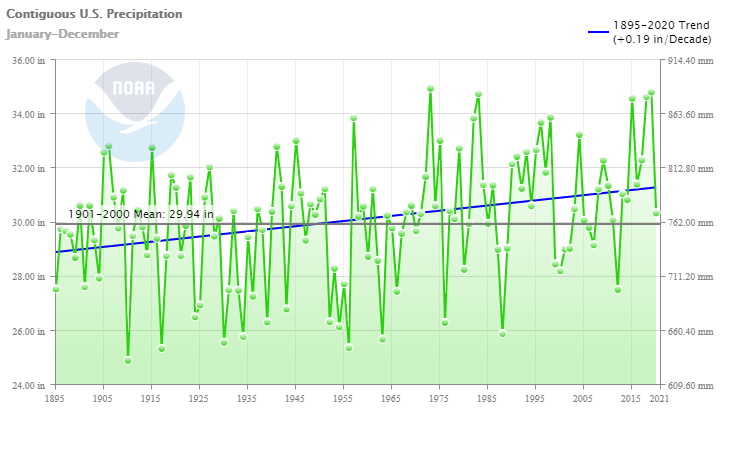
Climate at a Glance tells us that precipitation in the United States is up since the 19th century. But the climate crusade is forever screaming about drought.
Whenever the jackwaggons start yammering on about climate change (i.e., “global warming”) causing draughts, I always bring them up short with the retort that a warmer earth, according to the laws of physics and thermodynamics, MUST be a wetter earth, or at least, have a wetter atmosphere and therefore MORE precipitation, not draughts. A warming earth necessarily means warming oceans and seas, and warming water always, according to the laws of physics, chemistry, and thermodynamics MUST exert a higher vapor pressure thus transferring more water vapor to the atmosphere, subject to limits imposed by relative humidity. And a warming atmosphere necessarily can hold a higher proportion of water vapor than a cooling atmosphere, thus for any constant proportion of water vapor in air, the warmer the air the lower the relative humidity, and vice versa..
Every pilot, mariner, farmer, and anyone else who works outdoors knows this stuff almost intuitively.
But not the yammering scientifically illiterate fools who populate the warmunista cabal.
According to geoengineeringwatch.org the fact that the Earth is getting both hotter and dryer at the same time is an indication of onging geoeneneering. That is not just plans, etc. but the actual programs.
This includes artificial nucleation of snow or rain, that removes moisture from air.
It’s a bit difficult to see any warming in the US.
“The IPCC tells us that the warming will be in the winter, at night and in the higher latitudes.”
Except that’s not what they say.
Whatever they say will be wrong because they only look at mid-range temperature averages so they have no idea what is actually happening!
Antifa Simon lays down the law!
Trump Russia colluuuusion 😉
Simon says, “Except that’s not what they say”
Here’s what the IPCC says in their AR4 Report Chapter Ten Page 750:
“Almost everywhere, daily minimum temperatures are projected to increase faster than daily maximum temperatures, leading to a decrease in diurnal temperature range. Decreases in frost days are projected to occur almost everywhere in the middle and high latitudes, with a comparable increase in growing season length.”
Daily minimums occur at night, Frost days occur in winter and high latitudes means high latitudes.
“Climate at a Glance tells us that precipitation in the United States is up since the 19th century. But the climate crusade is forever screaming about drought.”
Then you shouldn’t read just climate contrarian Blogs.
It’s quite simple.
Warmer air holds more water (Absolute humidity).
Warmer ocean surface evaporate more WV.
Ergo WHEN it rains there will be more of it.
Simples.
Meanwhile.
When it doesn’t there MAY be drought.
That is actually a really really funny graph made even funnier by the fact it went straight over your head.
Anthony Banton can I give you a small science experiment
1.) Toss a coin 20 times and record head/tail
2.) Now work the distance from the 50/50 expected result.
More heads = red more tails =blue
3.) Now repeat that 70 times and show us your result
Can I tell you what will happen … you will get spikes like above based off nothing more than 50/50 chance.
For any scientist to use that method is beyond bad it’s criminal because it’s dropkick stupid.
“That is actually a really really funny graph made even funnier by the fact it went straight over your head.”
And which graph would that be?
That you so scientifically handwaved away with no peer-reviewed science to refute it.
“For any scientist to use that method is beyond bad it’s criminal because it’s dropkick stupid.”
YOU are not a scientist – and you just performed QED.
Handwaving with ad hom is not science ….
Unless you are m’Lord that is.
But even during the present interglacial period trees could grow much closer to the poles and much higher up the mountain than they can today. Somehow it must have been warmer when that was possible.
http://notrickszone.com/2012/05/24/multiple-glacier-studies-show-wide-holocene-climate-variations-in-asia-and-europe/
Look, with respect, causes of warming/cooling prior to the industrial age were nothing to do with an injection of CO2 into the atmospheres a driver.

We know what it was.
CO2 then was a feedback and climate responded to the very slow changes in Earth’s orbital motion.
So in the HCO FI there were approx 40 W/m2 more summer TSI at 65 deg N (where it can be directly be absorbed to melt snow/ice and warm the atmosphere).
Mr. Banton: Your chart is easily falsified, hi temp records from the thirties are still all over the books. Flip it and you might have a conversation starter, for now all you got is a reason to contact the good folks at global change and tell them the bad news- they got the chart backwards.
His chart is probably correct, particularly since it doesn’t seem to take in to account the life span of measuring sites or UHI. Not useless, but far from complete info.
Mr Courtney (and J Steele):
I am afraid you misinterpret the graph ….
The link I posted (and quoted verbatim) says …
“By extension, there has been an INCREASE IN THE RATIO of the number of record highs to record lows (Figure 6.5). Over the past two decades.
So that in the last 20 years there have been many mor record maxes recorded than record mins.
Because record lows are dropping while record highs are essentially flat.
Lies, damned lies and statistics. Since lower temperatures are rising and higher temperatures are static, you get the above graph. It is your U.S. government lying to you.
Handwaving conspiracy may cut it here but not in science.
And what you have said is still warming as it is a measure of the GMST.
BTW: Not MY Government.
I am English.
But is the dangers of the heat that politicians and their paid bureaucrats are hyping. They are giving out information in such a manner as to manipulate opinion as to the presumed dangers of heat.
Look at all those cold records in the 1960’s and 70’s. CO2 is amazing, it can do anything.
I bet a plot of the actual number of observations used to generate this plot would be interesting, not to mention an analysis of where and how the temperatures were reported.
“Look at all those cold records in the 1960’s and 70’s. CO2 is amazing, it can do anything.”
The forcing of CO2 alone (vs the -ve forcings) was near non-existent in that period.
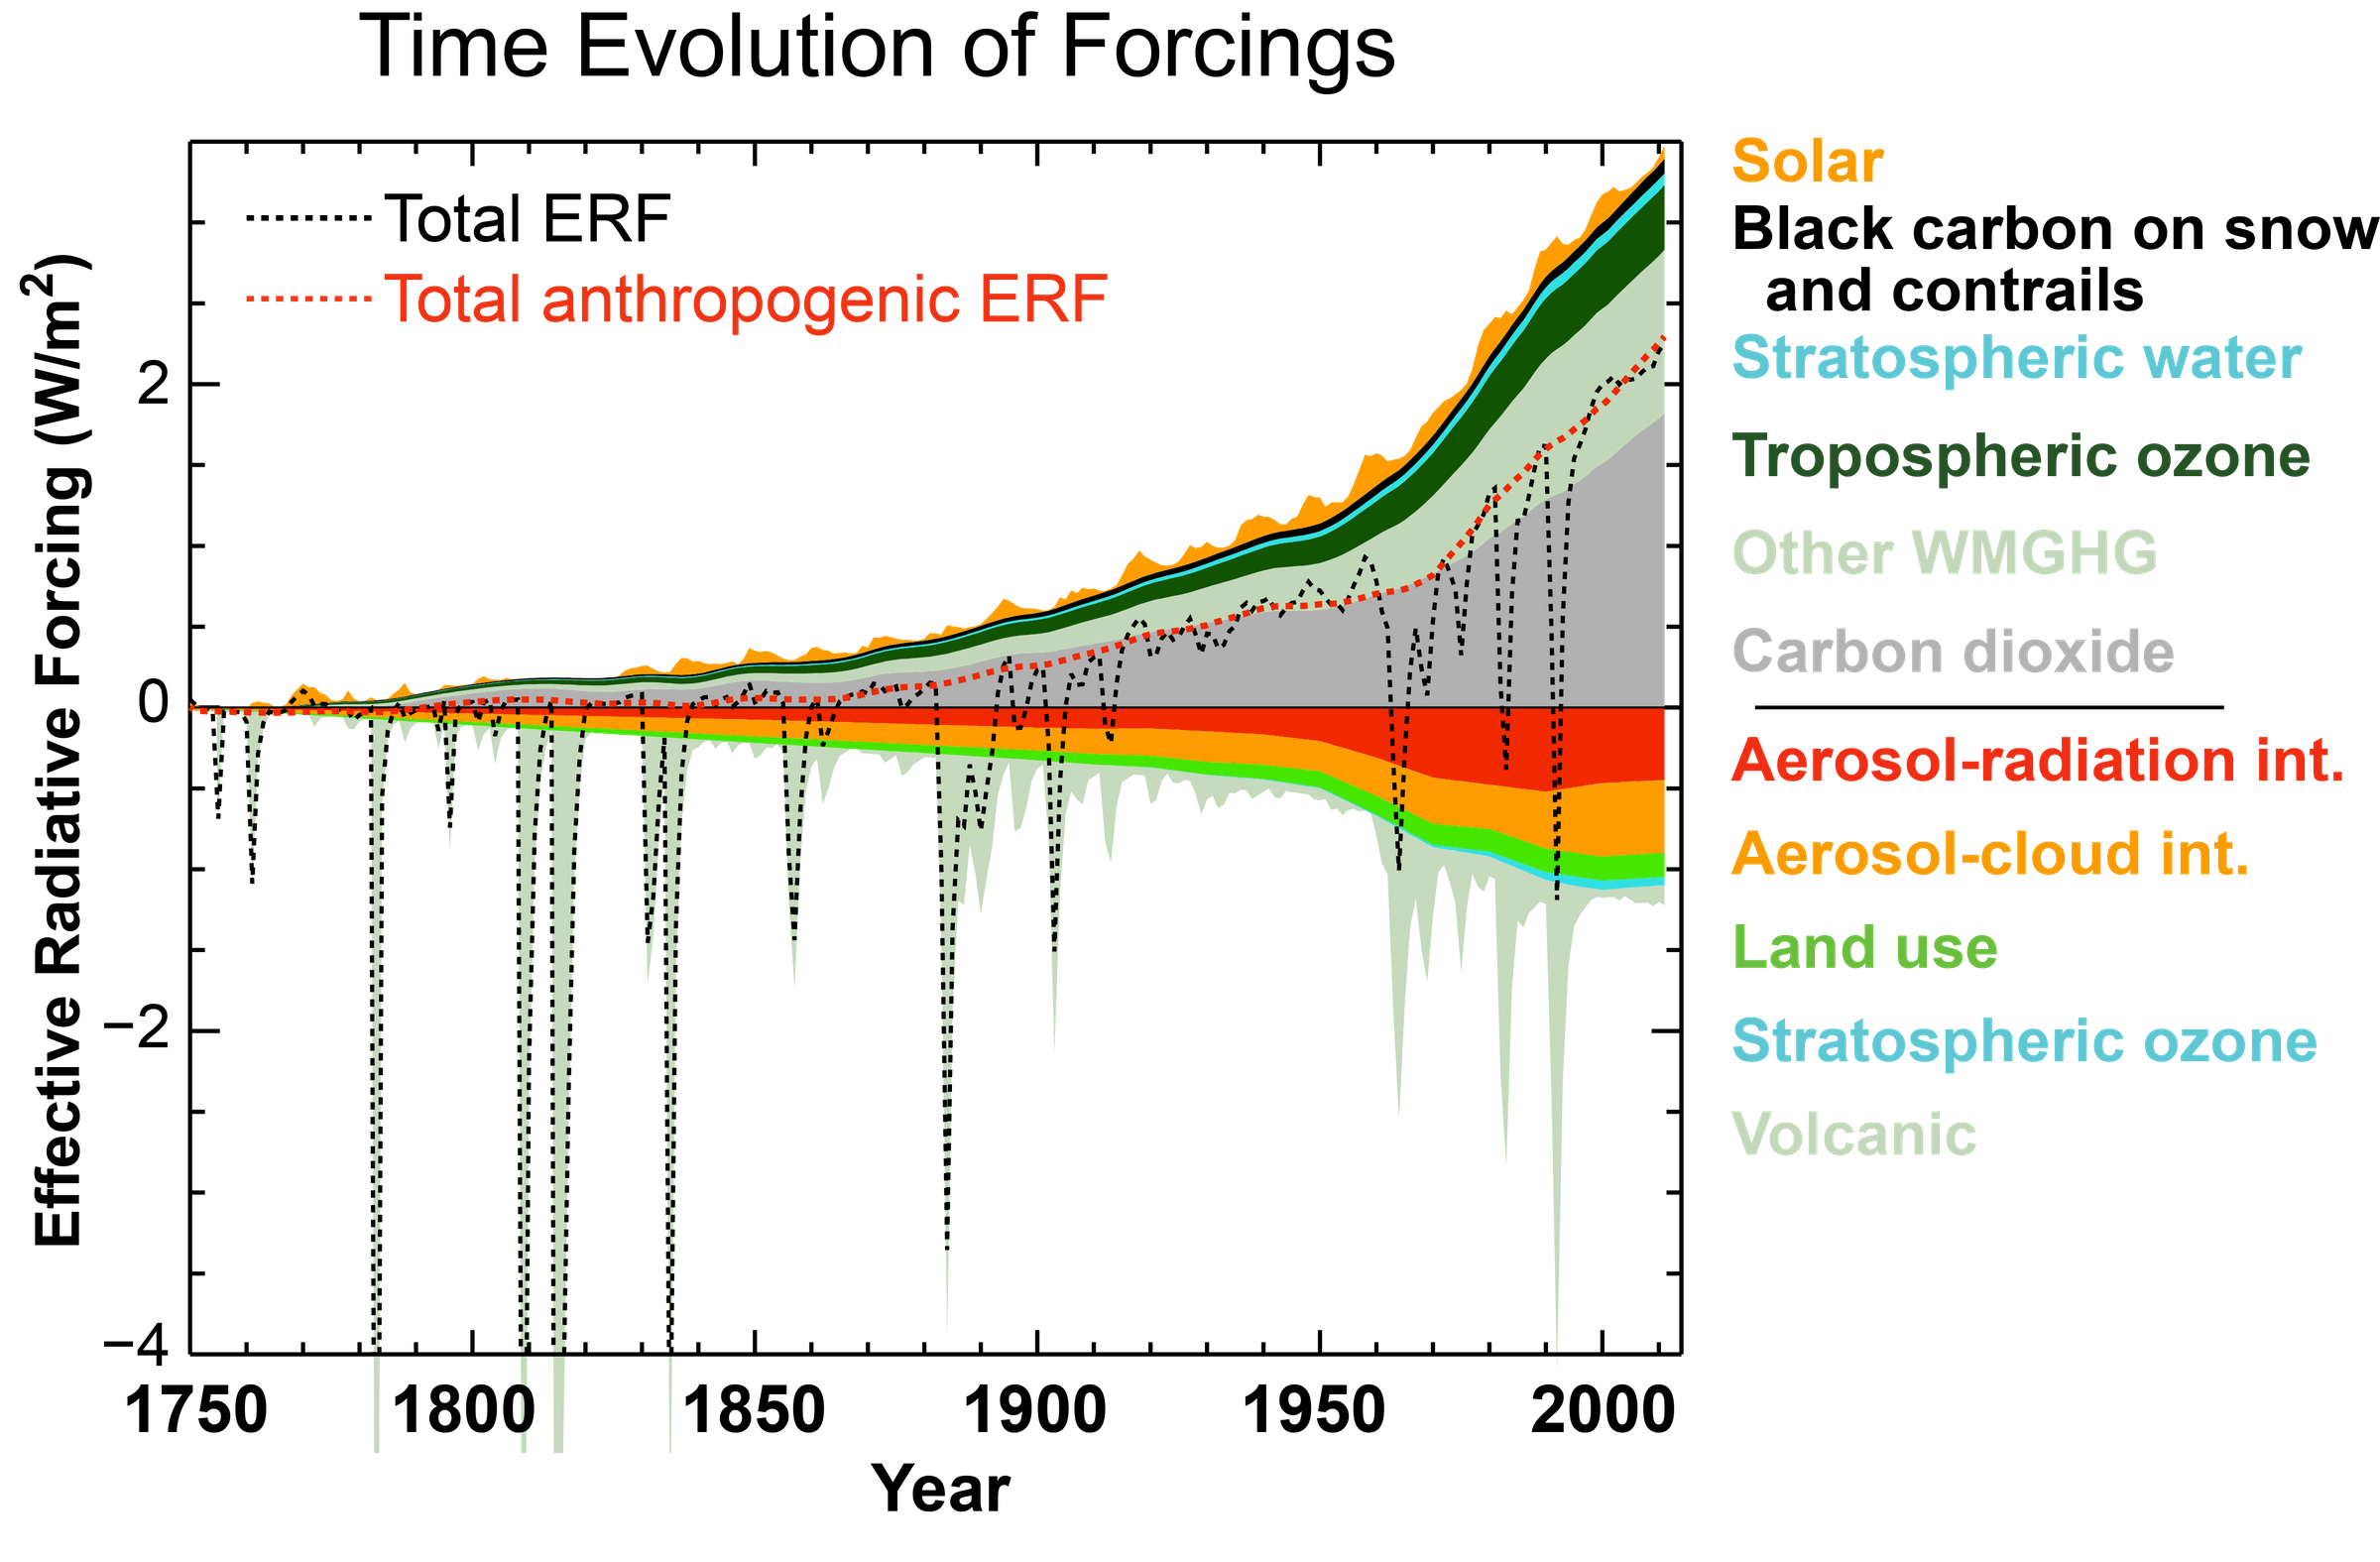

It was a time when atmospheric aerosol was high after the post WW2 industry ramped up without any sort of clear air act (Global dimming), being ~ 0.8 W/m2 compared to the present ~ 3.0 W/m2
Pretty graphs. Show them as a percentage of total energy flows in the climatic system. They are down in the practically unmeasurable percentages. Minor changes in any of the major flows completely overwhelms CO2 effects.
RUN AWAY!!
?
Hmmm how does your chart square with the EPA chart for USA heat waves??
see above
Exactly! Your cherrypicked fear mongering above is TOTALLY refuted by EPA’s estimate of heatwave trends
“Hmmm how does your chart square with the EPA chart for USA heat waves??”
perfectly fine – if you had managed to comprehend what my linked chart showed ….
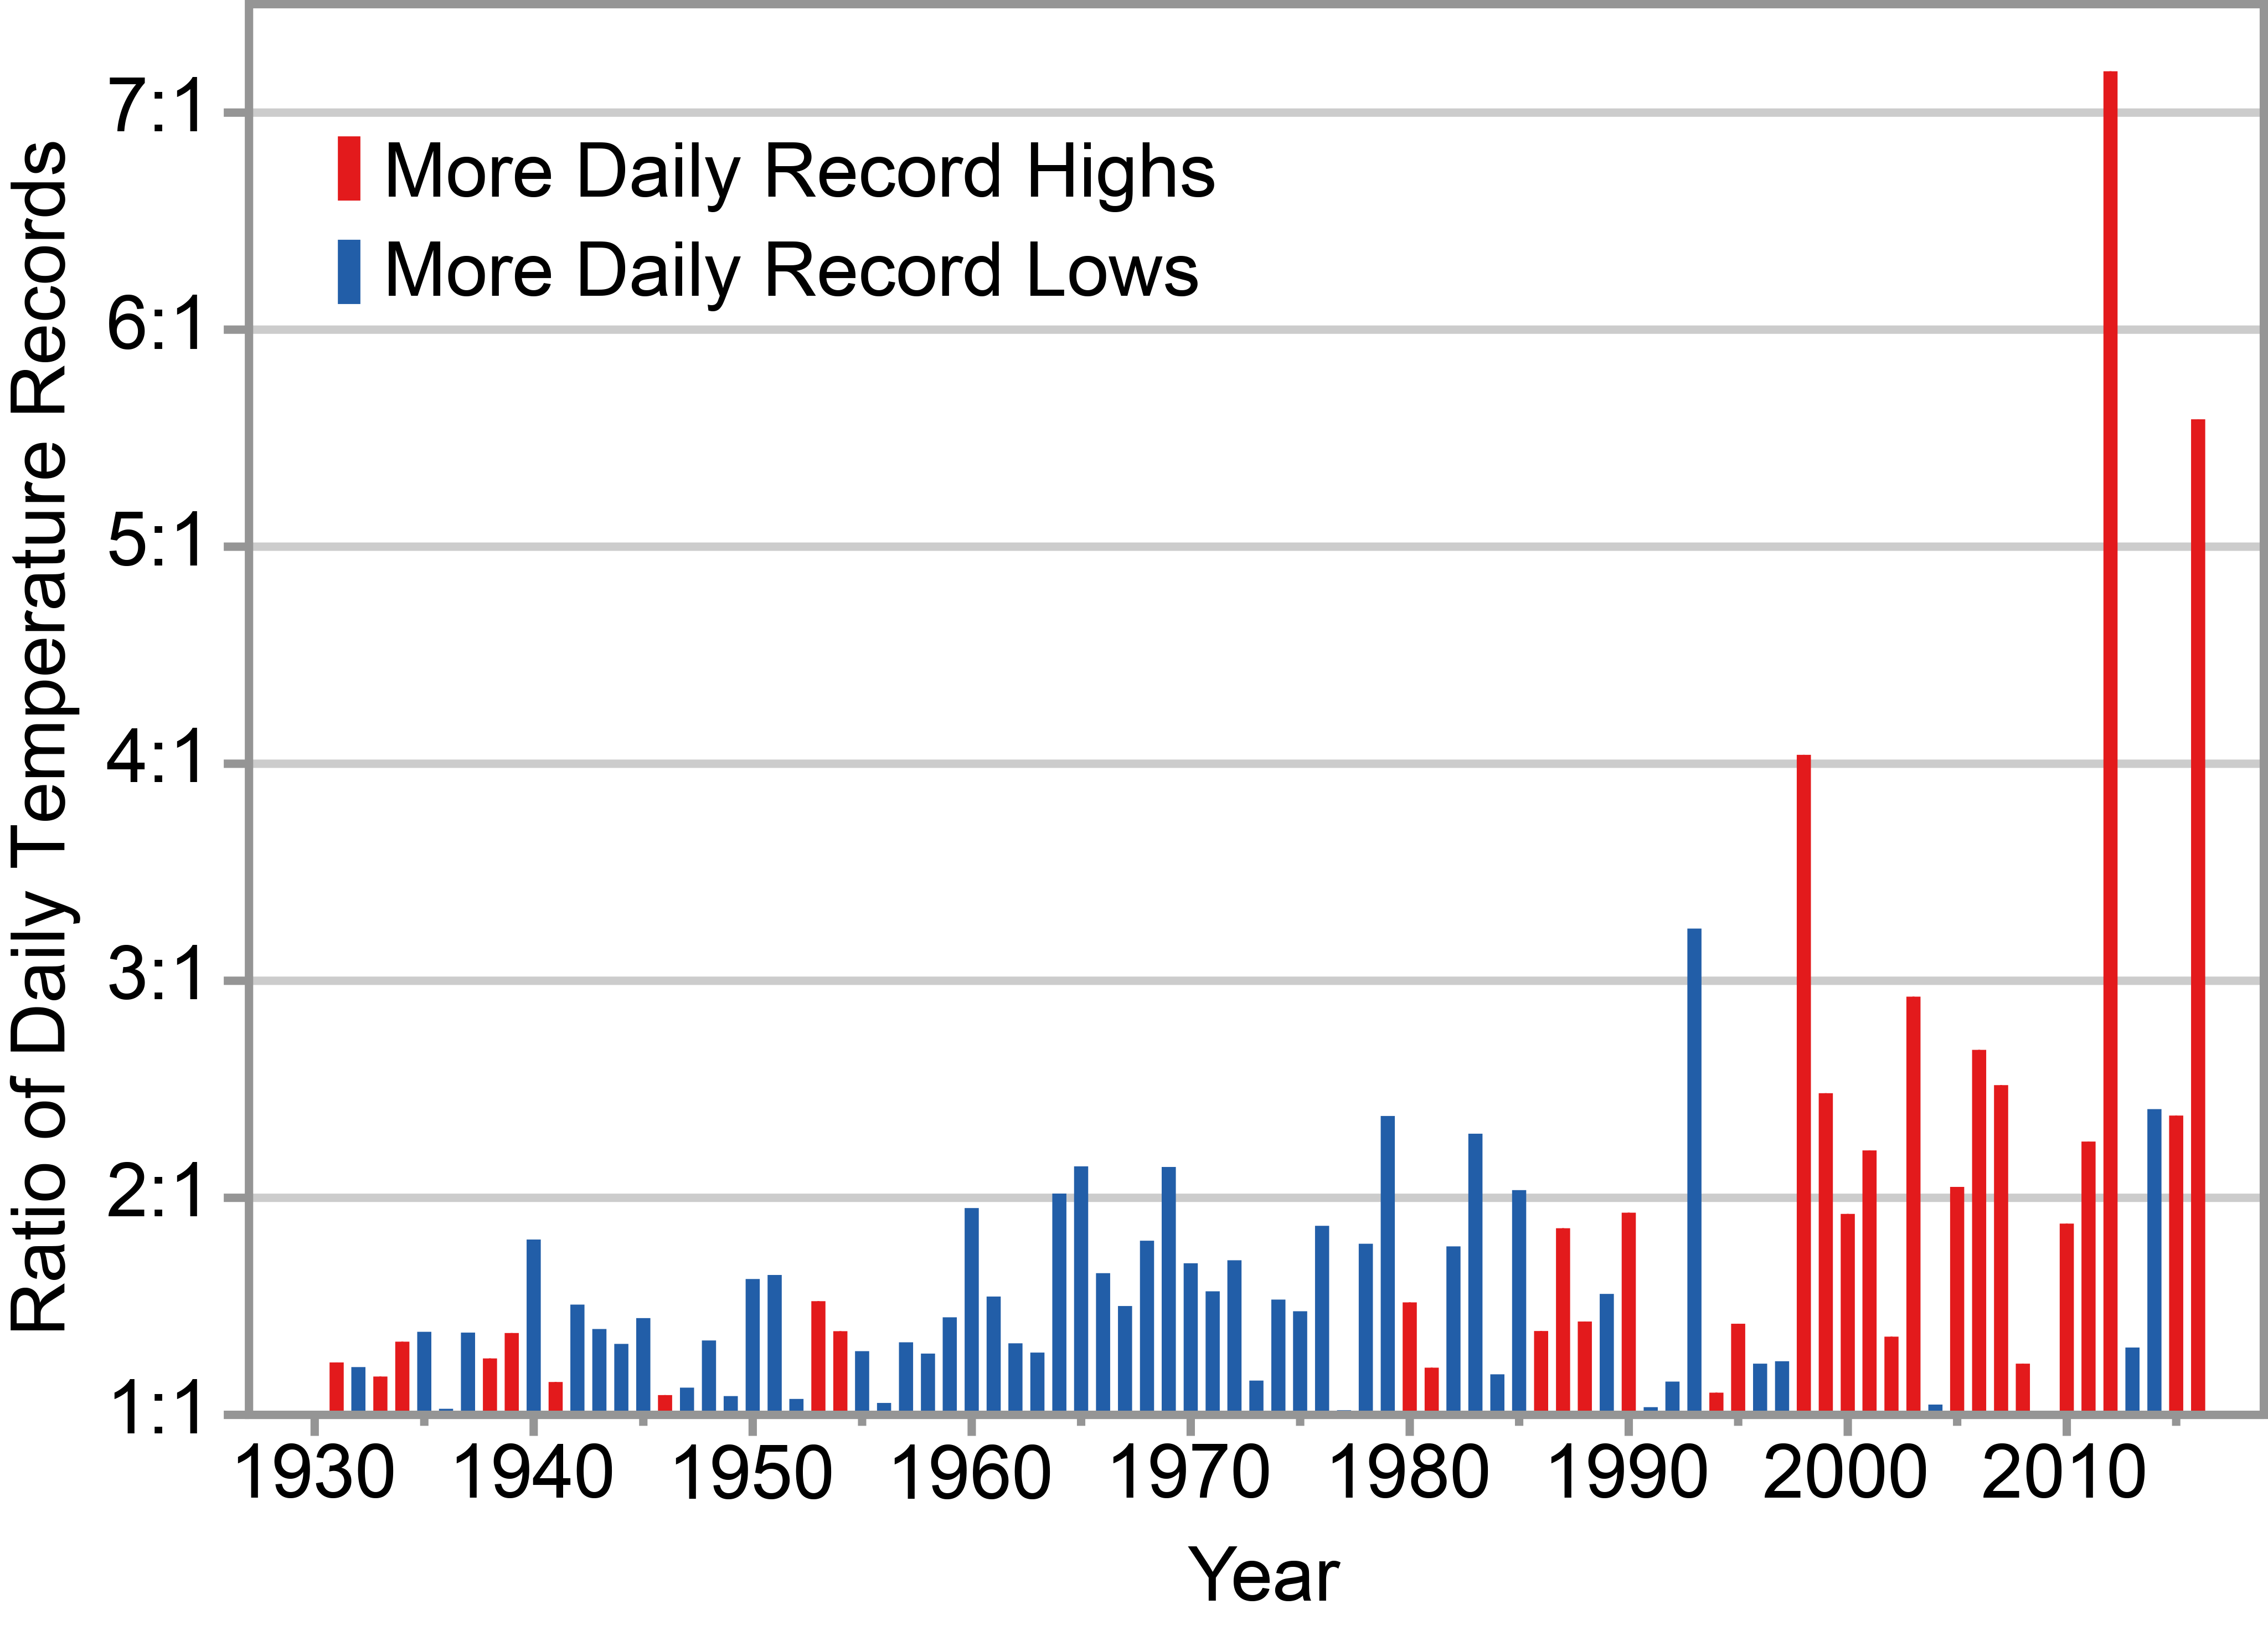
” Very generally, the NUMBER of RECORD LOWS has been DECLINING since the late-1970s while the NUMBER of RECORD HIGHS has been rising. By extension, there has been an INCREASE in the RATIO of the number of RECORD HIGHS to RECORD LOWS (Figure 6.5). Over the past two decades, the average of this RATIO EXCEEDS TWO (meaning that TWICE as many HIGH-TEMPERATURE RECORDS have been SET as LOW-TEMPERATURE RECORDS). The number of new highs has surpassed the number of new lows in 15 of the last 20 years, with 2012 and 2016 being particularly extreme (ratios of seven and five, respectively). (My Caps – IN AN EFFORT FOR THE MEAN OF THE CHART TO BE UNDERSTOOD)
See 1936 …
Same number of heat as cold records
Not this last 20 years.
It works like this …
 ?resize=500%2C279&ssl=1
Is that because it is a Gaping Hole in their general theory?
If temperatures on average are not rising, then find some aspect of temperatures that IS increasing, and blame it on …. temperatures on average that are rising.
Winters in the western and northwestern parts of North America ARE warmer. Why if year-round temperatures aren’t doing much? Same with nighttime temperatures.
This is part of the non-linearity problem I have with the analyses on both sides of the issues. Only by simplifying to the point of destroying internal trends do we end up with a linear trend at all. The pieces make up the whole. A room of basketball players and midgets averages out to have the “average” human height, but tells you nothing about the character of the population in the room. The sub-parts of temperatures, cloud cover etc. are the meat of the climate change arguments.
BTW: This is exactly the problem we have with the Covid19 reaction by the government: talking to the public as if ALL share the risks of separate parts. If those with multiple co-morbidities and over 70 years of age were eliminated from the stats of death and ICU usage, there wouldn’t be much more than a very, very bad flu going on. (In Alberta, Canada, the average age of death is 80, and 85% of deaths have 2 or more co-morbidities.)
Thanks for that explanation. How do scientists that push the alarmist CAGW hysteria sleep at night?
On top of a mattress full of cash in a big mansion full of expensive foods and liquors.
sometimes it feels like the merger of “1984” and “The Twilight Zone.”
“There is nothing wrong with your television. Do not attempt to adjust the picture. We are now controlling the transmission. We control the horizontal and the vertical. We can deluge you with a thousand channels or expand one single image to crystal clarity and beyond. We can shape your vision to anything our imagination can conceive. For the next hour we will control all that you see and hear. You are about to experience the awe and mystery which reaches from the deepest inner mind to the outer limits.”
That said, the Twilight Fringe (i.e. conflation of logical domains) is real, legal, and progressive prices, debt, diversity, confusion, dysfunction, etc. Baby Lives Matter
You forgot the hanger and private jet
Wade,
Nah, that’s only allowable for Green Elites like Tom Steyer, Al Gore and Bill Gates!
The Climate Scaremongers only get the crumbs off the table, but hope for induction into the club if they are particularly adept at selling the narrative and creating extra panic in the flock!
They’re really just useful idiots, but a griffter’s gotta dream!
You don’t know many research scientists, do you?
They don’t get paid a lot!
Yeah but it’s more than a staff at a McDonalds drive thru which is about all most in the field can do with their qualifications.
And Griff you don’t know reality do you?
The chief purveyor of the bad climate change hypothesis is Michael Mann. His net worth is estimated between 1 and 5 million dollars, Even still, despite that wealth no one would marry him.
https://joebidenbio.com/michael-e-mann/
Did you read that site you quoted? So badly written I wouldn’t trust a word it said.
So Simon, You have actual evidence that Mann’s worth doesnt fall in that range?
I would take you seriously if you offered some real evidence instead simply engaging in ad Homs
So Jim did you read the page? It seems to be written by someone whose third language is English. And so what if Mann is worth a few dollars? He could have invested wisely or inherited it from his parents.
I know what scientists get paid here in NZ an it is seriously low given the study they do and knowledge they have. No one goes into science for the money.
Meanwhile you never post any evidence to counter the source you dislike so much, until you do, you are just babbling with nothing….
Simon, Your replies lack any data and your continued use of ad homs only signify a desperate troll trying to sling mud where none is to be found. How much does the troll factory pay you and Griff??
You want data? So do I. Where is an ad hom? Name one…. and preferably more if you consider I use them continually. I think you confuse someone who challenges your ideas as someone who is attacking you personally, by calling you names. Quite different things.
Re payment, that is just another way of brushing off the fact you have been caught out with your reference to Mann’s income. Who is going to pay anyone for writing a few words on WUWT? I think you may be misreading the value of WUWT if you think anyone considers the website worth contributing to for payment. No I write here in the hope the occasional neutral person who stumbles here, will get both sides of the argument, as opposed to the echo chamber that many here would like it to be.
yawn
So that is your reply to my request for ad homs. Sad.
Engaging in ad Homs like “even still … no one would marry him”? I am not sure marital status is any indicator of someone’s scientific ability.
Jim,
From your quality, reliable, reference…
“We don’t have much information about He’s past relationship and any previous engaged. According to our Database, He has no children..”
Yawn
They get paid more than you and me and I’m not so sure about you and your Big Green Checks
Based on the 2018/19 HE Single Pay Spine and the typical 2019/20 university grade system, the average possible salary for university staff in the UK is:
£40,761 for a Lecturer,
£51,590 for a Senior Lecturer,
£64,356 for an Associate Professor
£90,891 for a Professor.
I’d be more than happy with that sort of salary with all the added benefits:
Allowances for travel or relocation,
Discounted or fully waived access to training, university courses and on-site recreational facilities,
Private healthcare,
A Pension.
Free parking
Subsidised canteens
Subsidised bar
Subsidised accommodation for the first few years
etc
I am not sure where you get that list of benefits from but they don’t correspond to any University in the UK that I know about. Can you name a single university where you get free parking? Similarly you don’t get private healthcare in the UK since there is the NHS. And I have never heard of anywhere offering subsidised accommodation for lecturers.
The Antifa Simon act is then followed by Izaak the Idiot.
The crowd ROARS!
Jim
You want (childish) ad homs. Look no further than Carlo Monte.
Simon you can always claim Trump Russia colluuuusion am I right.
You are a clown show
Cranfield University, with the exception of private health care, offers all of the benefits I listed.
Cambridge offers private health care as part of its package.
So now you know.
“research scientist” average salary looks to be around $100k in the US. Maybe not “real” mansion level but certainly getting into McMansion territory.
The average salary for Professor is $167,282 per year in Stanford, CA
https://www.glassdoor.com/Salaries/stanford-professor-salary-SRCH_IL.0,8_IC1147441_KO9,18.htm
That’s so funny. The team here (mostly conservatives who would be on significant annual money) continually push the thieving scientist theme. Rolling in cash stolen from the poor tax payer. I doubt many here would want the salary of a scientist in this field.
What about your George Soros subsidy?
But most are grossly overpaid considering the value of their contributions.
Say griff, in which period would you prefer to live your life?
[__] Benign low CO2 1675-1750
[__] Dangerous CO2 1950-2025
Anyone here remember Shukla? 😉
The question should be ‘Who has the means to corrupt the whole system ? ‘ The Press, Politicians, Science, the Church etc All puppets paid for or/and threatened by an organisation that can print all it needs and is above the law. The wizards behind the curtain.
And a Private Jet in every garage
The media loves a good crisis and gets rich from pushing crises. If you google “Truth About Heat Waves” this article despite having that title does not appear on the first page. The first page is filled with more climate crises type article and ads from the media like the NY TImes and WAPO showing they are the best purveyors of a false crisis
Google Screen shot today at 10 AM
duckduckgo puts this page “at the top of the page. Google starts with heat wave media stories.
They sleep fully convinced that whatever wrongs they may have committed, are completely justified because they are saving the world.
Either from CO2 or from capitalism, for most of them it doesn’t matter which.
The simplest observation casting-doubt on the relationship between global CO2 climate effects and the heatwave is that global temps have not been anomalously high in the months prior to, or during, the heatwave. So, it seems sensible to call it an isolated weather event – it should be needless to point this out. It’s all getting dangerously silly out there in the press. Maybe some people really want to justify their beliefs and feel desperate to find heat – and other, smarter, people are perhaps just plain frauds. http://climatlas.com/temperature/jra55/jra55_globe_t2m_1990_2021.png
Jim Steele,
Thank you for this concisely stated explanation. Specifically in support of your fourth opening point, “how the greenhouse effect varies” I offer these plots for one particular spot on the planet in Central New York where I live. Hourly data from the ERA5 reanalysis product from the ECMWF (European Centre for Medium-Range Weather Forecasts) for all of 2019 is given for total water in the atmosphere and for downwelling longwave radiation. Then the third image is a scatter plot of LW vs TCW for this same data. Gridcells at other locations closer to the equator or the poles exhibit a different shape of the time-series plots, but the point being illustrated is the same all over the planet.
The “greenhouse effect” is a real thing, but it varies rapidly in both directions on very short time scales. Water – mostly vapor, but this data is for total water – drives much of what we experience down here at the surface as weather happens.
I hope that when more folks finally realize the dynamic nature of the atmosphere’s operation, the fear of GHG’s will diminish. Please keep posting, as yours is a voice of reason and sound thinking.
 ?dl=0
?dl=0
 ?dl=0
?dl=0
 ?dl=0
?dl=0
I submitted this article to my local newspaper, the Pacifica Tribune to publish, because heatwaves are a timely issue. The old publisher wanted diverse opinions and published my articles every 2 weeks and still does in his other 4 newspapers. But the new far-left publisher Clay Lambert has refused to publish this despite the fact that everything in this article is truthful climate science regards the dynamics of heat waves.
Because this article disagrees with those who falsely push a climate crisis (and Lambert admits limited scientific understanding,) Clay Lambert still decided to shut down the scientific process that demands critical evaluation of any claim before it is considered good science. It is frightening how the media is increasingly only allowing one perspective and has abandoned investigative journalism
It was not unexpected. Journalism professors are decidedly lopsided in liberal thought. They have to be; freedom to write as you wish and a free press is a classic liberal idea. They pass this notion on to their students. They can’t help it.
But for some unknown reason, in the 21st century, graduates of Journalism programs also believe that any new agenda items adopted by any liberal political party cannot be wrong, so they work to suppress other ideas. They truly believe this constitutes being “Woke” and is “Working for Change”.
Why they think like this beyond me as Journalism 101 says exactly the opposite. Journalism 101 says get both sides of the story and let the readers decide.
As stated when it’s warm it is cooler somewhere else! That won’t support building windmills and shutting down conventional energy.
Have they ever found a dinosaur in a strip of coal being mined?
Dinosaurs? No. They came after the time when coal was being deposited.
Lots of other long extinct animals have been found though.
Great idea. I can sell wind mills to blow the hot air to where it’s cooler because if people believe in global warming they’ll believe in giant oscillating fans too.
“Biden doesn’t know
scienceanything andwouldlook[s] foolishin a climate debate.”Edited for reality.
Beat me to it.
“Biden doesn’t know
scienceanything andwouldlook[s] foolishin a climate debate.”Too funny. Trump…. “The concept of global warming was created by and for the Chinese in order to make US manufacturing non-competitive.”
Antifa Simon could not resist the urge to blame something on President Trump.
Sorry I made your hero Creepy Dementia Joe look bad.
You are such a shill
Mr. Steele,
Thanks for the fascinating post. On your fascinating map, I only see five thermometers in the Arctic where we are constantly told the Earth is warming twice as fast? Could this be true, FIVE?
Wow.
Professor Steele,
Thank you, for another presentation of the facts about climate!
Once again we see that alarmists have to cherrypick, alter or ignore big chunks of the data to support their beliefs; just as they have to throw large chunks of geologic history into a memory hole!
Maybe some day Landscapes and Cycles will be required reading for budding climatologists!
Of course, they’ll have to take remedial classes in Math, Physics and Chemistry to comprehend fully, but that could lead to a welcome outbreak of real science in Climastrology!
all the natural dynamics discussed above…
count for little in the narrative driven media.
The Guardian view on the heat dome: burning through the models
An initial study shows human activity made this heat dome – in which a ridge of high pressure acts as a lid preventing warm air from escaping – at least 150 times more likely. The World Weather Attribution Group of scientists, who use computer climate models to assess global heating trends and extreme weather, have warned that last week exceeded even their worst-case scenarios.
https://www.theguardian.com/commentisfree/2021/jul/08/the-guardian-view-on-the-heat-dome-burning-through-the-models
The Guardian goes on to say
Environmentalists used to shake their heads when highly unusual weather was reported in terms that ignored climate change’s contribution. Now, thanks to attribution science, the link is firmly made.
Really?
‘Unlike every other branch of climate science or science in general, event attribution was actually originally suggested with the courts in mind,’ she said.” (emphasis added)
This stunning admission from [Friederike] Otto undercuts any claim that attribution science should be viewed as a neutral or objective resource by courts of law or policymakers.
https://climatechangedispatch.com/climate-expert-attribution-science-was-designed-to-bolster-climate-lawsuits/
The lies have run around the world, the truth hasn’t even got a shoe on.
Scientists say the recent US-Canada heatwave was ‘virtually impossible’ without warming.
Please explain why that isn’t the case?
Climate change: US-Canada heatwave ‘virtually impossible’ without warming – BBC News
To coin an old goodies joke, 3 out of 4 scientists say that if you don’t buy string an elephant will sit on you. We have to confess it took us ages to find the right 3 scientists.
So the question is do we get to choose the scientists?
To coin an old goodies joke, 3 out of 4 scientists say that if you don’t buy string an elephant will sit on you. We have to confess it took us ages to find the right 3 scientists.
So the question is do we get to choose the scientists and data?
Clearly Griff you really do not know your climate science or perhaps didnt read the evidence supplied here or you just blindly accept any pseudo-science.Your blind belief reminds me of the statisticians warning- Torture the data long enough and it will tell you whatever you want to know”. Sadly there is an endless supply of fools who fail to engage in critical thinking and accept with religious fervor any such crucified/tortured stats that supports their paranoia or political agenda
For your scientific edification consider:
The real question Griff, how can anyone ever take you seriously when you believe that global warming made the heat wave worse when in fact the greenhouse effect was reduced????
Jim,
That argument doesn’t hold water. Just because there is a local change in the concentration of the water vapour doesn’t mean that increased warming hasn’t changed climate patterns to make heat waves more likely. Aristotle over two thousand years ago made a distinction between the material cause and the final cause. Your article discusses the material cause of the heat wave but not the final cause which is concerned with whether or not climate change has made such heat waves more likely.
Izaak, Your reply is just simple minded speculation. By all means, please present your evidence that CO2 is your so-called “final cause” that has altered climate patterns. And instead of simply name dropping Aristotle, you would have a shred more credibility if you discussed the difference between “material and final cause”, and how the critical dynamics the article discusses have been altered by your “final cause”
Finally no matter how patterns ever change, it is the descending air currents within a high pressure system that is the final determinant of a heat wave by reducing the greenhouse effect and increasing solar heating
Your reply is the equivalent of “It must be aliens!” There was a high pressure system in the western Pacific that put a kink in the jet stream leading to the heat dome. The cumulative warming anyone is claiming to date from the mid-19th century is about 1.5°F. The heat records were toppled by 5-10 degree margins. All natural, sunshine.
Virtually? What was the scientific specific % value of their “virtually”?
I was sanding my deck to prepare for oiling with a 2% chance of rain that hour with 0% the following hour, and many hours into the future. Well it rained, and if it had rained for 5 more minutes it would have rained when there was a 0% chance according to the computer models. You know, the models that are the basis of the “climate” models.
2% is “virtually” NO chance of rain.
So provide a link to something scientific that gives a % for this “virtually impossible”.
I will wait patiently while you search.
I notice YOU failed to even try to point out the possible errors in Jim Steeles post, you instead ran to a dumb article that doesn’t come close to making a case since they ignored the weather factors that made this heatwave.
I was right in the middle of hottest area in eastern Washington, experienced two consecutive days of 117F, a 115 and 114F days as well. It was sunny, low winds and clear at night with hot nights because of the weather factors converging to make this heatwave for the history books.
You ignored what Dr. Mass talked about that made this heatwave so unusual, that is why you got suckered for a dishonest and misleading BBC article, which has some obvious LIES in it too.
You didn’t read the respective explaining aricle about, els you woudn’t ask so silly questions
World Weather Attribution (WWA) is an Alarmist thinktank whose sole purpose is to blame mankind for weather. It is literally in the name. So of course they’d say that.
We’re always going to get record highs and record lows when we can measure temperatures every second throughout the day instead of twice a day depending on the person taking the measurement
This post explained the physical dynamics of the recent PNW heat wave. Who you gonna believe, the BBC or your lying eyes.
Seriously griff, the BBC?
No scientist worthy of the name ever said anything like that, and certainly no “climate” scientist. The very nature of weather and “climate” guarantees extremes at either end of the range of temperatures. The reasons behind these variations are complex and vast in number.
You need to try thinking before you post.
Here is what griff’s unnamed climate scientist really said:
So the “virtual” part of the statement is all about what happens from model output.
And as we all know, scientists also tell us that model output are not data and that model output cannot predict.
What is really sad is only a few people bothered to dig through the source, you are one who did thus destroyed Griff’s clueless comment since HE never read it.
Bravo!
What Dr. Otto and others did not realize is that Cliff Mass DID develop a statistical model based strictly on observations of weather patterns over time, and did accurately predict the nature and length of the heat wave based upon those observations, WITHOUT the aid or presence of CO2 as an influence on this weather pattern, as Cliff explained in his blog, which was posted here on Watts Up With That? So there are more reasons why griff’s clueless comments were destroyed, and why Dr. Otto and her ilk are to be excoriated as clueless fools as well.
What about dentists? What do they think about heatwaves?
Scientists “say” but none of them PROVE anything.
You are so gullible, griff.
“The Media is promoting misinformation”. They are, and not just about Climate Change!
The science explained here is very straight forward, somewhat dumbed down for lay people, and totally ignored by the vast bulk of so-called “climate scientist” who know literally nothing of physics, chemistry, thermodynamics, biology, and of course actual climate science.
I actually find that it’s easier to explain all this by referring to Alan Jackson and Jimmy Buffett, and their song “It’s five o’clock somewhere”.
Whenever and wherever some limited portion of the earth is experiencing higher temperature than average, somewhere else, quite often very nearby, is experiencing lower temperature at the very same time. It’s always warmer somewhere, and it’s always colder somewhere.
The energy balance remains the same … but how that thermal energy gets distributed, and concentrated or dispersed, that’s what we call “weather.”
It’s actually very easy to illustrate … all those vewy scawy map graphics showing dark red and even purple areas of high temperatures, as recently experienced in the Pacific northwest … the news media only publish that part of the temperature map. But if one honestly zooms out to cover the entire continental US, it is immediately obvious that the really extreme stuff was limited to only about 1/6 of the land area of the US … and that the other 5/6 was experiencing either average or below average temperatures for the month.
Indeed as published here routinely on WUWT, the world wide temperature anomaly for June was actually 0.01 deg. C lower than the world wide temperature anomaly for May – when we had no such “heat waves” in the US sending warmunistas and media people (but I repeat myself) into paroxisms of warmunist ecstacy as occurred in June.
I post comments regularly on the Washington Post website which is populated mostly by liberal democrats and other assorted warmunistas. Whenever they start their yammering on about how they believe in science and the “climate deniers” reject science, I always give it back to them with actual scientific information, such as the actual global temperature anomaly. I find that when I hit them with actual science, I get virtually no argument or responses back of any kind. They really have no answers to actual science.
I suggest that the truly well informed do as I do – don’t just sit around here at WUWT and collect up votes and cheers from the skeptics’ peanut gallery. Go to places where we DON’T predominate and educate them.
Sure, cynics say that it makes no difference, but at the end of the day, since politics determines policy, if we make no attempt to change minds then the policy is going to go against us.
I comment quite often at The Hill, mostly for the laughs, as I have zero chance of changing any alarmists minds(what little they have),,,
It’s not the warmunists’ minds I try to change – it’s the majority in the middle who are susceptible to logic and reason, but whom mostly read the warmunists’ propaganda. They are the persuadable middle who drive election results and therefore drive policy.
I live in Calgary, Alberta. We “suffered” through the heat wave. In British Columbia, the town of Lytton burned down from a heat-wave amplified forest fire. The word was “climate change” was responsible.
But the “cold wave” that followed? All the rain as well as the sudden dropping temperatures? Didn’t talk about that. Of course, it’s covered in “weather extremes”.
If it don’t fit rising temperature narratives, include it in up-and-down temperature narratives. The alarmists win the MSM coverage either way.
This is always the big problem. For us skeptics, the hypocrisy of the warmist community is clear: “weather is not climate” only applies to those of us who are skeptics. For the warmists, they have carte blanche to use any strictly weather event possible as their evidence of “climate change,” even though there is no evidence either cited or presented (other than cold-blooded speculation) how exactly CO2 either influenced or created the weather pattern in question.
Always a voice of reason and a source of education. I really enjoy reading anything Jim writes.
“… by simply increasing pressure, air temperature will increase without any added energy (aka adiabatic warming).”
Very nice article, but shouldn’t this read “without any added heat”?
My understanding of an adiabatic process is that no energy in the form of heat can be added but that energy in the form of work can be added (e.g. to increase the pressure).
Ric
Here is another truth about heat waves.
Official versions say that national temperatures have increased about 1 deg C over the last century.
It is oftejn assumed that heat waves have been getting hotter too, with that increase underpinning their rise.
But, when you examine the data instead of assuming, you get closer to the truth.
Here is official BOM ACORN_SAT homogenised temperature data from 1910 to 2018 for my home city of Melbourne Australia, sorted into consecutive days of various duration, the hottest each year shown..
http://www.geoffstuff.com/melbhot.jpg
(You might have to click a couple of times, mild possible software trouble.)
You can see that the heat waves of longer duration, 5 and 10 days, do not show any increase in how hot they get, over the last 110 years or so. They are not underpinned by the general alleged rise.
Part of the reason is that Melbourne’s heat waves are created in the centre of Australia, 1,000 miles away, and blown in by occasiuonal strong S-E winds to Melbourne. It gets hotter heat waves than Sydney or Brisbane, roughly 500 and 1000 miles closer to the Equator. They don’t get these S-E winds so much, the centre is more west of them.
Bloggers here should do similar calculations for their locationa globally, so see if this is a general feature.
If it is, it rather changes the official narrative by simple calculations that are hard to argue against. Geoff S
Not to mention that the heatwave in the 30’s was even worse