Reposted from The NoTricksZone
By P Gosselin on 3. July 2021
Little warming to be found globally.
By Kirye
and Pierre
Before we begin, Dr. Roy Spencer just published the Version 6.University of Alabama-Huntsville satellite-based global average lower tropospheric temperature (LT) anomaly for June, 2021 was -0.01 deg. C, down from the May, 2021 value of +0.08 deg. C.

As Dr. Spencer’s chart above shows, temperatures are back within the range seen 20 years ago. The hiatus in global temperature rise appears to have resumed.
June cooling in Tokyo
June mean temperature data for Tokyo are now in at the Japan Meteorological Agency (JMA). June has come in at 22.7°C

Data: JMA.
As the above chart shows, the month of June has been cooling over the past 25 years.
In fact , Tokyo hasn’t seen any warming at all in almost three decades, as the mean annual temperature trend has been downward since 1994, according to the untampered data from the Japan Meteorological Agency (JMA):

Data: JMA.
Next we look at June mean temperatures for the Tokyo Pacific island of Hachijō-jima, located about 287 kilometers south of Tokyo – away from all the urban sprawl and heat island affects:

Source: JMA
There’s been no warming in 85 years! In fact, the trend is downward since 1976.
Looking at mean annual temperatures at Hachijojima, there’s been no warming in 70 years:

Source: JMA
The precursor to global temps is of course the oceans. They are drifting back to the cooler state.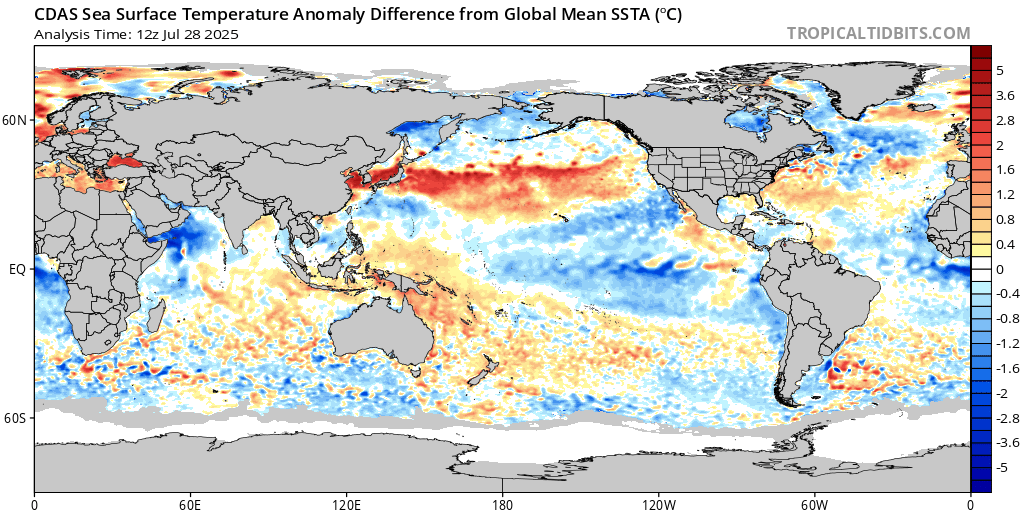
Happy 4th of July to all my American friends.
It seems appropriate that a new all-time cold record for this date would be set in New England, the “Cradle of the American Revolution”. One wonders how much fossil fuel has been burned since 1914, the previous all-time cold date. Climate alarmists alleged that burning fossil fuels drives dangerous global warming, but it’s not doing much warming at all. Climate catastrophe cancelled.
Best regards on the Glorious 4th, Alan MacRae in Calgary
RECORD COLD SWEEPS MASSACHUSETTS, + THE SUN FIRES-OFF ITS FIRST X-FLARE IN 4 YEARS
July 4, 2021 by Cap Allon
Both Boston and Worcester bust low temp records from 1914 (the Centennial Minimum).
I am reposting some of my recent papers today, because our once-free nations are in great peril. We have been conquered from within by our Marxist enemies, and are on the fast-track to Venezuela – poverty and dictatorship.
THE COST TO SOCIETY OF RADICAL ENVIRONMENTALISM
By Allan M.R. MacRae, B.A.Sc., M.Eng., July 4, 2019
https://wattsupwiththat.com/2019/07/04/the-cost-to-society-of-radical-environmentalism/
There is a reason why I published this paper on the 4th of July. Radical greens are the great killers of our age, rivaling Stalin, Hitler and Mao.
WHAT THE GREEN NEW DEAL IS REALLY ABOUT — AND IT’S NOT THE CLIMATE
By Allan M.R. MacRae, B.A.Sc., M.Eng., July 19, 2019
https://wattsupwiththat.com/2019/07/20/what-the-green-new-deal-is-really-about-and-its-not-the-climate/
Alexandria Ocasio-Cortez’s chief of staff, Saikat Chakrabarti, said:
“The interesting thing about the Green New Deal, is it wasn’t originally a climate thing at all… “
“Do you guys think of it as a climate thing? Because we really think of it as a how-do-you-change-the-entire-economy thing,”
THE LIBERALS’ COVERT GREEN PLAN FOR CANADA – POVERTY AND DICTATORSHIP
by Allan M.R. MacRae, B.A.Sc., M.Eng., October 1, 2019
https://wattsupwiththat.com/2019/10/01/the-liberals-covert-green-plan-for-canada-poverty-and-dictatorship/
The government insider outlined Trudeau’s secret plan:
“Unregulated consumerism was unsustainable and people would have to learn to make do with less. The government would have to have more control over people to enforce their austerity and the wealth of developed nations would have to be redistributed to help undeveloped nations.”
The clear intent is to use the global warming smokescreen to restrict economic and political freedoms by transforming Western countries into tightly controlled totalitarian states.
THE REAL CLIMATE CRISIS IS NOT GLOBAL WARMING, IT IS COOLING, AND IT MAY HAVE ALREADY STARTED
By Allan M.R. MacRae and Joseph D’Aleo, October 27, 2019
https://wattsupwiththat.com/2019/10/27/the-real-climate-crisis-is-not-global-warming-it-is-cooling-and-it-may-have-already-started/
Planting was ~one month late across the Great Plains of North America in both 2018 and 2019. In 2018 the growing season was warm and the crop recovered, but in 2019 there was a huge crop failure across the Great Plains; we did not read about that in the mainstream press, did we?
In 2019 fully 30% of the huge USA corn crop was never planted because of wet ground. Much of the grain crop across the Great Plains was not harvested because of early cold and snow in the Fall.
THE CATASTROPHIC ANTHROPOGENIC GLOBAL WARMING (CAGW) AND THE HUMANMADE CLIMATE CHANGE CRISES ARE PROVED FALSE
By Allan M.R. MacRae, B.A.Sc.(Eng.), M.Eng., January 10, 2020
https://thsresearch.files.wordpress.com/2020/01/the-catastrophic-anthropogenic-global-warming-cagw-and-the-humanmade-climate-change-crises-are-proved-false.pdf
“There are numerous highly credible observations that falsify the CAGW hypothesis and many are listed herein, but as Albert Einstein famously stated ‘One would be enough’.“
CLIMATE CHANGE, COVID-19, AND THE GREAT RESET
A Climate, Energy and Covid Primer for Politicians and Media
By Allan M.R. MacRae, Published March 21, 2021, Update 1e published May 8, 2021
https://thsresearch.files.wordpress.com/2021/05/climate-change-covid-19-and-the-great-reset-update-1e-readonly.docx
For many more-recent extreme cold events see Electroverse.net
SUMMARY
We published in 2002 that there was NO catastrophic human-made global warming /climate change crisis, and green energy schemes were NOT green and produced little useful (dispatchable) energy. Dangerous global warming and climate change have NOT HAPPENED and green energy schemes have proved to be COSTLY, UNRELIABLE AND INEFFECTIVE.
Global warming is NOT a threat, but global cooling IS dangerous to humanity and the environment. In 2002 we predicted that natural global cooling would start circa 2020, based on low solar activity, and that prediction is strongly supported by recent evidence.
Politicians foolishly believed scary global warming falsehoods and brewed the perfect storm, crippling our energy systems with costly and unreliable green energy schemes that utterly fail due to intermittency, at a time when we need more cheap, reliable, dispatchable energy due to increased energy demand and imminent global cooling. The people of Australia, Britain, Germany, California, Texas and elsewhere have all suffered due to GREEN ENERGY FAILURES THAT WERE PREDICTABLE AND WERE PREDICTED.
We published in March 2020 that there was no justification for the Covid-19 lockdown, and that it would cause great and needless harm. The Covid-19 lockdown is now estimated to have caused 10-to-100-times the damage of the Covid-19 illness, in terms of increased harm to individuals, families and the economies they depend on.
The same leftist groups concocted and promoted the global warming fraud and the Covid-19 lockdown scam, for political and financial gain. Then these groups linked the two frauds, stating “to solve Covid-19 we have to solve Climate Change” – utterly false and foolish, not even plausible enough to be specious. Then these same groups proposed their Final Solution, the “Great Reset”, a Chinese Communist Party style dictatorship, a centrally-controlled economy where we live like poor slaves, lorded over by our wealthy political masters.
The tragic reality is that the twin frauds of Climate-and-Covid have been accepted by most politicians. Some have covertly or overtly embraced extreme-left politics, and others are so simple-minded and gullible that they believe any falsehood that is repeated often enough. We are governed by scoundrels and imbeciles.
Remember that terrible NW heat wave we had a few days ago? It was +37C here in Calgary. Now temperatures at 2 in the afternoon have dropped 20°C to +17 C. I wonder what happened to all that global warming CO2 that allegedly drove the heat wave. Just more hot air.
Allan,
Keep it coming! I thoroughly enjoy your comments. Reminds me looking out from our cabin in the mountains of CO. Beautiful sunny day except that it was 20 below zero F. All that supposed CO2 did little to mitigate the cold. After years in the mountains and the bloody cold and wind we departed for warmer weather.
Thank you George – enjoy warmer climes.
I’m getting old and hate the cold.
I’ve worked outdoors at minus 40 – the only good thing about minus 40 is the conversion: Minus 40C = minus 40F.
I’ve also spent time in southern Egypt at plus 50C.= plus 122F.
Years ago I lived in a small seaside town where we would sometimes have a really cold winter day followed by heat in the middle of the night because of katabatic winds. In Dublin I have notices how the middle of the day can be really cold and then much warmer in the middle of the night because of the sea. These are simple weather features and nothing to do with global warming.
Hi Michael,
You are fortunate to live i one of the truly civilized countries on our planet.
Thank you for your interesting comments – I have no experience with what you described, but I am sure that others here have.
Regarding ocean temperatures in Dublin: .
https://wattsupwiththat.com/2015/11/25/about-spurious-correlations-and-causation-of-the-co2-increase-2/#comment-1653661
(excerpt)
I suggest the average ocean temperature must be 4C OR COLDER. I recall swimming on a summer Sunday morning at the “Forty Foot” at Dun Laoghaire, near Dublin. I only lasted a few brief minutes. The seawater was so bloody cold that the twins retreated into my body cavity and did not emerge for a week.
Best regards, Allan
My friend Darwin sent me this excellent 5-minute July 4th video from Tony Heller. Tony has documented numerous cases of data tampering by climate propagandists to exaggerate alleged global warming.
I like Tony a lot. One of my favorite stories is when Tony was debating with a warmist
hysteric, and she was losing badly. Finally, in desperation, she accused him of being anti-Semitic. Tony’s response was classic: “Actually, I’m Jewish!”
Enjoy Tony’s video: https://youtu.be/FLiNxtNY1tk
The lying greens are now reduced to claiming that global warming causes cooling. “It’s like, y’know, sort of…”
It even sounds false and stupid when they say it fast. 🙂
CONCORD, NH JUST BUSTED A CENTURY-OLD LOW TEMPERATURE RECORDJuly 6, 2021
Another cold front to forecast to move in Wednesday, one which will sweep the majority of the North American continent, felling hundreds of additional low temp records as it goes.
“Radical greens are the great killers of our age, rivaling Stalin, Hitler and Mao.”
Don’t forget Truman: no one kill so many so fast.
MC: Are you talking about the atomic bombs that ended WW2 in the Pacific?
Recently released WW2 documents estimated that IF the conventional war had continued, the loss of life on all sides in Japan would exceed 4 million people. The death toll at Hiroshima and Nagasaki was about 125 thousand.
I think Harry Truman deserves a break – he stepped into very big shoes on Roosevelt’s death and he filled them well.
It is challenging to make good decisions and do the right thing, especially when the consequences are great, and there is no easy answer.
I have managed several of these in my life – two armed hostage crises on my project in the FSU, where my people were held at gunpoint, and everybody got to go home – even the bad guys. Even though I was pressured to do so, I did not call in the authorities, because they were more dangerous than the crooks. They were known to “go in shooting, and let God sort them out”.
Another is more recent, circa 2015 – the people at the project were afraid of their Chinese gangster bosses and somehow it fell to me to report the enormous threat:
THE MAZEPPA SOUR GAS STORY
I received an award in March 2018 from the Society of Petroleum Engineers (SPE) for averting a potential major sour gas disaster in SE Calgary.
The new foreign owners of the Mazeppa project were producing 40% H2S critical sour gas from ~12 wells within one mile of populous SE Calgary suburbs, and to save money they had ceased the required monthly injection of anti-corrosion chemicals into the pipelines seven months earlier. This was extremely dangerous, because sour gas is highly corrosive to the steel pipelines that carry the gas to the processing plant.
Fortunately, I was familiar with the project from decades ago – I was GM of Engineering for the company that formerly owned this project and about 20 others, and a friend called me with this vital information. The remarkable coincidence is my informant did not know of my history with this project – he just wanted to talk to someone about his corrupt foreign bosses.
The staff at the project were afraid to report the dangerous situation because they feared physical retaliation from the foreign owners, who they believed were violent thugs.
H2S is heavier than air and hugs the ground, and a 0.1% concentration is instantly fatal. I investigated, reported the matter to the Alberta Energy Regulator, followed-up to ensure compliance and the project was shut down and was made safe. I later learned that some of the sour gas pipelines had already experienced minor perforations and leaks.
A safety study done in 2005 estimated the kill radius at 15km, so potential loss of life in a major discharge of H2S in 2016 could have totaled up to 300,000 people, wiping out the SE quadrant of Calgary.
To put this near-miss in perspective, that 300,000 potential fatalities is equivalent to one hundred 9-11’s, six Hiroshima’s, or four Nagasaki’s. Calgary didn’t “dodge a bullet”; we dodged a nuke.
The press reported the problem with some inaccuracies, but were generally adequate. The Alberta Energy Regulator tried to act like they were on top of the situation and aware of the danger, but they were not.
The total reprimand against the foreign owners was the most severe in Alberta history.
– Allan MacRae
____________________________________________
Atomic Salvation: How the A-Bomb Saved the Lives of 32 Million People by Tom Lewis (e-book free download)
The tragic mass suicide of Okinawan civilians could possibly have been repeated on the Japanese Home Islands – had an invasion by conventional allied forces taken place!
[PDF] [EPUB] Atomic Salvation: How the A-Bomb Saved the Lives of 32 Million People Download (booksjar.com)
“A safety study done in 2005 estimated the kill radius at 15km, so potential loss of life in a major discharge of H2S in 2016 could have totaled up to 300,000 people, wiping out the SE quadrant of Calgary.
To put this near-miss in perspective, that 300,000 potential fatalities is equivalent to one hundred 9-11’s, six Hiroshima’s, or four Nagasaki’s. Calgary didn’t “dodge a bullet”; we dodged a nuke.”
Good work, Allan!
When you speak, people ought to pay attention. Thank goodness, the authorities listened to you. There are a lot of people walking around living their lives as normal because of you.
That’s not nearly enough praise.
Thank you Tom Abbott for your kind words.
I continue to take significant steps to protect myself and my family from the Chinese gangsters who owned and operated Mazeppa. I am the only person publicly identified in this matter – the project staff were afraid to report it to the authorities and
my confidential informant was so afraid of retaliation that he has become a hopeless alcoholic. In recent years I have been able to relax my vigilance, but I still take precautions which can be stressful and burdensome.
But there are rewards too – when I see a beautiful family out enjoying life, the reality of their continued existence feels especially good.
Today there is a new challenge: I see our governments injecting our citizens, including kids down to 12 years of age, with experimental vaccines that are far more dangerous for children than the Covid-19 illness, and far less effective for all ages than safe proven treatments like Ivermectin. I see this as “high risk, no reward”, especially for young people, those of child-bearing age or younger.
If I may be permitted a brief egotistical rant:
I did not save all these people, especially the kids, from probable H2S death so that our idiot/corrupt governments could slaughter them with dangerous Covid-19 “vaccines”. The top physicians in the world reject these injections as dangerous and ineffective, near-and-long-term. Some say “a kill shot”.
MY PLEA: DON’T INJECT YOUR KIDS WITH THE TOXIC COVID-19 SHOTS.
Here is my latest correspondence with our idiot/corrupt Alberta government:
Subject: END HARMFUL LOCKDOWNS NOW – 71 – “FOR THREE DEATHS PREVENTED BY VACCINATION WE HAVE TO ACCEPT TWO INFLICTED BY VACCINATION.”
IMPORTANT: I CONTINUE TO FIGHT THE GOVERNMENT-PUSHED COVID INJECTION OF YOUNG PEOPLE – ALL RISK AND NO REWARD.
STUDY CONCLUSION: “FOR THREE DEATHS PREVENTED BY VACCINATION WE HAVE TO ACCEPT TWO INFLICTED BY VACCINATION.”
Are we killing two young people to save three 80-year-olds?
We have long had better solutions than the Covid injections, like Ivermectin.
Our governments have needlessly crippled (and possibly sterilized?) several generations with the toxic Covid-19 injections.
STOP the toxic injections, especially of children and young adults.
THE SAFETY OF COVID-19 VACCINATIONS—WE SHOULD RETHINK THE POLICY
by Harald Walach 1,2,3, Rainer J. Klement 4 and Wouter Aukema 5
1 Poznan University of the Medical Sciences, Pediatric Hospital, 60-572 Poznan, Poland
2 Department of Psychology, University of Witten/Herdecke, 58448 Witten, Germany
3 Change Health Science Institute, 10178 Berlin, Germany
4 Department of Radiation Oncology, Leopoldina Hospital, 97422 Schweinfurt, Germany
5 Independent Data and Pattern Scientist, Brinkenbergweg 1, 7351 BD Hoenderloo, The Netherlands
https://www.mdpi.com/2076-393X/9/7/693/htm
Received: 2 June 2021 / Revised: 19 June 2021 / Accepted: 21 June 2021 / Published: 24 June 2021
Download PDF
Abstract
Background: COVID-19 vaccines have had expedited reviews without sufficient safety data. We wanted to compare risks and benefits. Method: We calculated the number needed to vaccinate (NNTV) from a large Israeli field study to prevent one death. We accessed the Adverse Drug Reactions (ADR) database of the European Medicines Agency and of the Dutch National Register (lareb.nl) to extract the number of cases reporting severe side effects and the number of cases with fatal side effects. Result: The NNTV is between 200–700 to prevent one case of COVID-19 for the mRNA vaccine marketed by Pfizer, while the NNTV to prevent one death is between 9000 and 50,000 (95% confidence interval), with 16,000 as a point estimate. The number of cases experiencing adverse reactions has been reported to be 700 per 100,000 vaccinations. Currently, we see 16 serious side effects per 100,000 vaccinations, and the number of fatal side effects is at 4.11/100,000 vaccinations.
For three deaths prevented by vaccination we have to accept two inflicted by vaccination.
Conclusions: This lack of clear benefit should cause governments to rethink their vaccination policy.
__________________________________
19 WORLD DOCTORS WARN: DO NOT TAKE COVID-19 SHOTS
Published March 18, 2021
Video: https://rumble.com/veseil-world-doctors-warn-do-not-take-mrna-shot.html
For more details on the Scamdemic go to nojabforme.info and cosmicfact.com
IN SUMMARY, THESE DOCTORS STATE:
The Covid-19 was a fake pandemic – there was no dangerous Covid-19 emergency.
Total deaths in many countries are not different from previous years.
The PCR tests have been misused. As result, Covid-19 cases have been greatly exaggerated.
The Covid-19 lockdown and related distancing etc were NOT necessary.
The harm done by the lockdowns etc have caused much more harm than the Covid-19 illness.
There are effective conventional treatments for Covid-19.
The Covid-19 “vaccines” are experimental and are not proven safe or effective and might be very dangerous – NOT justified.
The principle of “informed consent” was not applied – people who were injected were not properly informed of risks.
These Covid-19 injections can cause a range of severe reactions, including the inability to bear healthy children – potentially disastrous.
These doctors will NOT take the Covid-19 injections and will NOT recommend them to their patents.
I published most of these conclusions long ago, some as early as 21March2020.
In my recent paper, I noted that there is no “death bump” to mid-2020 in either Alberta or Canada (or the USA) – that is, no significant increase in total deaths from all causes over the trend of the previous seven years.
That means there was no significant deadly Covid-19 “epidemic” in Alberta or Canada or the USA to mid-2020, and no justification for the panic, the lockdowns of the workforce and students, and the destruction of our economy – just as I correctly published more than one year ago, on 21&22 March 2020:
21March2020 – Allan MacRae
LET’S CONSIDER AN ALTERNATIVE APPROACH: Isolate people over sixty-five and those with poor immune systems and return to business-as-usual for people under sixty-five. This will allow “herd immunity” to develop much sooner and older people will thus be more protected AND THE ECONOMY WON’T CRASH.
22March2020 – Allan MacRae
This full-lockdown scenario is especially hurting service sector businesses and their minimum-wage employees – young people are telling me they are “financially under the bus”. The young are being destroyed to protect us over-65’s. A far better solution is to get them back to work and let us oldies keep our distance, and get “herd immunity” established ASAP – in months not years. Then we will all be safe again.…
This was not a difficult judgment call, once the quality data was located.
All we really needed to do was over-protect the very elderly and infirm – the high-risk population – which we failed to adequately do. What a debacle!
The evidence of serious criminal activity is overwhelming.
MOST IMPORTANT: Do NOT inject your children or grandchildren.
Regards, Allan MacRae
THE TRUTH ABOUT MRNA VACCINES – FROM THE INVENTOR
Who would know more about mRNA technology than its true inventor? Get the straight, uncensored facts – the four groups who shouldn’t get the jabs, the health risks and why you’re not being warned about them, the real vaccine death rate and much more.
READ MORE
STORY AT-A-GLANCE
June 11, 2021, the inventor of the mRNA vaccine technology, Dr. Robert Malone, spoke out on the DarkHorse podcast about the potential dangers of COVID-19 gene therapy injections. The podcast was quickly erased from YouTube
Malone is concerned about government not being transparent about risks, and that people are being coerced into taking these experimental injections, which violates bioethics laws
He believes the risks outweigh the benefits in children, teens and young adults, and that those who have recovered from natural SARS-CoV-2 infection should not get the injection
Five days after his DarkHorse podcast appearance, Malone’s scientific accomplishments and contributions were scrubbed from Wikipedia
As recently as June 14, 2021, Malone’s contributions were extensively included in the historical section on RNA vaccines’ Wikipedia page. June 16, his name was removed and his accomplishments attributed to nameless researchers at the Salk Institute, the University of California, and the University of Wisconsin.
__________________________________________________
The National Vaccine Information Center (NVIC) recently posted more than 50 video presentations from the pay-for-view Fifth International Public Conference on Vaccination held online October 16 to 18, 2020, and made them available to everyone for free.
The conference’s theme was “Protecting Health and Autonomy in the 21st Century” and it featured physicians, scientists and other health professionals, human rights activists, faith community leaders, constitutional and civil rights attorneys, authors and parents of vaccine injured children talking about vaccine science, policy, law and ethics and infectious diseases, including coronavirus and COVID-19 vaccines.
In December 2020, a U.K. company published false and misleading information about NVIC and its conference, which prompted NVIC to open up the whole conference for free viewing. The conference has everything you need to educate yourself and protect your personal freedoms and liberties with respect to your health.
https://www.protectinghealthandautonomyinthe21stcentury.com/conference-live
Regarding the adverse events from any Covid-19 shot.
There are two different types of trials that can be run:
a treatment trial and a prevention trial.
In a treatment trial, you take people with some problem, define a measure of reduction or resolution of the problem, and measure the degree that the intervention leads to the desired outcome.
For example, you take people with headache, give half some investigational treatment, say acupuncture, a new drug, massage, whatever. And you measure and determine the portion who have pain level go down to some acceptable level noted as “treatment success.” At some pre-designated time point: an hour, a day, a week, whatever. But you need a time-point finish line.
Some headaches resolve with time. So, you include a “control” group, maybe taking placebo.
If 50% of the treatment group hit this mark at the finish line time point, that is the “cure” rate. If only 25% of the placebo group hit that mark, then you have evidence that the investigational treatment might actually be effective.
It almost goes without saying that you MUST assess ALL, or nearly all, study participants at the finish line.
A prevention study design is different. You take a group of people who are at risk for some outcome, you provide some investigational treatment, whether a drug, massage, whatever, and you monitor them for that outcome across a pre-determined time period.
Your outcome is: the portion WITH the bad outcome to be prevented. Not the portion cured. The portion affected. The incidence.
Again, a control group can be used to help determine the increment in reduced incidence that might be attributed to the intervention versus other influences.
As with a treatment study design, in this prevention design, you MUST gather the outcome at the time point noted for ALL or MOST participants.
If you do not, the logic of the trial does not apply.
Prevention studies are more challenging. You need a bigger group in the treatment and control group because you are looking for incidence, a modest portion of the entire group being affected.
Also, you need a time line long enough to allow the manifestation of the problem being prevented.
Also, the outcome to be prevented may be multiple – the risk factor can lead to more than one bad outcome.
So, with the Covid-19 shot. If it affects the circulatory system, it might harm heart, but may harm other parts of the body.
So, these three aspects make a prevention trial more challenging to properly carry out than a treatment trial: bigger group needed, greater time line needed, and more outcomes to be measured.
And, it still applies that you need to measure outcomes in all or nearly all participants.
Here is my point:
Evaluating the possible harms – inflamed pericardium, etc. – from Covid-19 shot is a “prevention” study design.
We have a group at risk for the outcome: those exposed to the shot. We should have a control group: those not exposed to the shot.
We are looking for incidence of the undesired outcomes – inflamed pericardium, etc. – across time.
Here is my follow-up point:
Our VAERS system is a VERY poor research design for assessing the incidence of adverse events from the shot.
There is no uniform data gathering. It cannot possibly be anywhere close to adequate.
I believe we have noted a signal of harm in young people because there is almost no other explanation for the heart symptoms. We may be having the SAME hamr from covid shot in older adults, but this may be getting dismissed as non shot-related.
My parents were eager to get the covid shot as soon as possible. They did. A few months ago. Just a couple weeks ago, my mother tells me she went to the doc for symptoms, and heard it was atrial fibrillation. A new diagnosis for her. She reflects that she has had the symptoms for a while. I suggest she is yet another victim of side effects of the shot. She immiediately shuts up about her symptoms since she is pro-“science” and is not racist KKK Q-Anon.
She has had a heart attack, so everyone attributes the symptoms to just her overall heart problems. No VAERS report.
I also hear that my father had left shoulder pains, and other pains, and so went to hospital fearing a heart attack. They conclude: no heart attack.
He has had hip pain attributed to arthritis. So, they have no diagnosis but shrug off the pain as now affecting his shoulder.
I note that this could be symptoms of the shot. This suggestion is shrugged off. He is not Q-Anon KKK White Nationalist.
So, no report to VAERS.
Truly this is tough to figure out. But there should be cohorts of people in their 70s, and 80s, being assessed for symptoms across time. With some in the “shot” group and some in the “control” / “comparison” group.
We need proper research design to assess possible adverse events of the shot in older adults.
Otherwise, we just do not know.
And now there are anecdotal reports of upwards of 80+% of pregnant women injected having miscarriages.
I remarked during the very long and uncertain development period prior to the 5last el Niño that the fundamental mechanics of ENSO was changing. Instead of the dominance of upwelling in the eastern Pacific in the formation of La Niña, large flows of cold water enter the ENSO region slanting equatorward from the N and S temperate zones, greatly diluting and interrupting
the regular pattern.
This ‘breakdown’ arises from the broad abunñdance of cold water over the the Pacific. Note in your graphic, an el Niño “developing” in the eastern Pacific, but being completely overwhelmed by the invading swathes of temperate cold water. Note also that the invading cold water has ‘washed out’ and displaced the Western Warmpool.
It would be good to hear Javier on this phenomenon.
This looks like the way global temperatures slip into a cooling period rather than “stepping down” following regular la Niñas (analogous to temperatures stepping up after el Niños).
I hate to say so ,a comment to the ignorant
HISTORY IS REPEATING ITSELF
Feels like the 1930’s.
“It’s déjà-vu all over again”
– Yogi Berra, leading American philosopher and catcher
Please explain why this graphic showing SST anaomolies is so different to NOAA
Please explain why this image from CDAS is so different to that of NOAA shown in the link above.
Different mean value perhaps?
Problem is the media and the alarmists don’t read the facts and their drumbeat continues to go on.
They will continue to go on unless something is presented differently. At least it would be a start.
I know you can do it.
You now have the temperature anomalies graphic presentation from Spencer.
Add to this Spencer graphic presentation the Mauna Loa CO2 data available at this site:
https://gml.noaa.gov/ccgg/trends/
This will show that there is no more correlation between these two variables, although there was some previously.
The claim is always CO2 is responsible for the increase in temperature. Then plot both variables on the same graph. Why this is NEVER done by Spencer?
This was done before here: https://www.climate4you.com/ using HadCRUT4 Global temperature anomaly but stopped in March 2021 waiting for update to HadCRUT5.
If there is a correlation between these two variables, let us have a graphic presentation showing both.
Tony Heller has been keeping tracking of that. He has noted in the past, that the adjustments being made correlate with the CO2 curve. Which means they get hammered down in the past and hammered up in the present. According to Heller, this is now changing:
https://youtu.be/vnmzOeG_N64?t=76
I am not sure by what he means by “data tampering”, so I assume he means adjustments. The video is too short and not detailed enough, so all I can say is that he has detected some kind of deviation from what has been going on in the past. And something like this is probably to be expected, if you were piggy backing on a natural short term temperature increase that has suddenly gone cold (eg, Monkton’s 6y10m pause).
Hopefully Tony expounds upon this with more detail in the future.
For what it is worth…
Thank you. Yes I am aware of Tony Heller site you mentioned and like you I don’t know that this demonstrates anything.
If you go to this site: https://www.climate4you.com/
and look at the items listed in the gray area under “Key updates” at the bottom of the list you will see “Temperature and CO2”. Click on it. A graph will open showing both temperature anomalies and CO2 measured at Mona Loa since 1958.
The graph shows:
1960-1978: as CO2 increased, a slight decrease in temperature anomalies
1978-2005: as CO2 increased, a definite increase in temperature anomalies
2005-2021: as CO2 increased, a definite no correlation with temperature anomalies. Simply we can see the effect of El Nino. As well as previous effects of such on this graph. No?
Now this graph used HadCRUT4 for temperature anomaly and this stops in March 2021. Updating to HadCRUT5 is apparently forthcoming. Maybe!
Why wait for this. We have Spencer anomaly data up to June 2021. We have Mauna Loa CO2 data up to June 2021. Why not plot both on a graph?
Indeed, if increase in CO2 always produce an increase in temperature we should see it easily. No need for Monkton pause!
I did find a graph plotting both temperature and CO2!
Great, here it is:
https://www.climatexam.com/single-post/global-temperature-of-april-2021-dropped-below-the-pause-level-of-the-early-2000s
I looked at that link and the pictures were all blurred, for some reason.
I agree, Roy ought to overlay the CO2 chart against his UAH chart.
The alarmists are now desperately praying for another strong El Nino,..
.. since they are the source of all warming in the satellite temperature data
There is a fundamental problem with this approach. And, with the CO2 – planet temps hypothesis overall. It is this:
To detect covariance, we need BOTH measures to co-vary.
The hypothesis is: as CO2 goes up, planet temps go up, AND
as CO2 goes down, planet temps might go down.
This is all fine to ponder. But we have monotonic data in CO2; it never varies, therefore we can never examine whether ANYTHING covaries with it. CO2 is invariable. No covariance analysis can be done with CO2.
As long as planet temps are generally trending upward, it can always be claimed that CO2 is driving temps.
And we are in a phase of long-term climbing temps, and long-term climbing CO2, coming out of Little Ice Age. CO2 happens to have a pretty smooth line, and planet temps happen to be more jagged, to actually provide the ups and downs for plausibly examining some cause-effect covariance relations.
https://wattsupwiththat.com/2021/06/07/carbon-cycle/#comment-3264363
[excerpt]
Atmospheric CO2 changes lag temperature changes at all measured time scales. (MacRae, 2008). Humlum et al (2013) confirmed this conclusion.
Kuo et al (1990) and Keeling (1995) made similar observations in the journal Nature, but have been studiously ignored.
IF CO2 is a significant driver of global temperature, CO2 changes would lead temperature changes but they do NOT – CO2 changes lag temperature changes.
Think about that: Kuo was correct in 1990, and for 31 years climate science has ignored that conclusion and has been going backwards!
Climate Sensitivity (CS) to CO2 is a fiction – so small, if it even exists, it is
practically irrelevant.
“The future cannot cause the past.” Here is the proof, from my 2008 paper:
https://www.woodfortrees.org/plot/esrl-co2/from:1979/mean:12/derivative/plot/uah6/from:1979/scale:0.18/offset:0.17
In the modern data record, the lag of atmospheric CO2 changes after atmospheric
temperature changes is ~9 months. This is an absolute disproof of the CAGW
hypothesis, which states that increasing CO2 drives temperature. “The future
cannot cause the past.”
In my 2019 paper below, I explained why the lag is ~9 months – it is basic calculus, the 90 degree (1/4 cycle) lag of the derivative and its integral, which is the ~3
year ENSO period.
My 2008 paper remains very important. My 2008 conclusion was confirmed and expanded by Humlum et al in 2013, for which I am grateful.
All warmists and most skeptics argue about the magnitude of climate sensitivity to
increasing CO2, and whether the resulting CO2-driven global warming will be hot
and dangerous or warm and beneficial. Both groups are probably wrong.
There is a high probability that the mainstream climate debate about the magnitude of CS is wrong – a waste of decades of vital time, tens of trillions of dollars of
green energy nonsense and millions of lives. Vital energy systems have been
compromised, damaged with intermittent, unreliable wind and solar generation –
a debacle.
It is important to note that Global Cooling is happening now, even as CO2 concentration increases – another disproof of the global warming fraud.
Cheap abundant reliable energy is the lifeblood of humanity – it IS that simple. The
green sabotage of our vital energy systems, whether innocent or deliberate, has
cost lives and could cost very many more.
You can add Figure 2 from this site displaying both CO2 and temperature from 2000 until now showing no correlation between the two.
https://www.climatexam.com/single-post/global-temperature-of-april-2021-dropped-below-the-pause-level-of-the-early-2000s
I commented above that this page showed blurry pictures, but I guess I didn’t wait long enough for the whole page to load because when I tried it again, after waiting about a minute, the webpage finally rendered a visible picture.
It doesn’t look like CO2 and temperatures are following the same pattern. One is going higher while the other is going lower.
I don’t wish a ice age on the world but if the temperatures peaked last decade and are on their way down as part of a natural cycle I can’t wait to see the response of the MSM and warmest. Will they become the deniers.
They already are deniers.
MSM will ignore this because they can’t convert C to F.
In the UK the Fahrenheit measure of temperature has been out of use for 50 years or so – it hasn’t been taught in schools since the 1960’s. However whenever there is a “warm” event the media wheel it out because a headline of “sizzling summer over 100 degrees” is so much sexier than talking of 38 degrees. Conversely, in winter they never use fahrenheit to describe cold weather -again “Twenty below freezing” is a better headline than “four below freezing”
The MSM have no interest in delivering factual reporting – it’s all about spin and sensationalism these days.
“In the UK the Fahrenheit measure of temperature has been out of use for 50 years or so – it hasn’t been taught in schools since the 1960’s. However whenever there is a “warm” event the media wheel it out because a headline of “sizzling summer over 100 degrees” is so much sexier than talking of 38 degrees.”
That’s interesting. Those climate change propagandists work very hard at their job of scaring the public.
Not true, they get -40 right every time (by accident).
Where’s Griff?
Griff, before you comment, please answer the question:
Would you prefer living in 1700 to 1775 when CO2 was so benign, or this terrible time of “dangerous” CO2, 1950-2025?
I understand that some paid responders – likely like the one you mentioned – get paid more by having replies and other feedback. I think that sticking to the topic and not replying directly is the best course.
Still, it is good to know that Griffy is the only one of the paid shill’s that works the weekend, all the others seem to be Monday to Friday only – perhaps they do it out of an office?
Is it true that some folk are paid for responding on here?
[No, why would you think that? . . . mod]
Because of the comments above.
You certainly might be, the $$$ supporting the Dark Side are vast
Well, there you have it, Sara admits that she (if I may be so bold) doesn’t get paid nothing for commenting here . . (and note the absence of any snark tag ; )
Listen, Sport, I don’t get paid NUFFIN’ for responding here. I just have a good time posting snarky stuff. Got that, tinny?
Would you tell us the something that yo do get paid?
Well, let’s see: posting articles on a vets’ blog: Nope, no $$$ there.
Posting comments here and there on other blogs: Nopey, no $$$.
The “something that I do get paid”? Well, gee whiz, I get retirement income and occasionally, since I spend a lot of time in the forest preserve, I manage to find something worth writing about and get paid for that, too.
It’s good to be The Queen.
Apologies Tinny. It gets a bit flippin’ wearing to have to put a sarc tag on every single funny comment just in case someone doesn’t get the joke.
Yes, people should assume they are seeing sarcasm. There’s a lot of it here, and with good reason.
You might be
Reportedly, a marketing firm would be hired to provide staff to disrupt conversations and provide talking points contrary to the information given on a site.
Such marketing firms have services to provide positive or negative reviews on products, services, political viewpoints, etc.
I do not know that this is occuring here, just employing a WAG.
Well, if the trolls here are getting paid, their paymasters are not getting their money’s worth.
Certainly no-one in their right mind would pay griff to comment.
He makes a total mockery of the AGW meme. !
False flag? griff is paid by “big oil” perhaps?
Could you give me an idea about how to get paid for posting here. I post far more than Griff, and could do with the money.
A comedian has to earn his money.. You don’t even get to the griff level.
Usually a bellhop gets paid in tips I thought
Yeah and you are just as clueless
Couldn’t tell you bellhop. I’m still waiting for my check from Big Oil that all us skeptics are supposedly getting.
I actually get paid well by big oil, but it has nothing to with anything we’re talking about here. I’m a senior IT guy for a super major, supporting very large, distributed systems. Of course I could be doing the same job in just about any industry, so there’s that. But I, for one, am rewarded nicely by big oil, thank you very much.
If there is some group paying grifter, LoyD’oh, bigoilyboob, and the other Alarmists that post here they have to be idiots. All of these Alarmists’ (mostly dishonest) posts are met with clearly written, fact-based, refutations and thus they aren’t likely to be winning over anyone who might be on the fence.
meab,
Love the LoyD’oh spelling; it brings a vivid picture of Homer to mind!
Just wanted to remind you that the griffter spells his name with two F’s! I’m not sure if that is related his usual report cards or if it’s an abbreviation of a word expressed to him frequently!
Simple Simon and Izzy are going to be crushed that they didn’t make your cut, meab. .
Can’t speak for anyone else but I’d far sooner be living in the current day than the 18th century. For lots of reasons, modern medicines, anesthetics etc , less slavery, slightly more democracy, better human rights and many other reasons. Can’t say what it will be like by 2025 though.
I think that in 2025 baldness will be a pandemic.
Caused by billions of people furiously scratching their heads and asking themselves and each other –
“why did we have to trash our reliable base load electricity supplies, when the weather just keeps on doing what it’s always done?”
Mr.,
Just wait until the public finds out that there was never any reason for the lockdowns!
Baldness might be the least of worries for some people that reveled in the destruction of lives and businesses!
They will slink off into the darkness, and if asked, will de-Nye having been converts to the religion.
And all of that because of the advent of the use of coal. !
We sure have had a lot of weird weather lately (which is normal). I go to the UAH site every month to see how the “weather” fits into the long term satellite trend.
However, I almost never see any articles or references to the USCRN. Anyone have any good graphs on how the ground temperatures are looking when the UHI effect is removed?
USCRN’s data plotting is here:
https://www.ncdc.noaa.gov/temp-and-precip/national-temperature-index/time-series?datasets%5B%5D=uscrn¶meter=anom-tavg&time_scale=p12&begyear=2004&endyear=2021&month=12
I’ll bet NOAA regrets ever establishing that measurement system; its results are not consistent with the narrative.
Yes, thank you for the data plotting. However, this is NOT the issue.
The issue is CO2 is BAD. It increases the temperature. We need to get rid of it as fast as possible.
This is the issue.
Can you find a plot published by NOAA showing both on the same graph: the temperature or the temperature anomalies and the CO2 concentration in air from Mauna Loa since 1958? They will not publish this. Why not? There is NO continuous positive correlation between the two during this fairly long period when we have very reliable data for CO2.
Plotting both on the same graph would immediately demolish that CO2 is responsible. No need for statistical analysis. We have a pair of eyes and a brain which would immediately tell us: there is NO such continuously positive correlation between the two.
So yes, NOAA will continue ABSOLUTE avoidance of plotting and showing these two variables on the same graph. But they will continue to claim that we must remove CO2!
I finally did find a graph plotting CO2 and temperature.
See Figure 2 on the site below.
The idea that NOAA or any government agency would should these data? Never.
https://www.climatexam.com/single-post/global-temperature-of-april-2021-dropped-below-the-pause-level-of-the-early-2000s
Thanks for that link, DM!
One heavily adjusted proxy measurement of the troposphere allegedly shows a pause in warming… humbug!
Why, what a hypocrite, Griffy! A few articles previously you cited a single localised heatwave as proof of worldwide global warming to support your argument so humbug to you. You keep posting your delusional ramblings and refuse to admit that you have mental health issues – I do wish you’d see a health professional about these, I really do – it’s getting almost as embarrassing as watching Biden’s mental health problems now.
Please, don’t feed the troll.
Richard, you are wasting time in pointing out grief’s self-contradictory statements.. he thinks irony means “quite like iron”..
I enjoy Griff’s absurdities and the comments addressing them.
griff, You seem to have missed BobM’s question.
Would you prefer living in 1700 to 1775 when CO2 was so benign, or this terrible time of “dangerous” CO2, 1950-2025?
Expecting an answer from Griff that illustrates how insane his positions are is like expecting Biden to answer questions like, ‘How is allowing unfettered illegal immigration across our Southern border in the best interest of the country?”.
The motivation to deny is the same. They already know how wrong they are, but can’t admit it because it undermines their politics. If he doesn’t blindly accept the big climate change lie and the rest of the insane positions taken by the left, his comrades will cancel him.
Maybe instead of ignoring the question, griff will try the Kamala Cackle
It’s more like the Biden Shuffle as he leaves the podium once the questions get real and/or he has no prepared answer on his flash cards.
This is our leader. Our enemies love our situation.
Yesterday in the park I saw many illegal barbecues, cooking MEAT, congregating with friends and family inside the 6-foot circles, and nary a single MASK in sight.
Please don’t tell Joe.
Wrong. The two things weren’t connected. Nice try though.
A warmunist whining about adjustments. That would be funny, if it weren’t so stupid.
What’s the basis of your claim that this is a “heavily adjusted proxy measurement” griff?
Just wildly making stuff up again?
What adjusted proxy data ?
I see measurements in Japan, and the UAH sat data seem not to be Manns faked treering proxy data.
Ha, and you didn’t even bother to look at the Japanese data? I mean after all, global warming is supposed to be global and yet a relatively small Japanese island, well away from the Japanese main islands, shows cooling over an extended period of 70 years.
“One heavily adjusted proxy measurement of the troposphere allegedly shows a pause in warming… humbug!”
It looks like ole Griff is a denier!
That’s got to be a new all-time record — of dislikes. Congrat’s, grifter.
Sorry, but these are fluctuations within the steady positive trend.
The warming continues.
To claim “hiatus”, we need another 0.5 C down.
Alex,
By your logic why are these not just fluctuations in the millions of years trend toward ever-colder climate?
Wrong. That isn’t how it works. The current hiatus is still quite young, although it continues to grow longer, not unlike the Climate Liar’s noses.
Alex,
The alleged warming that weak minded snow flakes are so concerned about is also well within statistical significance of conforming to the null hypothesis that says climate change is natural and there isn’t any significant consequence from CO2 emissions, so what’s your point?
Use of the term hiatus reflects a bias that assumes an observed steady positive trend will continue forever. Maybe what we’re seeing is in fact not a hiatus at all, but a definite transition from a sustained period of warming to a sustained period of cooling. Time will tell, and fwiw, the scientific majority has almost always gotten it wrong. That in itself is evidence if you know how to read epistemic flux lines.
I would presume it is reasonable to assume that we won’t see that transition until the AMO goes negative. I would hate to think what we are in for if sustained cooling actually begins before the AMO switches. And yes, Mann is a serial liar and will be proven once again to be totally incompetent as a “scientist” when that transition comes.
Yes, we should be very afraid of global cooling.
That’s not an invitation for climate scientists to try to fix the cold if it happens. They won’t do any better at that than they have done trying to equate CO2 with temperatures.
It won’t take much global cooling to have a very serious effect on humanity. All it takes is later freezes in the spring, and earlier freezes in the fall, to seriously hamper food production.
It had been warming for about 300 years. Over that period, we had a nice uptick in the early 20th Century, countered by downtrends both before and after. Those facts drive a stake through the heart of the blood-sucking CAGW.
I think so, too.
And the world has been cooling for over 4 thousand years, interspersed with brief warm spells. I want to keep this relatively warm period going as long as possible.
So until we get back to the lows of the Little Ice Age, we can’t claim a “hiatus”?
Please read up on time series analysis. Trends are not necessarily the best determination of what and why things are changing. Additionally, regression analysis of periodic functions are not always the most accurate. Phase and amplitude changes of various components can lead one astray.
“Sorry, but these are fluctuations within the steady positive trend.
The warming continues.”
Yes Alex, in science that’s called the baseline.
No, another .5 C up would be better. Warmer is better, don’t cha’know?
Thinking of an article posted on the site prior to Anthony’s that credited AGW for 1-2 degrees of Portland’s heatwave. Bad thinking based on theory.
Well, Coach, there has been some warming over the past 300 years or so. Intellectually, you could add something to any and every subsequent heatwave, although that is a scientific stretch since science can’t ascribe the temperature of any individual event to that level of accuracy.
UAH6 shows a trend of 0.14 C/decade over the past 42 years. Since that period covers a time of upswing in an established cyclical minor warming trend, I’d set that as being above the maximum possible long-term result if temperatures continue to rise. The actual result of the 2020’s might settle the debate; we appear to have entered a period of declining temperatures.
That extra few degrees of heating in the Northwest last week should be attributed to adiabatic heating, not CO2. When winds blow downhill, they heat up, and that’s what was happening in this area at the time. It was a perfect adiabatic storm.
Mr Abbot:
Those “hills” have been there a long time. And the physics of meteorology have not changed. Why then now? Why was the potential temperature at mountain top height sufficient to arrive at Lytton and heat up under the sun to nearly 5C above the previous highest recorded Canadian temp?
The Foehn effect (Isentropic drawn-down), of itself, did not cause the exceptional nature of the event. It was just one part of it and one that is as old as the mountains themselves.
The Foehn effect takes place, as all weather does, as a consequence of the energy available within the atmosphere.
Most of it was the jet stream pattern in the U.S. causing the downslope winds.
And there was a high-pressure system and a low-pressure system combining in the area to enhance the wind and all the adiabatic effects.
“temperatures are back within the range seen 20 years ago.”
I suppose it would be too much to hope for some quantification of that. All it seems to be saying is that a temperatur that is now considered cold would have been average 20 years ago, and warm 30 years ago.
Look at the UAH chart. Granted 2001 was a bit cooler but 1998 was much hotter.
Try a little intellectual consistency.
Bellman posted: “I suppose it would be too much to hope for some quantification of that.”
From first paragraph in above article: “. . . Dr. Roy Spencer just published the Version 6.University of Alabama-Huntsville satellite-based global average lower tropospheric temperature (LT) anomaly for June, 2021 was -0.01 deg. C, down from the May, 2021 value of +0.08 deg. C.” You can’t get better quantification than that.
The first graph in the above article presents monthly-averaged measured data values over time (as anomalies from a clearly specified average) to a precision of better than 0.1 C. You can’t get better quantification than that.
If one consults that same graph, one finds that the last data point (June 2021) is between the range of data points plotted for the x-axis indices “2001” and “2002”; that is, data from 20 years ago. You can’t get better quantification than that.
“They have eyes to see but do not see . . .” — Bible (NIV), Ezekiel 12:2
Ooops, my typo . . . second to last paragraph should read “. . . last data point (June 2021) is between . . .”
(Corrected) SUNMOD
Thanks 1E6!
The alarmist desperation is palpable 🙂
That’s not stopping Joe Biden from trying to spend $Trillions to fix the non-existent CO2 problem.
90% of which will be expended on democrat-socialist garbage totally unconnected with the Climate Scam.
Yes, they will spend it on 1.5 million Brownshirts.
It looks like that the writers and the commentators have no idea which was the cause for the high temperatures after El Nino 2015-16 from 2017 to 2020: Look at Figure 3.Very probably this cause is disappearing.
https://www.climatexam.com/single-post/global-temperature-of-april-2021-dropped-below-the-pause-level-of-the-early-2000s
Thank you for your post.
Your Figure 2 simply destroys that there is a correlation between CO2 and temperature!
I reposted your site in some replies above regarding the fact that I was never able to find a graph showing these two variables on a graph from governmental agencies. They keep telling us that CO2 is bad. Your graph shows there is absolutely NO correlation.
Your graph starts in 2002. Very convincing.
There was some possible positive correlation from 1980 to 2000 or so.
Love your presentation and discussion.
I can’t help thinking that one of the semi-pro trolls around here will claim that the Japanese data can’t be right because of white privilege!
If anyone wants to throw the raaaacism flag, please try to tell me something I don’t know about one of my heroes; Miyamoto Musashi!
I take delight in imagining how AGW/CAGW “experts”—such as Phil Jones and cohorts at University of East Anglia’s CRU, James Hansen, and Michael Mann—must now be working feverishly to find a means to “use a trick to hide the pause”.
Coming next, the wailing and gnashing of teeth by all those sundry politicians and bureaucrats who promised to follow the science . . . OH, WAIT . . . never mind.
It’s The Science ™ (Church of Climastrology)
“must now be working feverishly to find a means to “use a trick to hide the pause”
No doubt about it!
NASA and NOAA need to cool the past in their computers more. That trick worked before, fooling people into thinking CO2 was causing the temperature rise we were seeing.
Now, we are not seeing a temperature rise, yet CO2 continues to increase, and the alarmists don’t have an explanation for this situation.
Skeptics have an explanation for this situation: Mother Nature.
not 20 years…..it’s the same temp it was in 1983
That’s more like 38 years, isn’t it.
Well. In the UAH chart there is clearly a small upward trend. It is true that temps are back now to where they were 20+ years ago, but looking at the chart, those temperatures then were the highs of temporary upticks. The current low is a low after a much higher uptick. If you draw a line through the peaks and another through the lows, you have a channel with a slight upwards trend.
I don’t think that either the recent highs or the trend are alarming. There’s nothing in that chart to suggest disaster is on its way. There is no suggestion of a hockey stick. But to get to a definite refutation of any warming hypothesis I would like to see the lows on that chart equalled or exceeded to the downside and a more or less flat channel, for some years.
The Tokyo charts are very striking and look like some data in serious need of an explanation. It is very hard to see why, if the global climate is warming at any speed, Tokyo, over this time period, would be showing slight declines. One could understand that there might be divergence over shorter timescales, but this is a long standing trend.
The plotted slope on the Tokyo mean annual temperature chart is not consistent with the plotted slope on the Hachijojima mean annual temperature chart, although both do show slight declines.
To explain these declining temperature in a world that really appears to have been warming globally over these time intervals, I will speculate that perhaps an inverse-UHI effect is present in both data sets, or perhaps the instrumentation/signal processing/data analysis has changed over the 26 years of the Tokyo data or the 70 years of the Hachijojima data.
Comparison of these two data set trends would have been much easier if a linear curve fit had been applied to only the last 26 years of Hachijojima data.
What could cause an inverse UHI effect? I can’t imagine anything that would do that, that can plausibly have happened in Tokyo over that time period. Are there any other cases of inverse UHI? I guess it would lead to the city being cooler than the surrounding countryside?
Inverse UHI effect could be caused by re-locating heat sources AWAY from the temperature monitoring stations or by better configuring the enclosures of the heat monitoring instrumentation to minimize effects of UHI.
Yes, I guess this is right. It would have to be something to do with measurement. I can’t imagine anything plausible happening that would actually lower average temps in this way.
But when you look at the charts, there are none of the step changes you expect to see if monitoring stations have been changed.
Is this true of other countries? That is, are there other countries or regions that appear to be cooling despite the global rise?
Or put it another way, is the rise in global temps coming from a a subset of countries or regions?
There are numerous other local/regions that do not show warming trends. I’ve been an arduous proponent that the Global Average Temperature (GAT) is meaningless unless local/regional components add up to the whole. Way too many studies and papers simply rely on a simple quote that GAT is increasing and causing effects for local or regional changes.
What do the sunshine hours indicate, decrease ?
“It is very hard to see why, if the global climate is warming at any speed, Tokyo, over this time period, would be showing slight declines. One could understand that there might be divergence over shorter timescales, but this is a long standing trend.”
Tokyo is not alone. All unmodified, regional surface temperature charts show the same thing the Tokyo chart shows: That it was just as warm in the Early Twentieth Century as it is today.
What that means is that we are not experiencing unprecedented warming today, as the alarmist claim, attributing the unprecendented warming to CO2, but rather the Earth is going through a normal cycle of warming for a few decades and then cooling for a few decades, and then repeating the process, and CO2 seems to have no influence over this pattern.
I’m going to add that Tokyo chart to my collection of similar charts from all over the world.
The only thing alone in the climate science world is the bogus, bastardized global surface temperature Hockey Stick chart. It’s “hotter and hotter” temperature profile looks nothing like the temperature profile of the regional charts, and it is the only thing on Earth that is showing unprecedented warming. None of the regional charts show unprecedented warming.
Compare the two charts:
Bogus Bastardized Hockey Stick chart:
The real global temperature profile as represented by the unmodified, regional surface temperature charts, shows we have nothng to fear from CO2. There is a lot more CO2 in the air now than in the 1930’s, yet it is no warmer now than then.
We don’t need to spend Trillions of dollars trying to reduce CO2.
Please note that GISS combines ocean and land temperatures. That is why Karl fiddled with SSTs. Anyway, that graph is going to look pretty ugly to the CliSciFi practitioners when it is updated through 2021. I wonder if it will be updated.
Tom,
Among your regional charts do you have one for Australia based on UAH?
I have run an excel sheet for the figures from the last column in the UAH details given monthly(shown as the right hand column each month) since 2000 and it appears to be flatlining.
As we are just past the Climate Normal of 30 years,1990 to 2020,I am interested in seeing whether any warming in that period is significant or not for Australia (within 2 sigma deviation from the norm etc.)
Can you assist?
Herbert, I don’t have an Australia chart based on UAH.
What I do have is a Tmax chart of Australia. It shows it was just as warm in the Early Twentieth Century in Australia as it is today. Just like all the unmodified, regional charts from around the world show.
Australia chart:
Tom,
Thanks very much. That is most helpful.
It must be pointed out that things have changed since Phil Jones’ antics.
Today we have R2P – responsibility to Protect, the 77th Brigade of the British Army – a swarm of blog interventionists with charming aliases, all funded by the British taxpayer, unwittingly.
This Rapid Response leads to the US Facebook et. al, as usual awash in $$$.
And we have this :
Citing the arch British agent, and godfather of George Soros, Sir Karl Popper, Cass Sunstein advocated direct government intervention in Internet chat rooms in the form of “cognitive infiltration,” suggesting that the resulting cognitive dissonance would render any political danger from conspiracy theories politically impotent. Sunstein proposed that private individuals fed with government information systematically intervene in Internet conspiracy forums.
So watch out – you may face a brigade of charming aliases.
There is someone seriously WRONG with the models. It is unscientific to IGNORE the problem.
So, does this mean the satellite is wrong, or does it mean that global warming isn’t big in Japan.
It means the Hockey Stick is wrong.
Ha ha ha ha ha …. another pause. The CAGW alarmists are once again going to become the b*tches of Lord Monckton.
Batches, that’s what I mean, batches, of course.
https://m.youtube.com/watch?v=iyp9fh-u4w8
Please would someone explain why such different images for the above links, comparing NOAA with CDAS