Reposted from the Cliff Mass Weather Blog
I think I found something important.
But I will let you be the judge. And I would love to hear from any epidemiologists that read my blog.
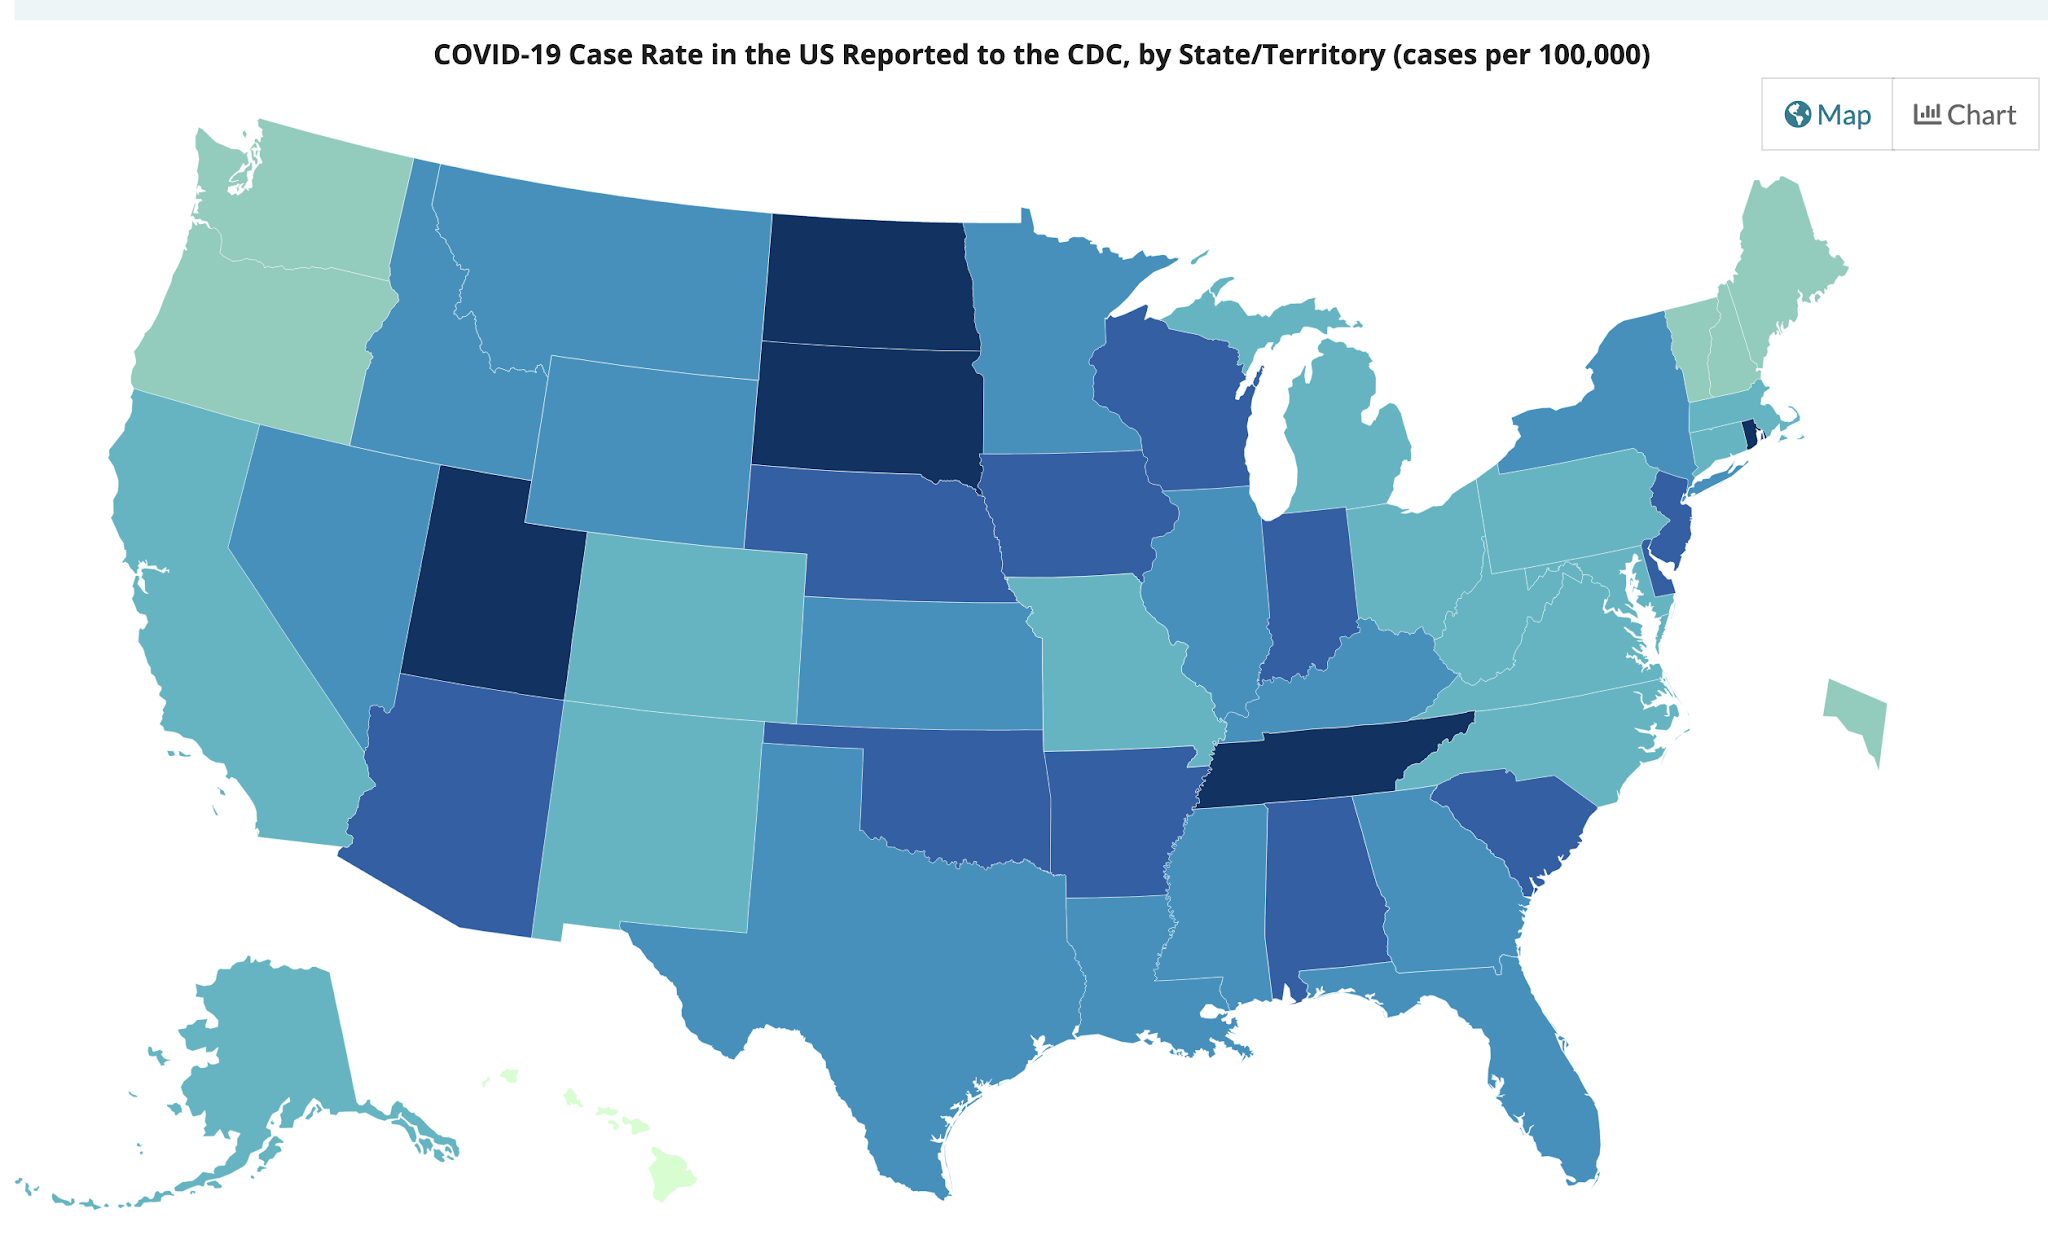
The number of COVID cases is increasing in Oregon and Washington, while most of the other states are seeing declining or stable COVID caseloads. The increases are sufficiently worrying that Governor Inslee may reverse the opening of the State.

There is a lot of talk about the need to get herd immunity, in which enough of the population will be vaccinated or have had COVID so that the virus lacks sufficient susceptible people for spread. But no one seems to be sure about what percentage of immune individuals is needed. 60%, 80% or 90%. Some scientific papers and media accounts suggest we will never get to herd immunity. But what is the truth?
I am not an epidemiologist, but it seems to me that there should be sufficient information to get some real answers to the above questions. And so I sat down with a cup of coffee (actually several) and the data from the Centers for Disease Control and cranked through the numbers.
And I found something interesting.
For each state, I estimated what percentage of the population is immune to COVID-19 and then I compared that to the change in the number of new cases over the past few weeks.
I found a significant relationship between the two. And I may have discovered the magic herd immunity percentage.
Estimation of the Percent of the Population Immune to COVID-19
First, I started with the percentage of each state’s population that has been reported to have had COVID-19, which ranges from roughly 4 (Oregon) to 14 (Rhode Island) percent.

There is an extensive literature suggesting the actual numbers of infected people are far higher than the official case numbers, with several research papers suggesting that a factor of three is reasonable. So I started by taking the CDC state case percentages and multiplying by 3.
Then I secured the vaccine data for each state, and based on the CDC numbers of single and double vaccinations, I assigned 60% of the total vaccinations as the number of people that have gotten at least a single shot. I then added this number to the 3 times case percentages noted above, to get a final fraction of immune individuals for each state, with numbers running from .56 (Oregon) to .936 (Rhode Island). This will undoubtedly be a bit of an overestimation because there will be some people that have had COVID that are vaccinated, but that would only shift my estimates of herd immunity by roughly 5-10% at most. In any case, the approach is consistent for all states.
That Change in COVID Cases for April 15-April 28th
My hypothesis is that increasing percentages of antibodies for COVID should be related to declines in COVID case numbers. Sot I next turned to the CDC COVID trends pages.
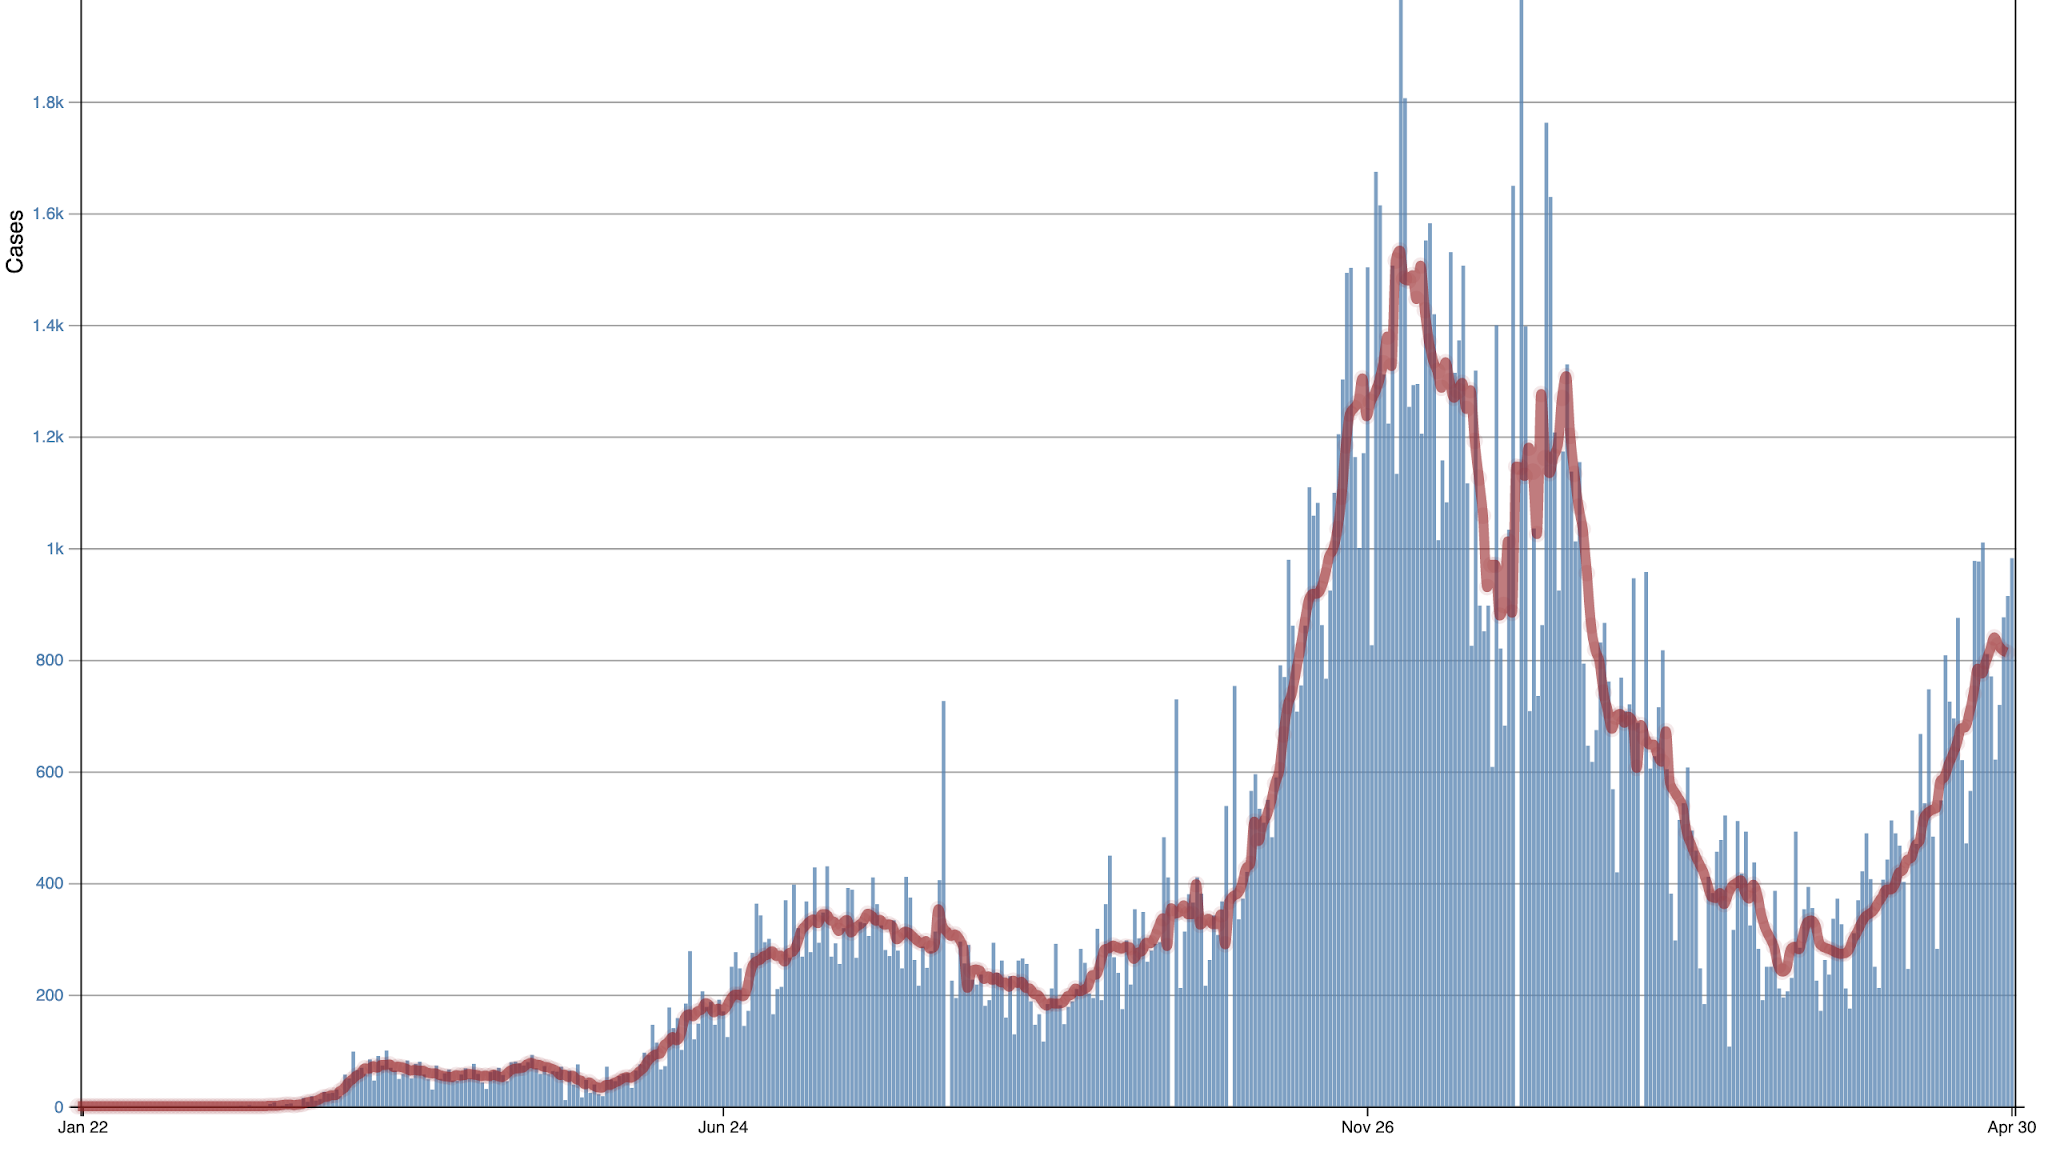
Here is the one for Oregon. Not good. Cases have been rising quite a bit (blue are daily values) and red are 7-day running means).

Oregon
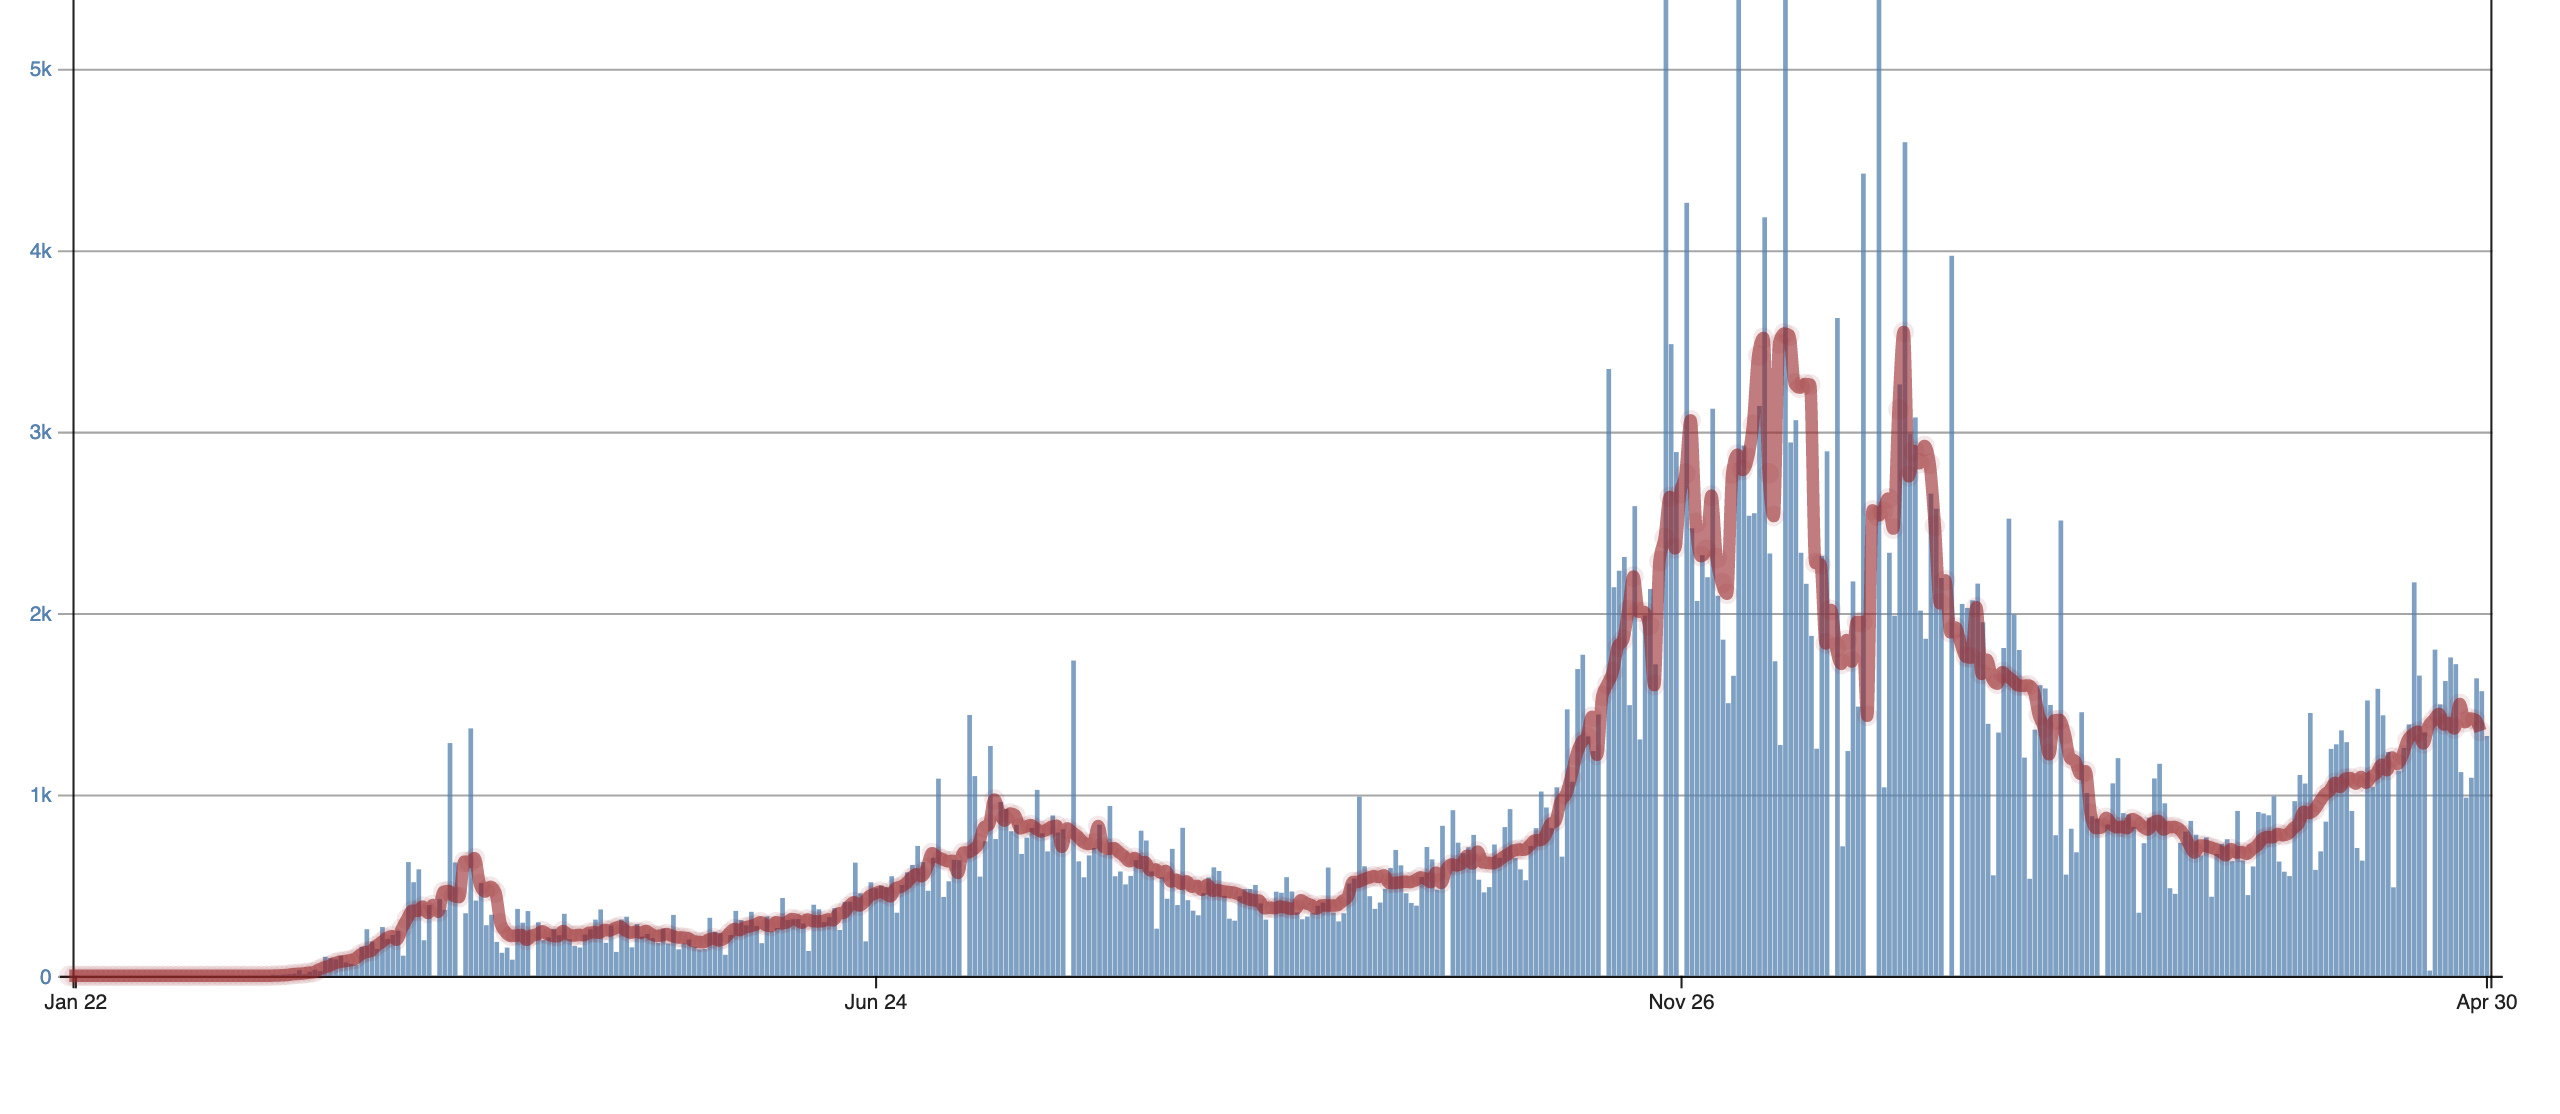
For Washington State, the situation is a little better, but still going the wrong way. This is why Governor Inslee is threatening to clamp down (and I will suggest later that this would be a mistake).

Washington
On the other hand, Rhode Island and Massachusetts are seeing rapid declines. Can we understand why? I think we can.
Using the CDC trend plots and accompanying numbers, I found the changes in the number of cases for roughly the last two weeks (April 15 to April 28th), using the red lines (running 7-day means) shown for each figure. Then I compared the recent case number trends in each state against the fraction of state citizens that were immune. The results are shown below. And they are exciting and make a lot of sense.
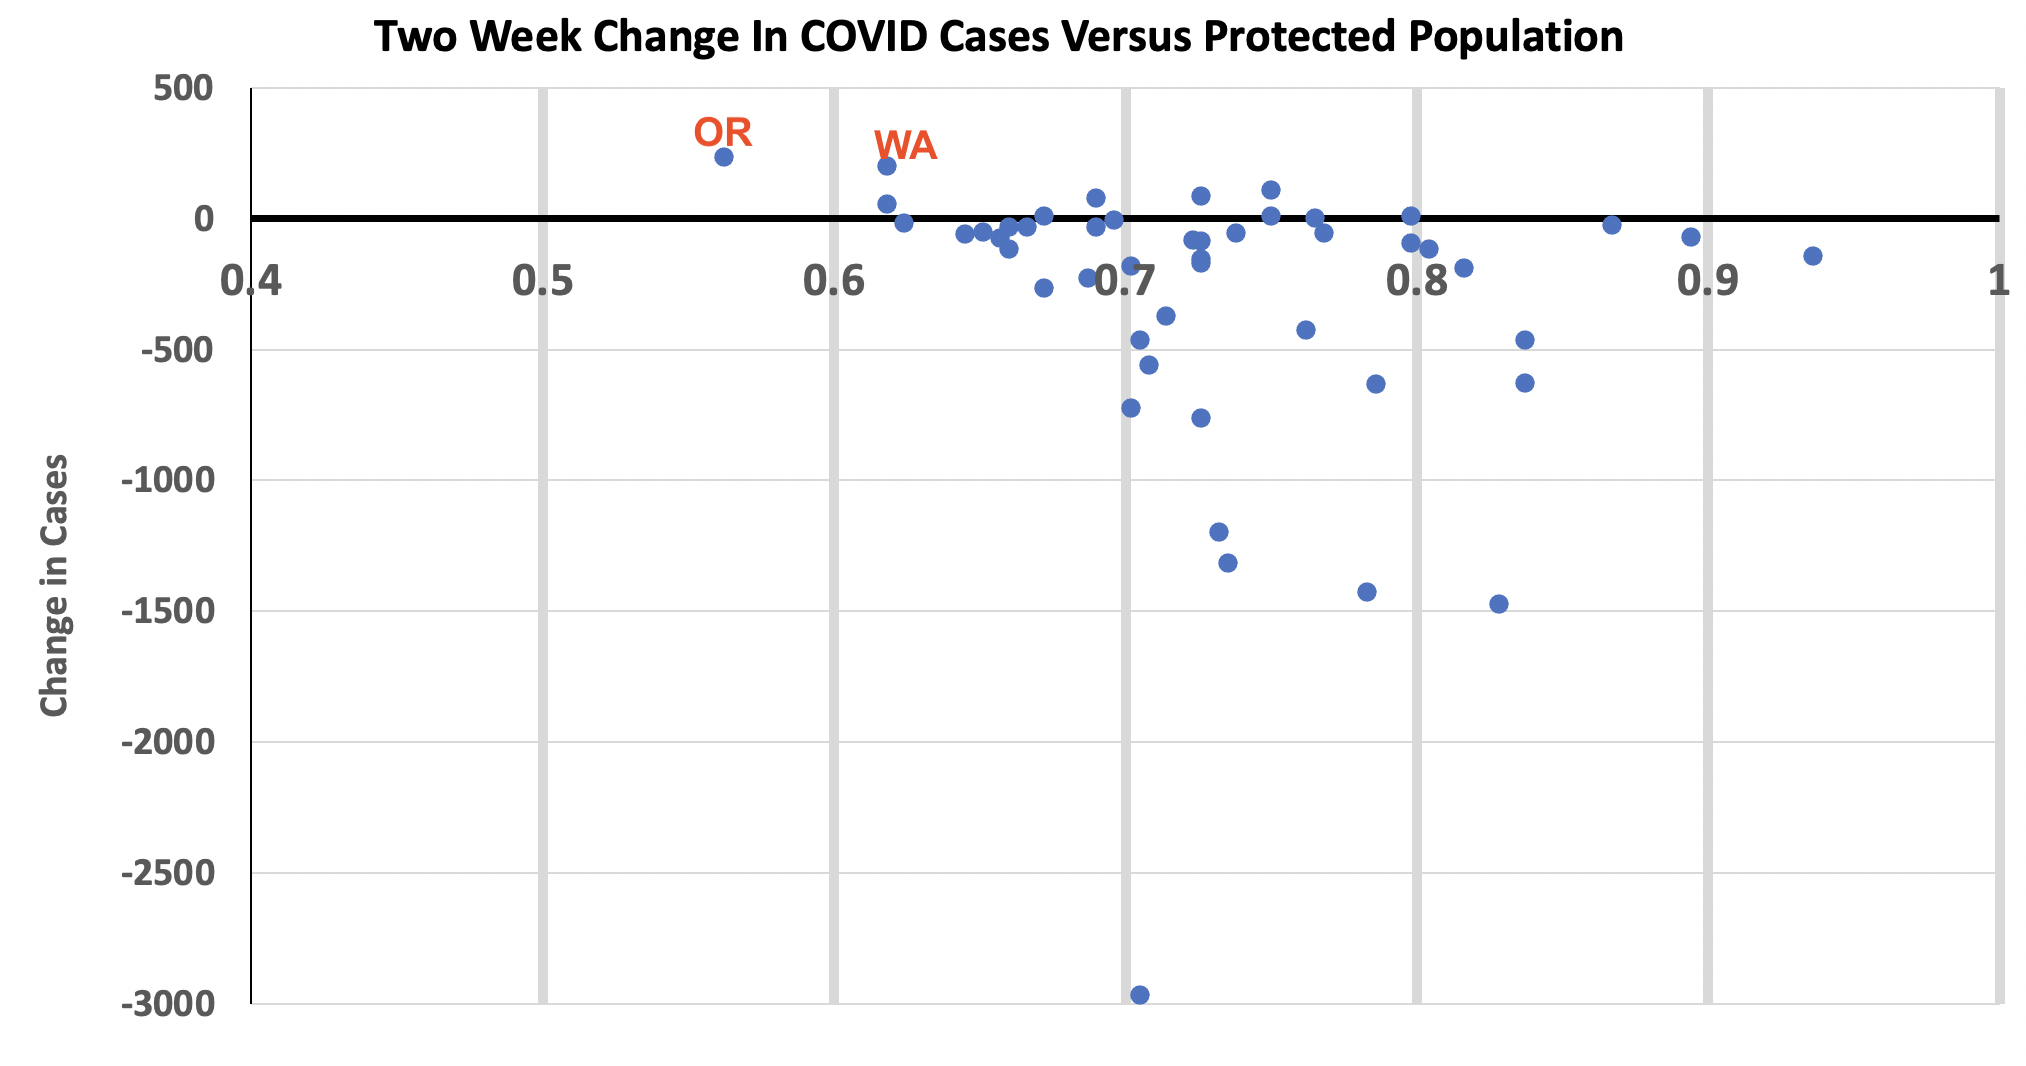
The Y-axis indicates the change in the number of cases per 100K residents and the X-axis is the fraction of state citizens that are immune. Each dot is a state.
The two states with the largest INCREASE in COVID cases for that period are Oregon and Washington! And we are the states with the smallest percentage of immune individuals.
But once you get above .65 there are no significant increases in COVID. But what REALLY is significant is that the big drops in the number of cases start abruptly around .7, at which 70% of individuals are immune. Something very special is happening at .7 and it appears it represents the transition to herd immunity.

Now you may ask why some states are above .7 but are not showing recent changes. I believe there are several reasons for this. Some of these states made the transition to herd immunity earlier than two weeks ago. Once a state transitions, numbers fall and stabilize. Another possibility is that a major reopening of a state can temporarily maintain current COVID levels.
But there is a clear message from the above. Once you get to .7, the expansion of COVID is over and a collapse of the number of cases is possible.
Now there is a potential message here for Governor Inslee in all this.
Washington State is on the verge of reaching a sufficiently large percentage of immune individuals so that COVID cases will first stabilize and then rapidly decline. At the large rate of vaccination being given in our state (about 60,000 per day according to the WA DOH website) plus the natural spread of the virus, we move from ~.63 today to .7 in roughly a week. Do we need to add restrictions at this point?

There are other factors that may well contribute to a major decline in WA state Covid numbers during the next month or so. We are now entering the warm/dry portion of the year, with people spending more time outside and opening their windows. As noted in an earlier blog, outside air is very COVID safe. Second, vaccinations are now available for younger people, exactly those who are contributing much of the transmission of COVID.
Does the above analysis make sense? Why haven’t others done similar number crunching? Let me know if you see any flaws in logic or approach. But it all seems logical and the picture is coherent and self-consistent.
Counting cases could be meaningful. If the CFR is constant and the serious-long-term symptoms are constant, too, then, indeed, counting cases counts.
Using the hyper-sensitive false-positive-generating PCR test makes case-counting problematic.
If the reality is that the increased cases are among those with very low CFR and low probability of long-term issues, then counting cases is counting new members of the herd contributing by recovering. We would expect just such a “harmless” case increase as immune systems fight it off.
The under 16s seem totally safe. 16-66 nearly as good. Even those among the elderly who get it now were not in a nursing home. They were among the relatively healthy old folks. Not obese, not diabetic, not on oxygen, etc. The survival rate even among over 80 is well over what the “average” is because most folks that could die of Covid already did.
Yes,I think Cliff is on it. This morning here in western Washington we were facing an odd roll back of freedoms, not in line with even the most meager official data available.
Now we have learned that or lord governor has chose to pause further inflicted pain. I believe Cliff helped. 👍
Certainly many people did not seek medical help thus were not in case statistics, as they did not feel quite ill.
3x is conceivable. And note some people had immunity from something in their past.
‘Herd immunity’ threshold is probably well below 80%, which is the threshold for the more contagious disease MEASLES. (Check news a year or three ago from the Vancouver WA area which had a large outbreak.) But probably over 60%. NWT and YT are nearing that level, as they have many small settlements remote from acute care and having many old people – and probably near poverty in some (dysfunctional reserves like the violent Pine Ridge in the Dakotas are high risk).
Confusing factors however:
– how much protection from the first dose of the two-dose vaccines? Early reports suggest it prevents serious illness, which is the true concern (though irrational flappers and political panderers ignore that).
– mutating virus
– children, who are not much affected and do not shed much virus (adults who do not feel substantially ill don not either), but many flappers and panderers evade that. I give BC credit for resuming in-person schooling last fall, unlike The People’s State of WA.
– misleading statistics about 20-50 yos, with flapping and pandering. The problem is of course health conditions, which individuals may not recognize in themselves. Currently highlighted is obesity which is often accompanied by diabetes and poor nutrition. (Sit on a couch eating pastries all day and you will become a vulnerable potato.) Diabetes can be controlled with medicine and diet, so once recognized need not be a substantial risk factor. I say anorexics are at risk because of bad nutrition (disqualifying for a driver license in at least some jurisdictions. Unrecognized weak heart another, I guess both of those are not common. But control freak politicians like Herr Horgan of BC do not want to be specific, they just blather case totals without normalizing them let alone clearly communicating true risk factors.
Interesting! Using RT-PCR testing to identify cases is problematic given the inherent problems with the test (cycle time used and the number of false positives). I believe we were at herd immunity much sooner, but varies from state-to-state. Lockdowns only delayed the progression through population and herd immunity as suggested by another comment (Farr’s Law) or what I refer to as the epidemic curve. Cross immunity plays into this and likely explains the asymptomatic and mild infections and likely moderate infections for whom no testing was accomplished for a number of reasons, or specific treatment. Hence, far more cases whom have recovered. Hence, increase in herd immunity within population. Testing should be driven by signs and symptoms rather than just testing those without signs and symptoms. Lockdowns were unnecessary and masks are a joke. PH is about targeting those most vulnerable, not health people. The unintended consequences were far worst IMHO than the coronavirus. Just looking at the infection fatality rate around .15% and the case fatality rate around 1% speaks for itself.
The actual answer is 50% vaccination rate. here is my reasoning:
1) the transmission of the virus between people under 18 is negligible. the young simply don’t get COVID19. Or if they do they are not especially infectious.
2) That cohort is close to 20% of the population.
3) 50% vaccination + 20% under 18 = 70%.
4) Add in 10-15 % natural immunity, from people infected but not vaccinated.
5) 85% immunity = transmission crashes.
Also both the UK and Israel have seen infection rates crash once they got past 50% vaccination.