Reposted from the Cliff Mass Weather Blog
I think I found something important.
But I will let you be the judge. And I would love to hear from any epidemiologists that read my blog.
The number of COVID cases is increasing in Oregon and Washington, while most of the other states are seeing declining or stable COVID caseloads. The increases are sufficiently worrying that Governor Inslee may reverse the opening of the State.

There is a lot of talk about the need to get herd immunity, in which enough of the population will be vaccinated or have had COVID so that the virus lacks sufficient susceptible people for spread. But no one seems to be sure about what percentage of immune individuals is needed. 60%, 80% or 90%. Some scientific papers and media accounts suggest we will never get to herd immunity. But what is the truth?
I am not an epidemiologist, but it seems to me that there should be sufficient information to get some real answers to the above questions. And so I sat down with a cup of coffee (actually several) and the data from the Centers for Disease Control and cranked through the numbers.
And I found something interesting.
For each state, I estimated what percentage of the population is immune to COVID-19 and then I compared that to the change in the number of new cases over the past few weeks.
I found a significant relationship between the two. And I may have discovered the magic herd immunity percentage.
Estimation of the Percent of the Population Immune to COVID-19
First, I started with the percentage of each state’s population that has been reported to have had COVID-19, which ranges from roughly 4 (Oregon) to 14 (Rhode Island) percent.

There is an extensive literature suggesting the actual numbers of infected people are far higher than the official case numbers, with several research papers suggesting that a factor of three is reasonable. So I started by taking the CDC state case percentages and multiplying by 3.
Then I secured the vaccine data for each state, and based on the CDC numbers of single and double vaccinations, I assigned 60% of the total vaccinations as the number of people that have gotten at least a single shot. I then added this number to the 3 times case percentages noted above, to get a final fraction of immune individuals for each state, with numbers running from .56 (Oregon) to .936 (Rhode Island). This will undoubtedly be a bit of an overestimation because there will be some people that have had COVID that are vaccinated, but that would only shift my estimates of herd immunity by roughly 5-10% at most. In any case, the approach is consistent for all states.
That Change in COVID Cases for April 15-April 28th
My hypothesis is that increasing percentages of antibodies for COVID should be related to declines in COVID case numbers. Sot I next turned to the CDC COVID trends pages.
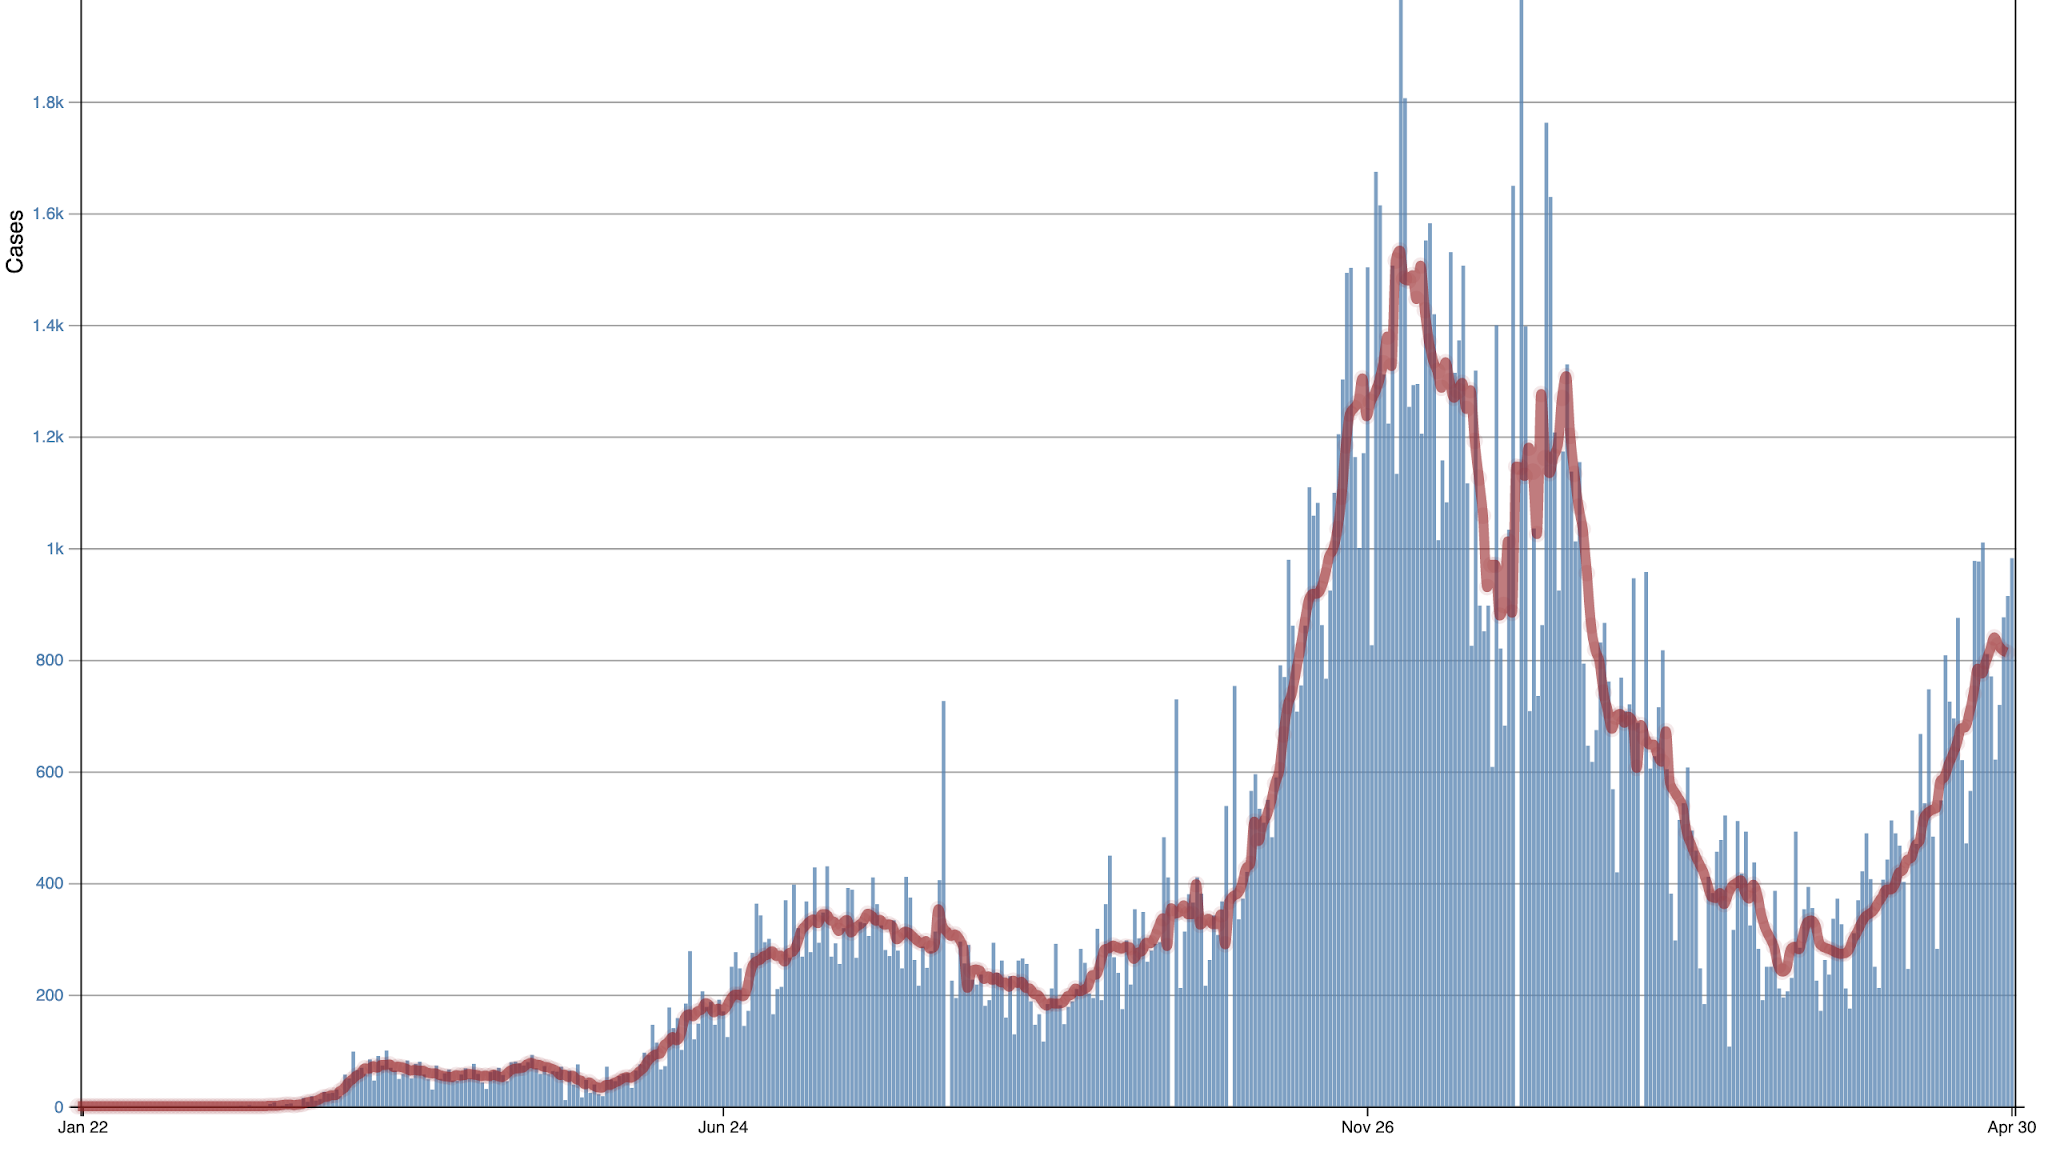
Here is the one for Oregon. Not good. Cases have been rising quite a bit (blue are daily values) and red are 7-day running means).

Oregon
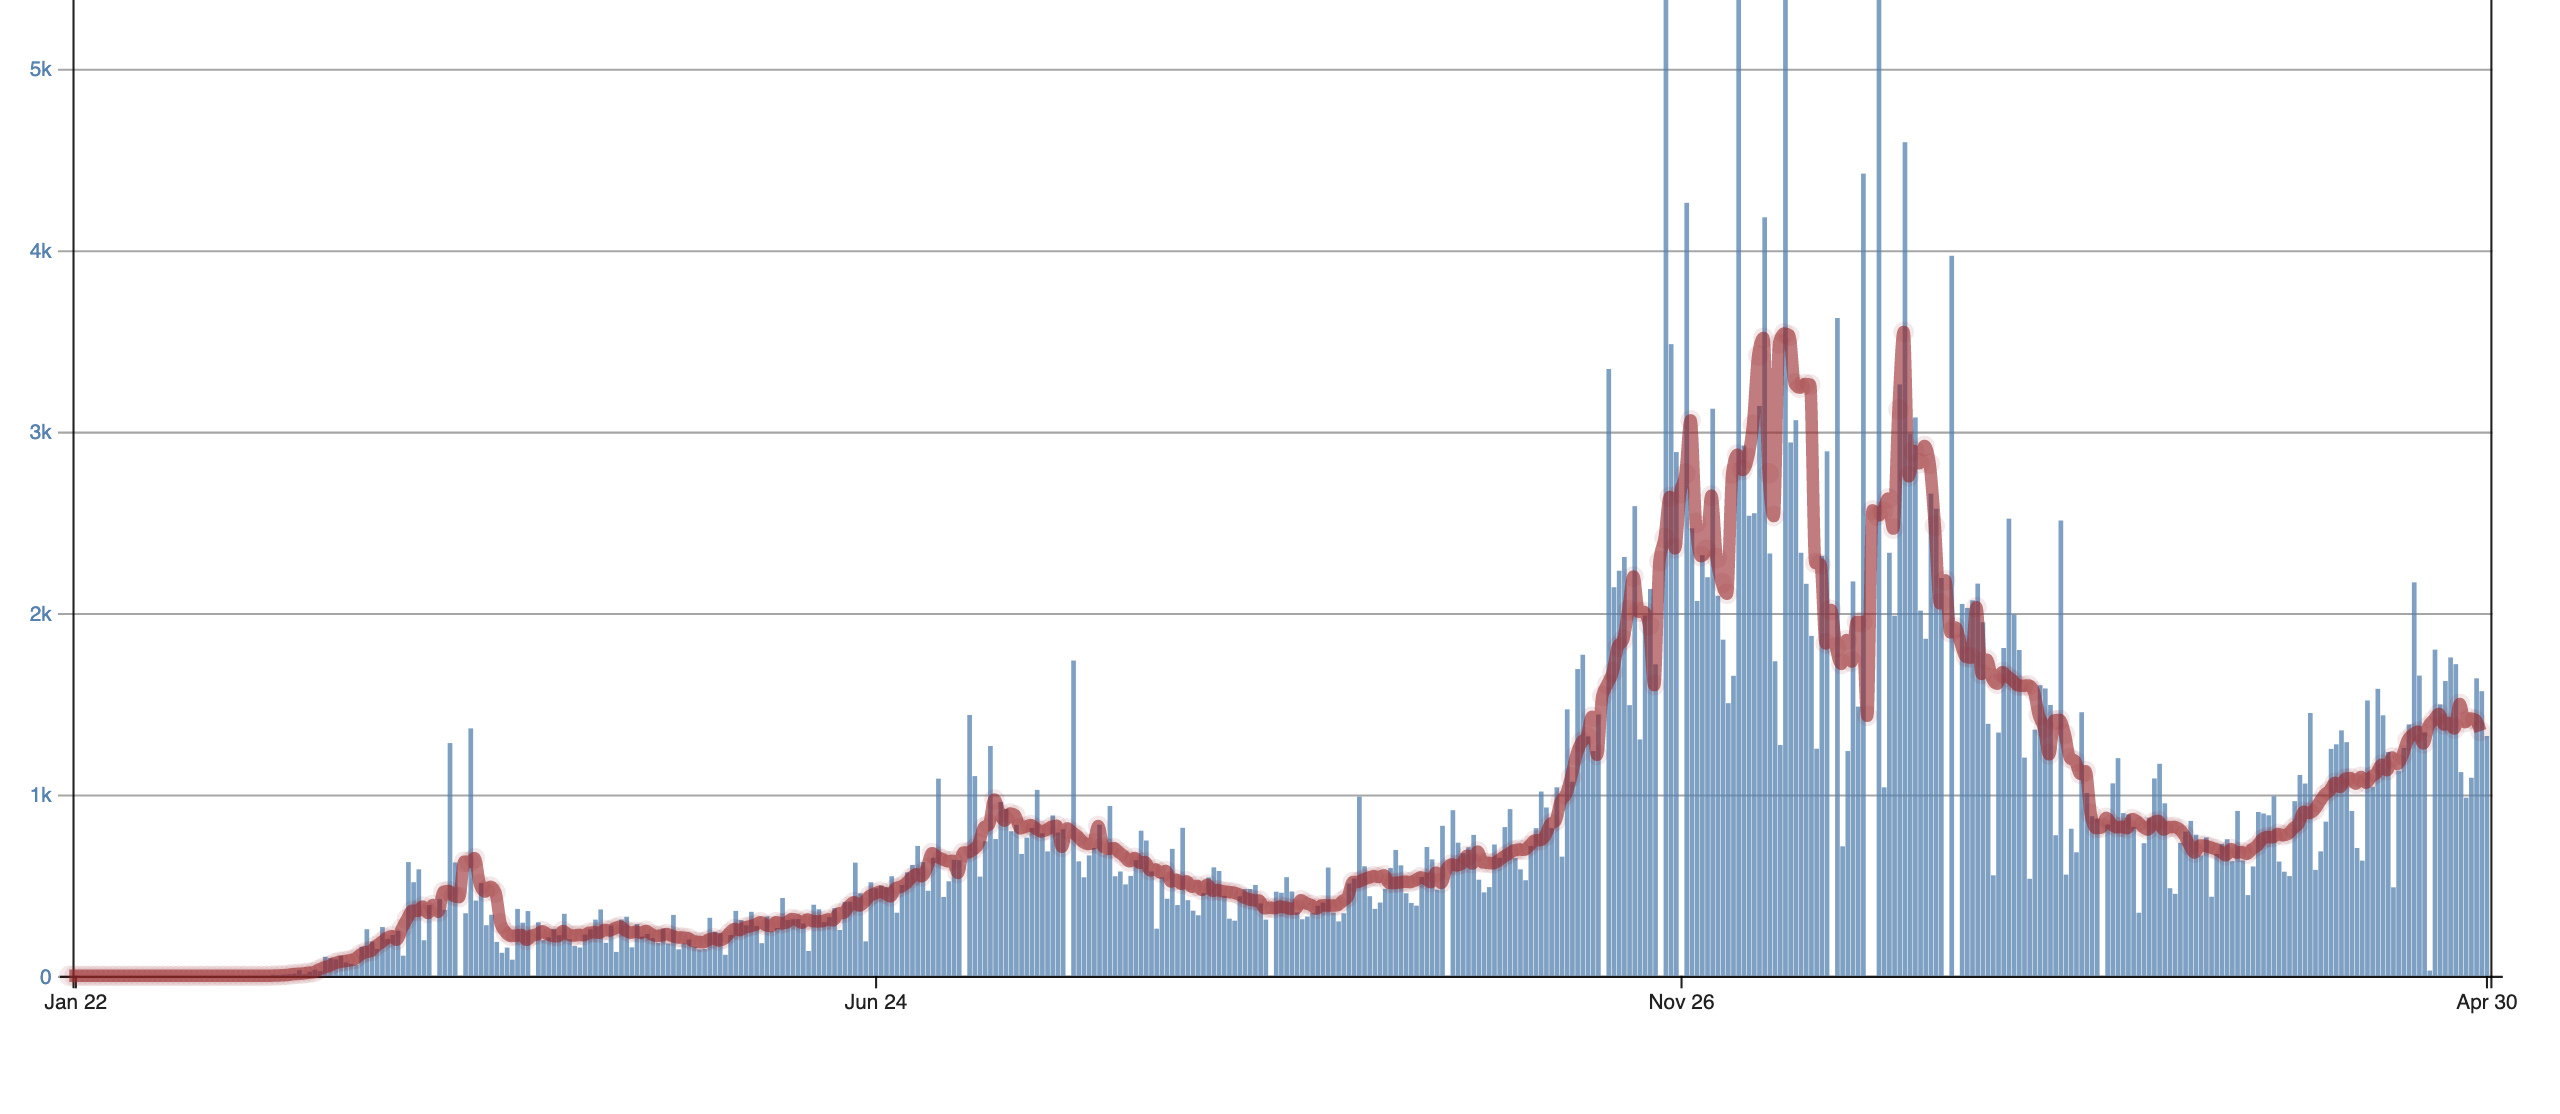
For Washington State, the situation is a little better, but still going the wrong way. This is why Governor Inslee is threatening to clamp down (and I will suggest later that this would be a mistake).

Washington
On the other hand, Rhode Island and Massachusetts are seeing rapid declines. Can we understand why? I think we can.
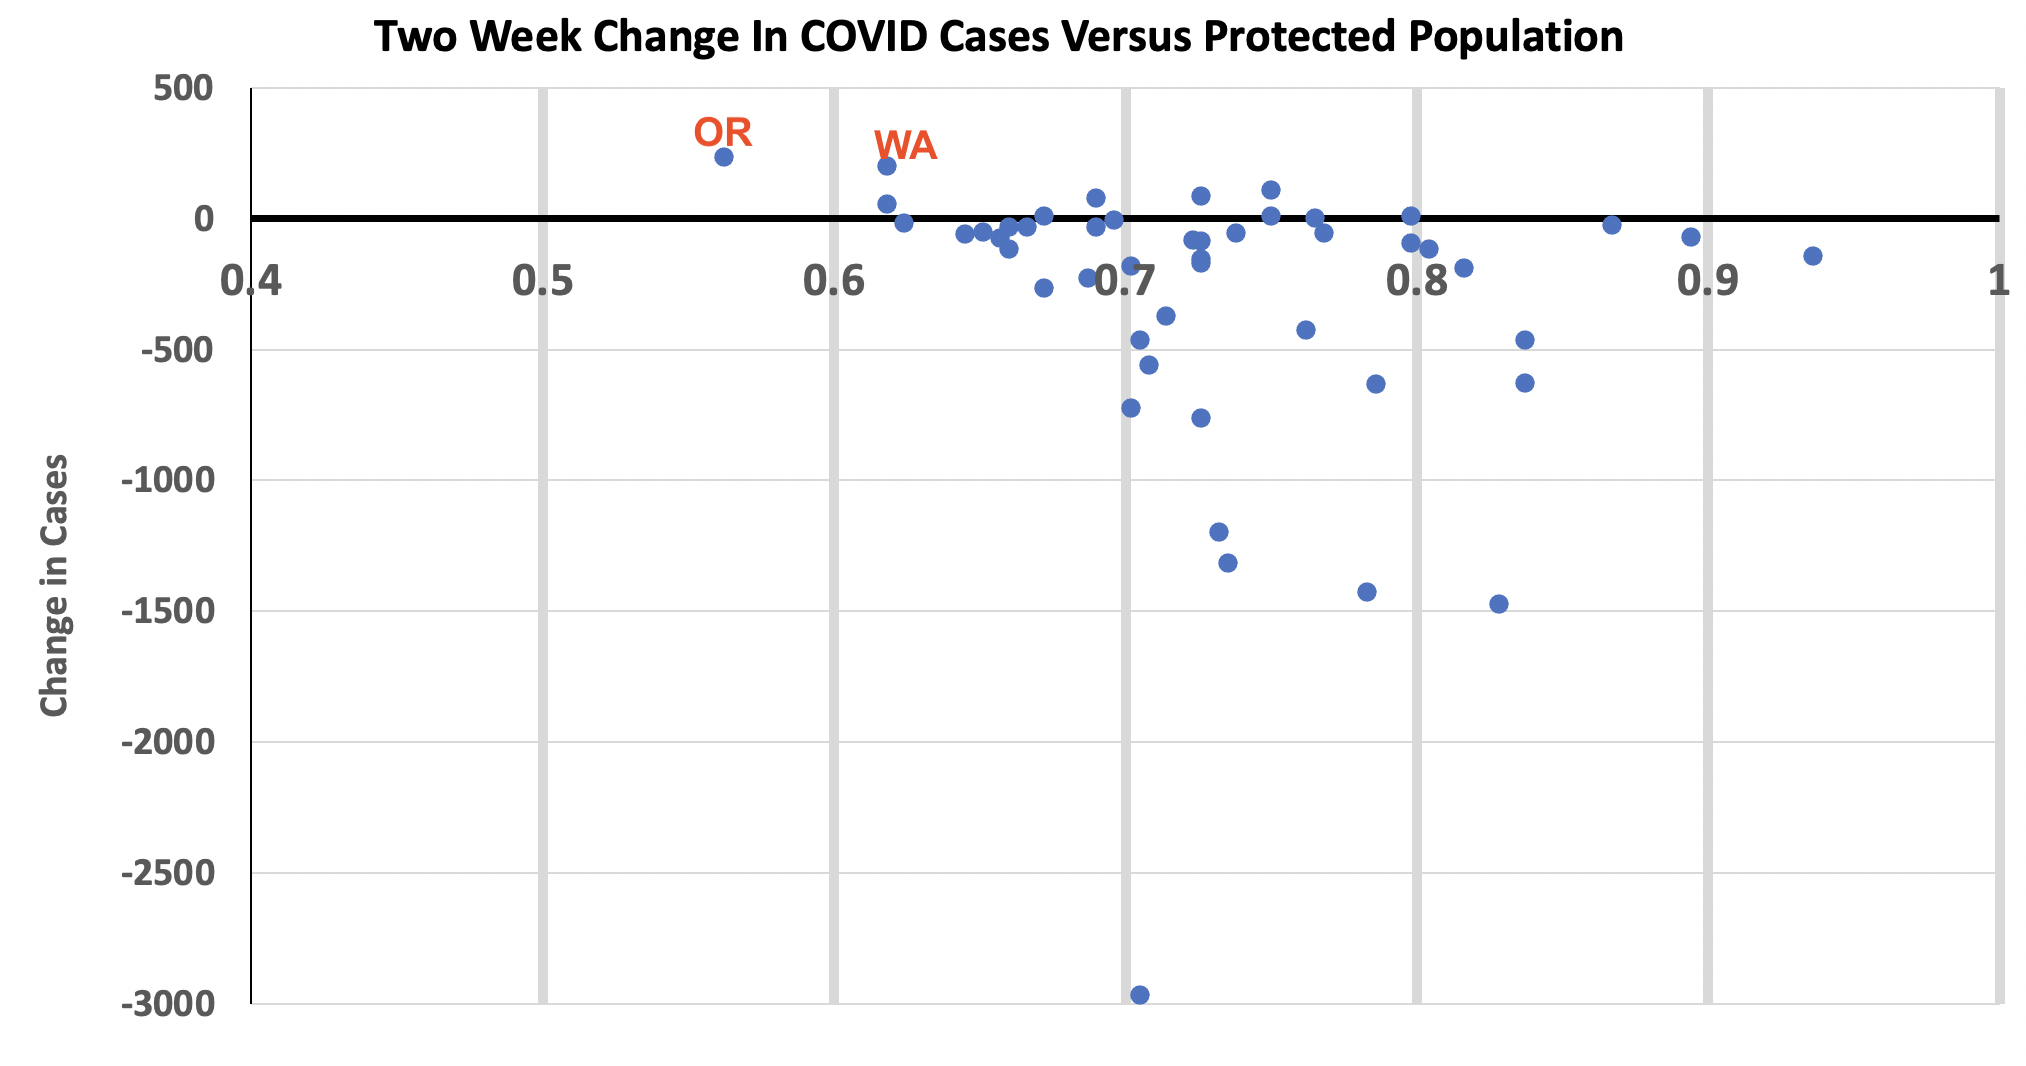
Using the CDC trend plots and accompanying numbers, I found the changes in the number of cases for roughly the last two weeks (April 15 to April 28th), using the red lines (running 7-day means) shown for each figure. Then I compared the recent case number trends in each state against the fraction of state citizens that were immune. The results are shown below. And they are exciting and make a lot of sense.
The Y-axis indicates the change in the number of cases per 100K residents and the X-axis is the fraction of state citizens that are immune. Each dot is a state.
The two states with the largest INCREASE in COVID cases for that period are Oregon and Washington! And we are the states with the smallest percentage of immune individuals.
But once you get above .65 there are no significant increases in COVID. But what REALLY is significant is that the big drops in the number of cases start abruptly around .7, at which 70% of individuals are immune. Something very special is happening at .7 and it appears it represents the transition to herd immunity.

Now you may ask why some states are above .7 but are not showing recent changes. I believe there are several reasons for this. Some of these states made the transition to herd immunity earlier than two weeks ago. Once a state transitions, numbers fall and stabilize. Another possibility is that a major reopening of a state can temporarily maintain current COVID levels.
But there is a clear message from the above. Once you get to .7, the expansion of COVID is over and a collapse of the number of cases is possible.
Now there is a potential message here for Governor Inslee in all this.
Washington State is on the verge of reaching a sufficiently large percentage of immune individuals so that COVID cases will first stabilize and then rapidly decline. At the large rate of vaccination being given in our state (about 60,000 per day according to the WA DOH website) plus the natural spread of the virus, we move from ~.63 today to .7 in roughly a week. Do we need to add restrictions at this point?

There are other factors that may well contribute to a major decline in WA state Covid numbers during the next month or so. We are now entering the warm/dry portion of the year, with people spending more time outside and opening their windows. As noted in an earlier blog, outside air is very COVID safe. Second, vaccinations are now available for younger people, exactly those who are contributing much of the transmission of COVID.
Does the above analysis make sense? Why haven’t others done similar number crunching? Let me know if you see any flaws in logic or approach. But it all seems logical and the picture is coherent and self-consistent.
Quite reasonable.
Let us see what will be the next move of the virus.
Simple, it still will be a double infection virus,
throat infection plus lung infection,
but next will be the other throat too,
the one the Chinese were trying perversely to swab test…
🙂
Please, blame me not, you pointed to a considerable outcome, I just tried to substantiate it…
cheers
upvoted for the chuckles on this post
Mr. Mass, all-in-all a good analysis and write-up, but your corrections fail to say anything about those who were already immune (without showing any symptoms) but received a vaccine anyway, nor did you add anything to the final immunity number to take into account those who were naturally immune and were never going to get sick from it, even if they did not receive the vaccine either. Hell, as far as we can tell, the U. S. may have already been >50% protected before the first vaccine was ever administered. Do you think you could produce a range, rather than just a minimum? I like the graph, though, that says a lot to me.
Read Nic Lewis’ work. And Gabriela Gomez too.
In New Jersey USA where I live the number of daily positives here dropped precipitously in the past week. The transmission rate as of today is 0.37. This also happened in May 2020.
My condolences and prayers for you, living in one of the hardest hit states!
What seemed to be the reason for NJ’s high fatality rate; bad leadership, like NY and MI; or were there other factors involved?
NJ is a very densely populated state. I think the most in the US. It also had the virus early. It also has lots of nursing homes. So the high infection and fatality rate is not unexpected. Outside of vaccines I don’t see much that can be done.
The analysis is likely close to the mark. However, if the governor is aware of this, he probably will impose restrictions so that he can take political credit for the rapid drop in cases caused by herd immunity. Herd immunity does appear to be a much more variable threshold than at first imagined, with seasonal effects probably being the dominant variable.
Here in the UK, we appear to have reached herd immunity now. However, the lull last summer could be viewed as a seasonal herd immunity which ceased in the autumn as the population moved back into enclosed spaces, and lower vitamin D levels. I still think that we should have come out of that first lockdown at least a month earlier, allowing more people to gain natural immunity in the summer prior to the severe second wave. Our first lockdown was released on 4th July – some sort of colonial cessation day 🙂 which may be an accidental indication of the political nature of the epidemic.
Washington and Oregon are also two low states in deaths/million. It could just be that they are now “catching up”. If/when herd immunity is realized we will never know how much is due to vaccinations or natural gained immunity unless everyone is tested for antibody type
(or lack thereof).
Compare current curve with 1918 curve of death rate. Recall that in 1918 there was no vaccine. But we are told now what a great job the vaccine is doing. Is it really?
Ewin, that is a very interesting chart. Thank you.
And there are 4 times more people today and more testing being done. I think these graphs
show a pattern for deadly flu virus spread and our ability today to contain it.
Beautiful herd of cows in the headline picture. Sadly wasted image though as herd immunity is an irrelevant concept for mild seasonal illnesses like Covid. As with last year, real Covid disease levels, (not fake case levels), will plummet in May due to environmental factors that have little to do with herd immunity. Covid deaths currently remain low and stable in all countries that I have recently checked, exhibiting total disdain for case levels. Expect Covid deaths to become vanishingly small over the summer without regard for vaccination level, severity of lockdown, use of face diapers or any of the other black magic employed by cowering politicians. As with all Corona viruses, the mutation rate defeats the vaccine but that is an irrelevant point for a mild seasonal illness that serves mainly to stimulate the immune system. Expect that by next season, even the drooling cretins at WHO will have had enough of the charade and measures that can actually protect the vulnerable will be taken so that we can avoid the twelfth wave. Big pharma will be satiated until next time.
I think we can safely say that the infection rate plummeting in May is correlated with CO2 peaking and then plummeting through the Summer months. /sarc
Population density also plays a big role. I live in a rural (HUD frontier <5 people per square mile) area. We have been stable at for over a month on positive test results. Only two since late March. Over all the zip code has between 2500 – 4000 population depending on who you talk to. We only have 114 positive test results since late March 2020. It doesn’t matter how high the R ought is if the virus has no on to be passed on to since we live far apart and have low interactions.
I started trying to do something similarish back in November but using a different approach. Pre vaccines obviously, but as the Kent variant hit and cases seemed out of control I was wondering if it would only stop when a kind of herd immunity reached. I’m definitely not an expert on this, not my field.
The problem I have with just multiplying cases by e.g. 3 is it doesn’t take into account the considerable changes in testing rates. So I was getting my cumulative cases by using a method to adjust cases based on number of tests and % positive. The other thing is I prefer to look at R as this will start to drop before cases do. Also I’ve not yet figured out how best to estimate vaccine immunity, but think we need to allow for immunity building slowly over about 21 days after a vaccination. But the other problem is different sources of data seem to have a different date offset/delay potentially confusing the comparison between vaccines and cases? Also R and existing immunity might change with new variants.
I’ll try and attach 2 of my graphs for England (I’m trying to do similar for other locations around world and individual local authorities in UK). Upper graph; grey line is cases (gov uk data), black is adjusted cases based on number of tests and % positive. US seems to do more testing than UK so with my method US tends to adjust up quite a bit less than UK. I have low confidence in my adjustment but to my surprise adjusted cases is a surprisingly good match to deaths (pink) and hospitalisations (green). Cumulative cases is red line, from this I tried to create an antibody line (blue) assuming a decay of 0.5% per day. Then compared this with ONS (UK office for national statistics) antibody data (blue squares joined by dashed yellow line). I increased the gain on my adjustment of cases to make those two lines close while also trying to keep prevalence (lower graph, blue line) reasonably in line with ONS prevalence (dark blue squares). My peak prevalence seems quite a bit higher than ONS. I presume actual immunity might be closer to the red line as T cell immunity doesn’t decline as much as antibodies? My R is ratio of adjusted cases +/- 3 days (s = 6), my prevalence is sum of last 10days of adjusted cases. I have 2 vaccine lines, purple is first doses, I had to guess first few weeks as data seems to be missing. Yellow line is my initial attempt at approximating vaccine immunity assuming it gradually increases over 3 weeks after 1st jab.
I’ve not taken into account the WHO changing the test cycles, which I thought off the top of my head was mid December (coinciding with a temporary drop in my R), but someone above says January where I’m not sure I’m seeing it in my R.
Observations: (if there is any validity in my analysis, which I have low confidence in) R was reducing before lockdown on 5th November so was that lockdown necessary? But then R went up presumably as the “Kent” variant with a higher R or requiring slightly different immunity hit. R plummets from around 25th December (people suddenly from then being more careful and on holiday from work?) and reaches 1 early January, vaccine immunity is very low then so not sure vaccines did it. ONS antibody line separates from my antibody line (from cumulative cases) around 24th January implying vaccines could be helping towards herd immunity about then, effect on R not obvious though at any time?
Further analysis: assuming HIT = 1 – 1/R and perhaps somewhere between 20 – 50% have pre existing immunity (so you’re already 20 – 50% of the way to HIT even in 2019, and so must re assess your starting R value). Assuming a relative ‘R’ is lower due to lockdown effectiveness I developed a simple equation to calculate/plot a max ‘R’ based on changing lockdown effectiveness, pre existing immunity and R for 1st and 2nd variants, assuming my R from cases would never exceed that I played around with values to match the two but can’t remember where I got to with that, I think I concluded, even without vaccines, sometime in February or March we could have ended lockdown and have herd immunity. But 2 problems; some locations, like Devon might have so few cases they would not have HI, but I think they could perhaps have released London, south east and parts of North in February. If new variants emerge reducing vaccine and recovery immunity we might be in trouble. I was wishing I had a few students to improve this for me and look at a lot more locations around the world.
At the beginning of the pandemic, there was discussion of R0 and what the corresponding herd immunity number would be, and of the Gompertz curve. From there the ultimate number of cases or deaths was predicted. It would be interesting to look back at those predictions now.
Well, one assumption is that the number of cases reported is somehow a significant value.
I would like to know who considers that number to be so important?
The MSM loves the click bait numbers, but what do they really mean?
Herd Immunity is like Greenhouse Effect — the analogy doesn’t work outside of a grazing herd species or outside of a real, no kidding greenhouse (note: Saint Svante used the term “Hothouse” which is much different from a greenhouse).
Greenhouses don’t get increasingly hotter because of minor trace gasses, they stay warmer because the structure prevents circulation while allowing sunlight in. They still need additional heat sources to just stay stable when the daily temperature outside is lower than the desired temperature inside.
The theory is that one way a herd becomes partly immune from an external disease is by minimizing the potential contact with outside infection — healthier individuals are prevalent at the interface, protecting more vulnerable individual. The claim is that this protective pattern of behavior is protects in a way similar to the behavior that protects a herd from large predators.
Cool idea, but people don’t flipping act that way. In fact, few other species act that way; not ducks, nor bats nor civet “cats,” nor even domesticated livestock of naturally herding species. They all get viruses that have “jumped” to other species, including humans, because they don’t behave as a herd in response to an undetectable external threat.
Perhaps instead of trying to calculate the impossible, we should stop talking nonsense and start talking removing petty dictators from positions of responsibility.
If the democrats had been in power this would have been a non-issue.
This is my first day back in Washington State. I am one of those snowbirds who south in the l. Before heading south last fall, I decided not to get an annual flu shot because the precautions I was taking for covid would keep me safe from the flu.
I make many decisions based on a personal risk assessment rather than fake news.
Here is the data I collected for deaths from the Nevada covid-19 website for one year following the baseless lockdown:
< 10 years old = 0.0 %
10-19 = 0.001%
20-29 = 0.005%
30-39 = 0.01%
40-49 = 0.06%
50-59 = 0.1%
60-69 = 0.3%
70+ = 1%
I am in the 70+ group. I do not find 1% per year alarming. What I find alarming is governors who want to suck the fun out my remaining time.
I know of two cases where people went to the hospital for one thing and were diagnosed with cancer. Since there was nothing the doctors could do, they were sent home to die with family at their side. Both were gone within a week of diagnosis.
There is no herd immunity for getting old. The concept of herd immunity with respect to covid is stupid.
For the record, I have been jabbed twice. My DIL set up the appointments. The only benefit for me is my children worrying less about me. I am lucky to have people concerned about me.
Apparently, it is now known in the epidemiology community that herd immunity for COVID is around 77%
LOL. How much help have all the “experts” been for the last 16 months?
Simplistic computer models based on assumptions which nothing more than assumptions and have largely been erroneous since the start. Eg. “a totally naive population”. While that is certainly accurate in the political sense it is NOT true in the epidemiological sense. It is not clear that there is a significant natural immune reaction, presumably from exposure to other common corona viruses.
Confinement measures were supposed to “flatten the curve”. This means EXTENDING the length if the epidemic in favour of reducing stress on health care systems. It was NEVER supposed to stop the epidemic, simple spread the pain and make it more manageable.
However, if we look at the “first wave” infections in Europe, the epidemic simple died out and continued falling when restrictions were lifted at the beginning of the summer. This is NOT consistent with simplistic models where the epidemic should being rising again with the same R infection rate from the new lower level of infections.
This was the exact opposite of what happened. If that is the best the academic epidemiologist “experts” have to offer we can sack them all and end this field of study. It has been shown to be totally useless in reality.
Any similarity to the field of climatology is totally coincidental, of course.
Greg,
I wouldn’t be so hard on epidemiologists! The fear and uncertainty at the beginning of the nightmare caused most supposed experts to chuck the last couple of centuries of science out the window and try something new!
A lot of the blame for this falls on the ChiComs, who pushed lockdowns on Western leaders with no proof that they work! That our leaders were so eager to lock up their whole populations on the recommendation of a tyrannical practitioner of slavery and murder-for-parts, says something rather unflattering about our leaders; and us for selecting them!
There have been quite a few medical doctors and epidemiologists speaking out against the policies being used, but they were rather harshly dealt with by both Big Tech and the fake news media for daring to question the dogma! Very much like what happens in Climastrology!
Anticipating the effectiveness of mRNA “vaccines” based in a tiny snippet of protein from the target virus is a fools errand.
They are too specific. A recent french language interview with an emminent virologist recently pointed out that if you wanted to design a lab experiment to force a virus strain to mutate its spike protein you would create a petri dish culture where you would introduce an agent which attacked its spike protein and wait for random mutations and natural selective processes to develop a strain with a modified spike protein.
In short, this kind of mass inoculation can be effect in a poplation BEFORE there is widespread infection.
Introducing such a program in a population where the virus is endemic is a sure fire way to CREATE vaccine resistant mutant strains, each requiring a new vaccine and a new vaccination program. Rince and repeat ad infinitum.
As a trillion dollar business model, that strategy seems beyond reproach.
By George, I think he’s got it!
It is way more complicated than that. Firstly, it wrong to say that the pandemic begins with with a zero percent immune population. Epidemiologists have explained that a sizeable percentage (20%, roughly) of the population have immunity through prior exposure to similar corona viruses. How similar? A recent experiment with SARS-1 survivors showed that they produced anti bodies when exposed to SARS-COV-2.
The second issue is the conflation between asymptomatic spread of SARS-COV-2 with asymptomatic spread of COVID-19. These are not the same thing. The first is the virus and the second is the disease it causes. While individual viruses can be transmitted by asymptomatic people, the mere fact they have no symptoms indicates that the viral load is too low to cause disease in people infected. The virus, if passed on, is simply destroyed by the recipients immune system.
The continued obsession with diagnosed cases is no longer justified. Before the vaccine, we could expect some percentage of sick people would go to the hospital, and some percentage would die.
With the vaccine, we have broken that link between cases and death. By vaccinating the most vulnerable first, the death count has plummeted. That’s why a state like Colorado, with a high case count, but low deaths can reopen.
Any account that includes cases without including deaths is no longer representative of the pandemic.
In a world where people are convinced that “case” == “nearly certain death”, case count is a great way to keep the masses cowering in terror and looking to their big brother for salvation.
Never look for logic when there is none.
The virus does what it does entirely random, just cell chemicals merging, when they meet. Vaccines do what they do, but whether they will provide sufficient immunity at a particular time is always uncertain.
Policies can lower exposure to the point that the virus stops transmitting.
Your analysis is flawed in that the so called COVID19 virus has never been isolated in any lab in the world (hence if you have not isolated it, you cannot reliably test for it); the PCR tests have been shown to produce as many as 90% false positives as a result of using a teensy fragment of the so called virus, which is common to a host of other known coronavirus’; Flu and similar respiratory illness and deaths have disappeared in the same time that so called covid has manifest (i.e. normal deadly flu virus has been relabeled as the novel coronavirus); and the final nail in the coffin is the jab is NOT a vaccine.
Jabs are not vaccines:
https://principia-scientific.com/covid-19-mrna-shots-are-legally-not-vaccines/
“While the Moderna and Pfizer mRNA shots are labeled as “vaccines,” and news agencies and health policy leaders call them that, the actual patents for Pfizer’s and Moderna’s injections more truthfully describe them as “gene therapy,” not vaccines.”
“According to the U.S. Centers for Disease Control and Prevention,1 a vaccine is “a product that stimulates a person’s immune system to produce immunity to a specific disease, protecting the person from that disease.” Immunity, in turn, is defined as “Protection from an infectious disease,” meaning that “If you are immune to a disease, you can be exposed to it without becoming infected.”
Neither Moderna nor Pfizer claim this to be the case for their COVID-19 “vaccines.” In fact, in their clinical trials, they specify that they will not even test for immunity.
Unlike real vaccines, which use an antigen of the disease you’re trying to prevent, the COVID-19 injections contain synthetic RNA fragments encapsulated in a nanolipid carrier compound, the sole purpose of which is to lessen clinical symptoms associated with the S-1 spike protein, not the actual virus.
They do not actually impart immunity or inhibit transmissibility of the disease. In other words, they are not designed to keep you from getting sick with SARS-CoV-2; they only are supposed to lessen your infection symptoms if or when you do get infected.”
So called Virus has not been isolated:
https://principia-scientific.com/statement-on-virus-isolation-sovi/
https://principia-scientific.com/lab-analysis-at-7-universities-proves-no-covid19-exists/
https://principia-scientific.com/laboratories-in-us-cant-find-covid-19-in-1500-positive-tests/
“A clinical scientist and immunologist-virologist at a southern California laboratory says he and colleagues from 7 universities are suing the CDC for massive fraud. The reason: not one of 1500 samples of people tested “positive” could find Covid-19. ALL people were simply found to have Influenza A, and to a lesser extent Influenza B. This is consistent with the previous findings of other scientists, which we have reported on several times.”
This finding shows why official records show influenza has virtually disappeared while the Covid hype occurred…. it’s a bait and switch scheme….
https://principia-scientific.com/nbc-nightly-news-admits-covid-19-doesnt-even-exist/
“Even NBC news now admits the virus does not exist. Undeniable scientific evidence is growing all over the world that there is no laboratory isolate of the pandemic virus we are told caused COVID19. The entire SARS-CoV-2 narrative has been spun from junk science, data fiddling and a conspiracy among vested interests.”
“The RT PCR test widely use to ‘test’ for COVID19 is not a diagnostic – it cannot diagnose and be a tool in the treatment of a disease. Which means every time Bloomberg, Gates Foundation and Zuckerberg foundation COVID-19 dashboard reports that there is a another case of COVID-19, because of a positive RT PCR test, they are violating the Federal Trade Commission Act.
You cannot diagnose a disease if you have no proven ‘gold standard’ of identification which comes from reproducing an isolation. The claims COVID-19 have been isolated are not backed by any validated laboratory testing. If anyone still claims it has, then it is a misrepresentation, a deceptive practice under the Federal Trade Commission Act.”
PCR test is not a diagnosis, has huge false positives:
https://principia-scientific.com/confirmed-pcr-tests-cannot-detect-sars-cov-2-cause-of-covid19/
https://principia-scientific.com/who-admits-high-cycle-pcr-tests-produce-covid-false-positives/
https://principia-scientific.com/pcr-test-inventor-denounces-their-use-for-disease-diagnosis/
https://principia-scientific.com/now-fda-admits-pcr-tests-give-false-covid-results/
Deaths not substantially different than normal flu seasons:
https://principia-scientific.com/why-we-must-question-the-covid-19-mortality-statistics/
https://principia-scientific.com/media-persists-promoting-fake-covid-19-mortality-numbers/
https://principia-scientific.com/study-covid-infection-fatality-rate-at-only-0-15-percent/
And finally, watch this very accredited and once revered doctor’s short video on the death rate shell game: (he’s been canceled from his speaking out)
https://vernoncoleman.org/videos/final-irrefutable-proof-covid-19-pandemic-never-existed
https://vernoncoleman.org/
He has many books, monograms, and videos which are to say the least very eye opening!
In short while the analysis of herd immunity etc is reasonable if the underlying data were reliable, it is fake/false data, hence the analysis is more like saying UFO sightings caused the recent weather front…..
Warning – do your own carefully informed consent before succumbing to the experimental gene therapy that is falsely labeled as a “vaccine” for Covid!
https://vernoncoleman.org/videos/syringe-full-death
Cliff, your approach has merit. You should refine it, and then further enlighten Watts… readers.
Readers should keep in mind that, prior to the Hubbell satellite, amateur astronomers made more discoveries in the cosmos than professionals. Cliff is the equivalent of a smart, amateur astronomer.
The timing issue you mentioned should be pursued.
The arithmetic used to estimate the % “immune” should be refined. More specifically, an allowance for the “twice immunized” should be deducted. Twice imunized means people vaccinated after being infected.
The following illustrates why an allowance is needed. Assume 30% of a state’s population had been infected with C19 before mass vaccinations began. Also assume 50% of the population has been vaccinated. Around 30% of those vaccinated had developed immunity via infection. Thus, the immunized total 30% + 50% x (1-.3) = 30% + 50%x.7 = 30% + 35% = 65%.
The 50% x (1-.3) is admittedly a rough adjustment. Cases can be made for a number greater than .3 and less than .3. Nevertheless, a rough adjustment is better than none at all.
Keep up the good work, Cliff.
The northern states in the US all seem to have suffered from an increase in April, similar to last year. Perhaps this implies a seasonality to the virus, that may be triggered by immune suppression due to allergies, and coincidently, reduction in white blood cell count for a while after vaccination, adding a little to infection numbers. Perhaps some more virulent strains have also arisen (more likely the further you are from herd immunity). So many factors! Perhaps masks also make it worse by increasing the aerosols expelled from the mask due to the high pressure air forced through the pores of the mask?
India is a warning of what happens from wishful thinking that herd immunity has arrived.
It is a warning of what can happen if we hope that covid-19 will just go away if we ignore it.
India funeral pyres