Guest Post by Willis Eschenbach
After my last post about the surface warming of the ocean, entitled “How Global Warming Isn’t“, I got to thinking about the warming of the upper part of the ocean. So I got the data for the ocean heat content (OHC) of the top 700 metres of the ocean from the marvelous site, KNMI. If you look under “Monthly Observations” you’ll find a host of most fascinating datasets. Under “Heat Content” on that page, you’ll find the National Oceanic Data Center (NODC) 0-700 metre depth OHC data. And down at the very bottom of that page is a link that will download a 196 megabyte gridded NetCDF file containing the data that I used. (Big file, click at your own risk.)
And what did I find? Well, I’m a visual kind of guy. I mean, I can do the math, but it only makes sense when it comes up as a picture on the silver screen. So here are my graphics. I’m interested in the changes in the oceanic heat content, so these are two views of those trends.


Figures 1 & 2. Decadal trends in oceanic heat content, in exajoules (1018 joules) per decade.
I love climate science because I’m continually surprised by what I find. What could be better? It’s like Christmas every day.
My first surprise? There’s a line of giant oceanic slow whirlpool-type eddies that I’ve seen before. They start at the southern tip of Africa and extend down under Australia. I knew about them because they’re visible in graphics of satellite sea-surface height data. But what I hadn’t realized is that these eddies are mixing warm surface water down into the depths. This is indicated by the orange/yellow line of increased undersea heat stretching from Africa under Australia.
And when you mix some warm surface water downwards, other cool deep water has to come upwards … as indicated by the corresponding line of areas just south of the eddies encircled by black/white lines, showing areas that have actually lost heat since 1955. Who knew? Certainly not me.
What else surprised me? The turbulence of the Gulf Stream as it interacts with the ocean floor topography along the East Coast of the US is also mixing warm surface water downwards … and the corresponding upwelling of cold subsurface water is occurring just south of Greenland.
I’ve long wondered how less-dense warmer water could mix downwards into denser cooler deeper waters … well, there are a couple of places where it is happening.
To close out, I took a look at the actual temperature change represented by those exajoules of energy changes. I mean, just how big is an exajoule when it’s at home? I’m sure I don’t know.
But like I said, I can do the math. So I converted the slow increase in exajoules of heat content into degrees Celsius of slow warming. Here’s that result:

Figure 3. Global ocean temperature change, surface to 700 metres depth from 1955 to 2020
A quarter of a degree in a half century?
Now I keep reading about how fish are changing their locations in response to oceanic warming. But it seems extremely doubtful to me because the changes have been so small. Over the last fifty years, the ocean has warmed by about 0.005°C per year … and call me crazy, but I’m just not believing that the fishies and other underwater denizens are so temperature-sensitive that a change of a quarter of a degree in half a century will make them leave their happy homes.
For one thing, in the open ocean, the vertical temperature change is often on the order of 1°C per 40 metres vertical or so. Here are some Argo float profiles of the top 200 metres.

Figure 4. Vertical temperature profiles of the North Pacific, Argo float data.
And that means that if a fishie or other subaquatic denizen goes up or down by ten metres or so, it’s already endured the dreaded quarter-degree temperature change …
Add to that the fact that many millions of oceanic fish, shrimp, and copepods migrate every night from 800-1000 metres depth up to around 100 metres depth, and then go back down at dawn … which means they happily endure 5° – 10° of temperature change every night. So I doubt greatly that they will be bothered by a quarter of a degree temperature change in a half-century.
And by tonnage, this daily vertical migration is the largest movement of living creatures on the planet … so we’re not talking about a few fish here and there.
This is the bottom line. If the world’s creatures, both on land and at sea, were as temperature-sensitive as the alarmists would have us believe, those beings (and we humanoids as well) all would have gone extinct long ago. And near as I can tell, that hasn’t occurred … at least yet.
My very best wishes to all living creatures, terrestrial and aquatic alike,
w.
As Always: I ask that when you comment you quote the exact words you are discussing, so we can all know both what and who you are responding to.
A Final Note: In addition to daily traversing the five degrees or more temperature range, it’s worth noting that when the millions of tonnes of aquatic creatures travel from 1000 metres to 100 metres depth and back down every night, they undergo a pH change of about half a pH unit.
In other words, every night they undergo a greater pH change than we’re expected to see in the ocean in the next century under IPCC assumptions. You know … the dreaded pH change that’s supposed to kill oceanic creatures by the millions. But instead, as Darwin is rumored to have mentioned once or twice, living creatures have evolved to … well … survive.
Willis, thank you another interesting post. You wrote:
“But like I said, I can do the math. So I converted the slow increase in exajoules of heat content into degrees Celsius of slow warming. “
My question is: didn’t they calculated the increased ocean heat from temperature data in the first place? I can’t think of another method of measuring these data.
Another question: do you agree that any warming must be either due to solar radiation or ocean mixing, since water doesn’t heat up by LW radiation? I assume that convective heat transfer by the atmoshere can’t explain these amounts of exajoules because the increased temperature difference would be far from be sufficient (or not?).
Arjan, yes, it was temperature to start with.
However, LW can assuredly leaves the ocean much warmer than it would be without the LW. See my post “Radiating The Ocean” for a full discussion.
w.
“Polar amplification is the phenomenon that any change in the net radiation balance (for example greenhouse intensification) tends to produce a larger change in temperature near the poles than the planetary average”:
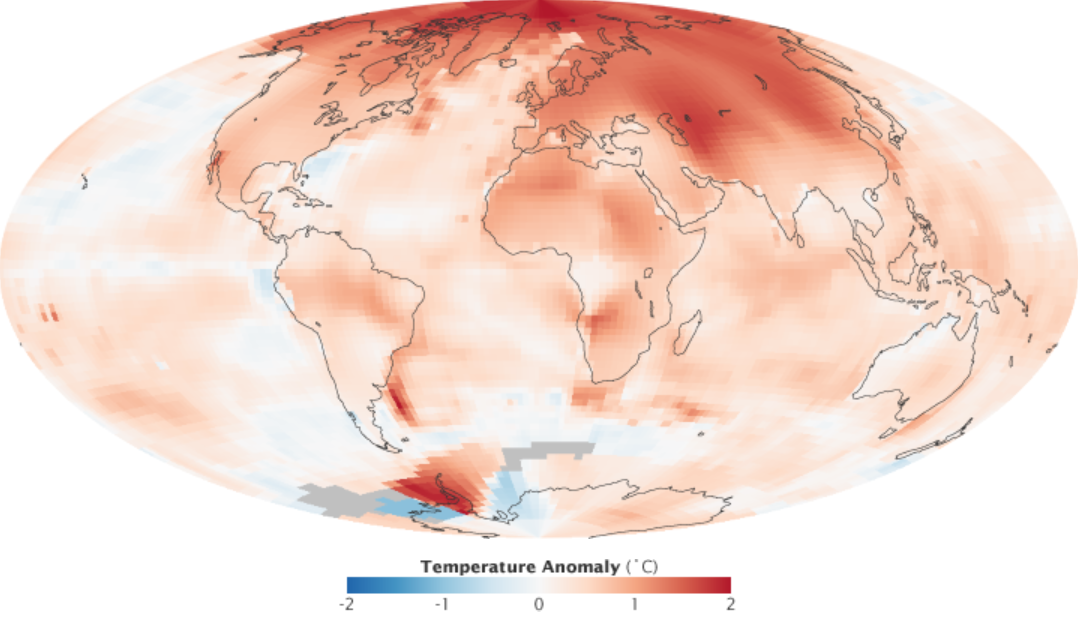
NASA GISS temperature trend 2000–2009, showing strong arctic amplification (Wiki).
Oddly the Argo circum-Arctic ocean surface temperature data shows no trend from 2004 and in fact has been cooling to ~1400 m depth.
http://www.climate4you.com/images/ArgoCircumArcticSince200401%2055N-65N.gif
UAH Arctic shows GISS is a FAKE.. as always..
Only Arctic warming this century was at the 2015 El Nino Big Blob, all but gone
.
The turtle people at Stanford Woods Institute for the Environment
https://news.stanford.edu/press-releases/2021/04/08/illuminating-sea-turtle-mystery/
claim, via a press release, that “As the planet undergoes unprecedented climate changes, locations once considered impassable obstacles to species movements, like the Eastern Pacific Barrier, are being redefined. This, in turn, is shifting the distributions and migratory pathways of creatures ranging from sea birds to white sharks and presenting new conservation challenges.” One of the authors gave a nice interview on today’s CBC Quirks & Quarks, and the host is always glad to bring climate change into the equation. I was about to send her the link to Willis’ article, but decided not to. My experience with biologists who invoke future climate change is not positive. It seems most of them do not even think of the record of even relatively recent climate change.
NATURE article 2009:
Jellyfish help mix the world’s oceans. Marine creatures could stir up seas as much as do winds and tides.
“If swimming animals do affect ocean mixing substantially, climate modellers will face “a forbidding challenge”, says physical oceanographer Carl Wunsch of the Massachusetts Institute of Technology in Cambridge.” https://www.nature.com/news/2009/090729/full/news.2009.745.html
Surprisingly no one talks about the several ten-thousands of merchant ships navigation the sea daily and their impact on global warming since they move as motor ships with screws. The upper sea surface layer down to 20 meter is the most crucial part in the sea-atmosphere relation.
1 in china diversion cost us and world how many lives ?.
The Warmistas shout out the variation/increase of some miniscule, not diorectly measurable amount, of temperatures when the daily and yearly changes are orders of magnitude greater.
I could have sworn the alarmists told us that global warming would cause the Gulf Stream to shut down by now. 😉
Quote: ‘If the world’s creatures, both on land and at sea, were as temperature-sensitive as the alarmists would have us believe, those beings (and we humanoids as well) all would have gone extinct long ago.”
I’m no scientist but just follow fish-trawling vessels. If they operate in the same international waters and other spots, year after year, it’s because there are lots of fish in those areas that haven’t migrated.
Just as with your home, if there are too many people living in it, some leave and migrate elsewhere and even adapt to other areas. I figure it’s the same with all living creatures on this planet.
“I’ve long wondered how less-dense warmer water could mix downwards into denser cooler deeper waters”
Are you sure it is less dense? Salinity counts as well as temperature.
Water gets less saline away from the tropics, and if the Gulf stream wanders into less saline waters, warm water can sink.
So, a constant supply of cold, fresh water from the poles getting mixed in with old, evaporation-experienced water, less well as we go equatorwise, with
near totalgood deal of stagnation between the two longest landmasses.And then there are the little hotspots along most every coast. Harbour sensors? Something clogging the ones on/near the beach?
If this kind of measurement is to go by, no wonder they have to adjust so many of their other measurements, which hubris would eventually turn into measurements to fit the narrative.
Nick, I am pretty sure that the common range of salt concentration (outside a few places like the Mediterranean and the Red Sea) is not enough to overcome more than the density difference due to a change of a few degrees temperature. The deep convection areas in the north Atlantic (where the Gulf Stream goes to die) are very cold and dense, and the convection is very deep.
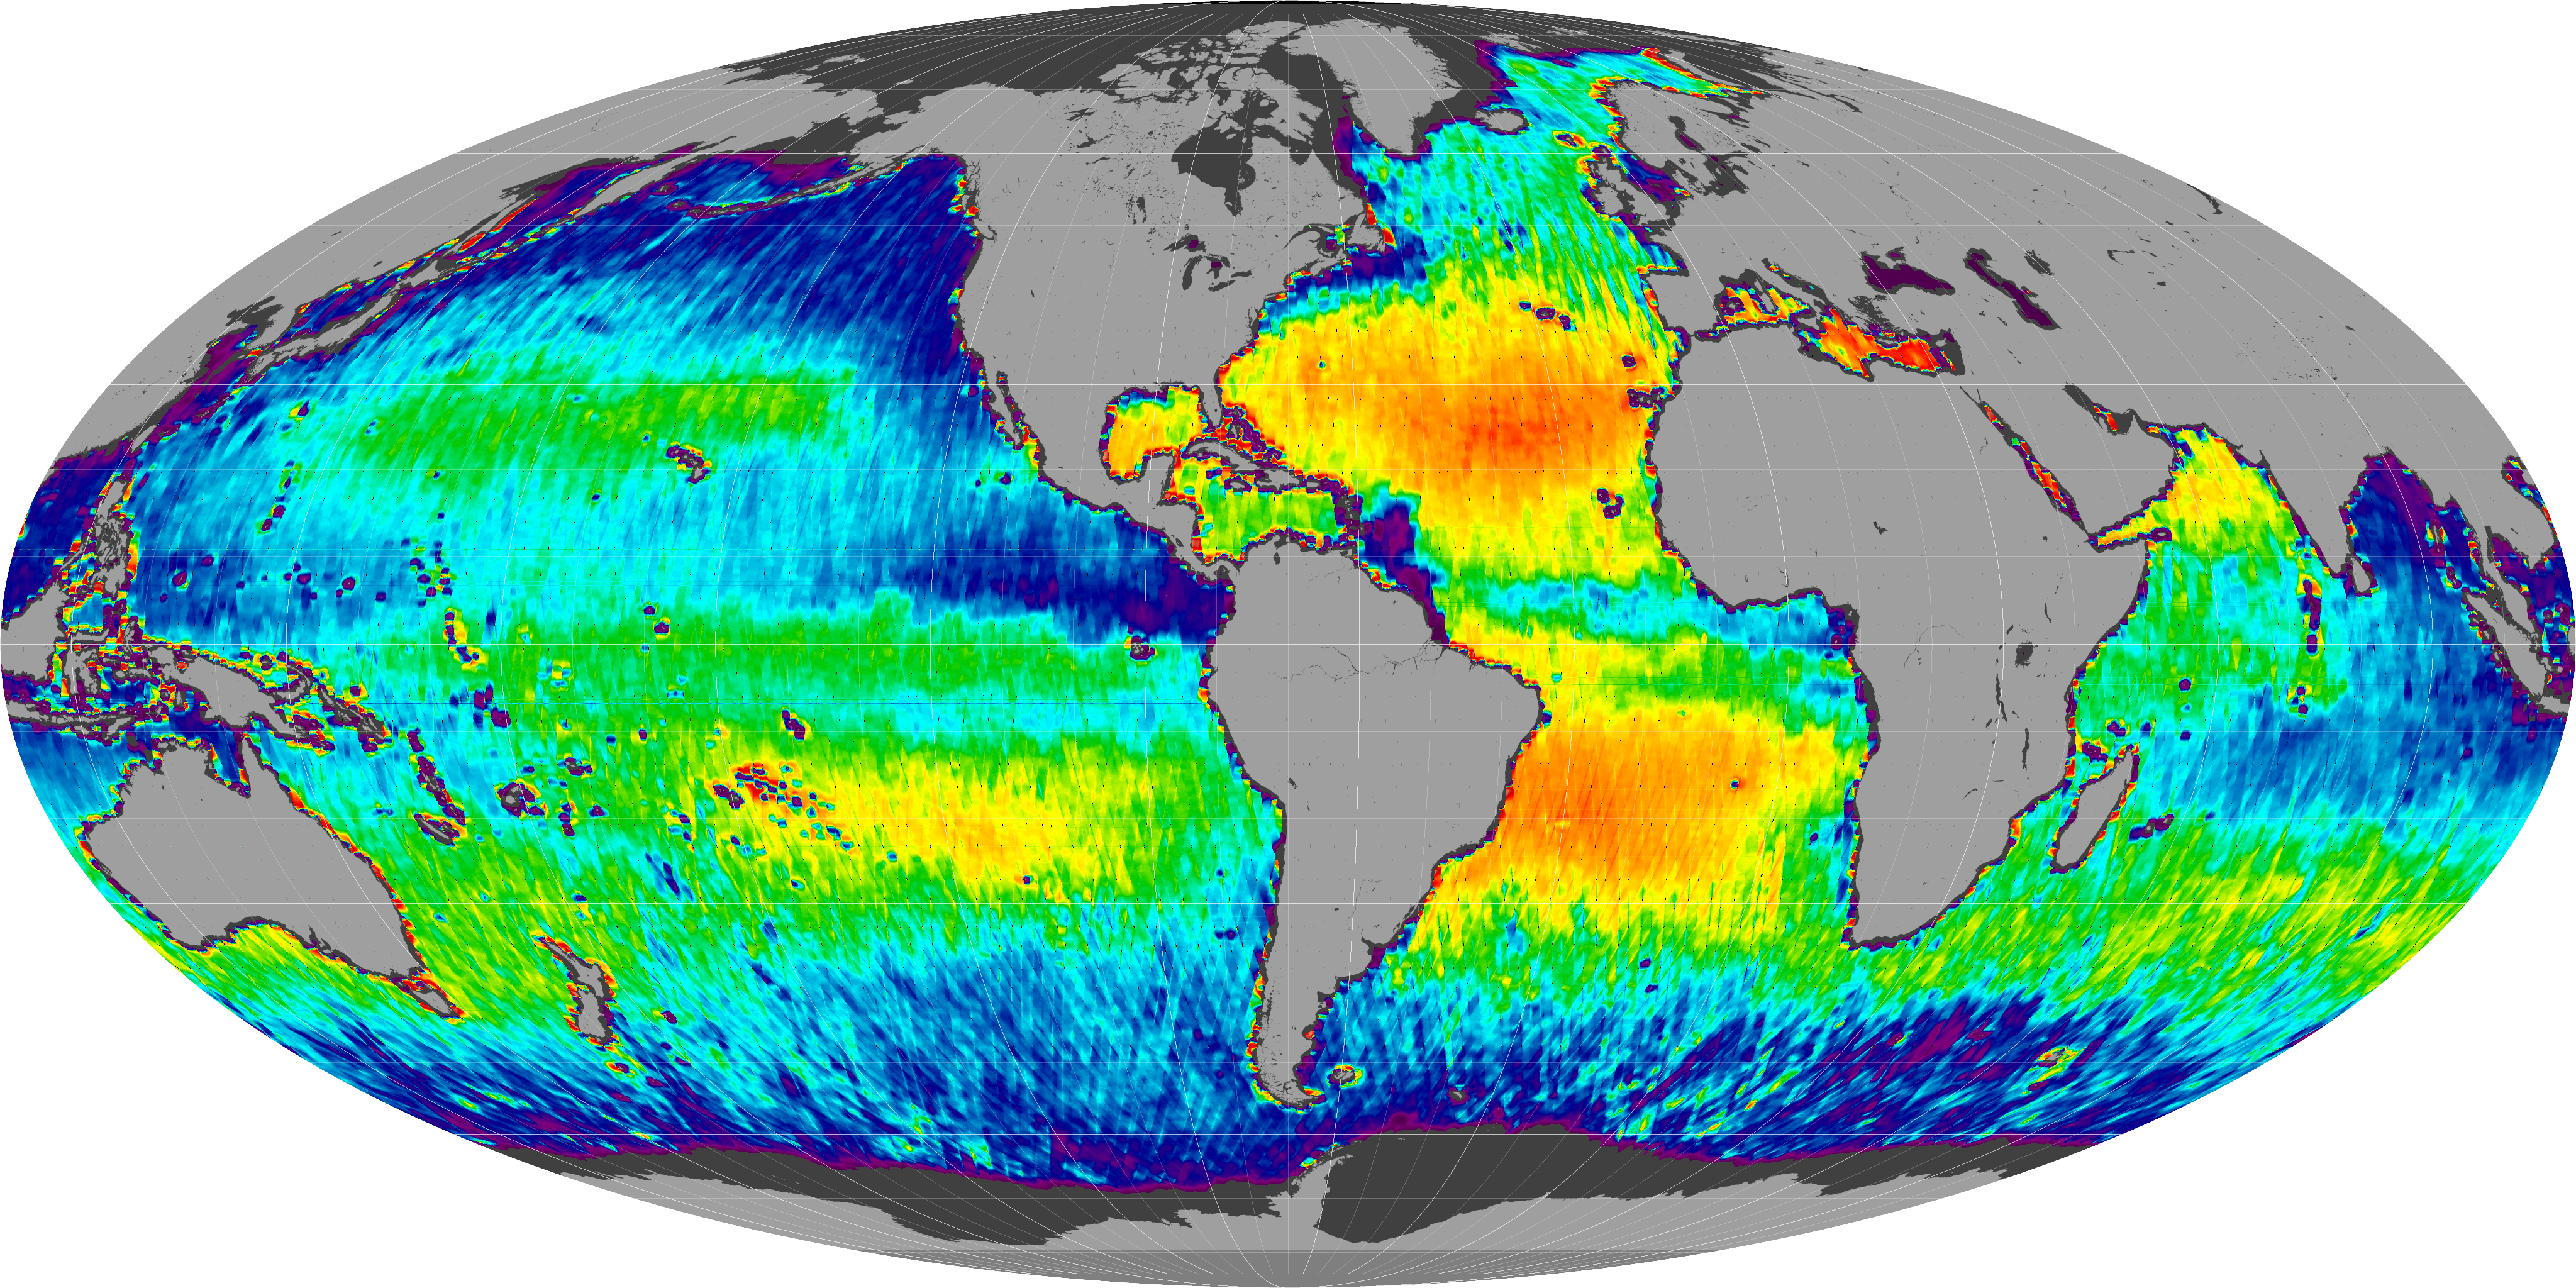
Your nicely colored map mostly shows where it rains a lot and were it doesn’t. Look at the West Pacific warm pool area… it has low salinity and high temperature, because there is a lot of rain. Those bright orange/red areas are NOT where salty surface water is sinking to great depth; the salty water is floating on top of much colder (and denser) deep water. Where the salt concentration is high is where there is a lot more evaporation than rain.
Alarmist and common sense are incompatable!
Willis,
Relatedly, I am studying a publication by 15 authors from the Australian Academy of Science, a veritable Cinemascope wide screen polychromatic production with 450 references.
https://www.science.org.au/supporting-science/science-policy-and-analysis/reports-and-publications/risks-australia-three-degrees-c-warmer-world
A repeated theme is that a warming globe will generate heat waves that are hotter, longer and more frequent than before. This includes marine heat waves. Here is the abstract of one reference by Oliver at el that they list to support this presumption:
“Marine heatwaves are important events in oceanic systems that can have devastating consequences for ecosystems, causing ecological changes and socioeconomic losses. Prominent marine heatwaves have occurred recently and attracted scientific and public interest, but comprehensive assessments of how these events have been changing globally is missing. Using daily satellite observations, daily in situ measurements, and gridded monthly in situ-based sea surface temperatures we identify significant increases in marine heatwaves over the past century. We further estimate future changes in marine heatwaves to the end of the 21st century, as simulated by CMIP5 global climate model projections. We find that from 1925 to 2016, global averages of marine heatwave frequency and duration have increased by 34% and 17%, respectively, resulting in a 54% increase in annual marine heatwave days. Importantly, these trends can largely be explained by the increase in mean ocean temperatures, rather than a change in variability. Future projections show significant, and accelerating, increases in MHWs properties into the 21st century with many parts of the ocean reaching a near-permanent MHW state by the late 21st century, regardless of emissions scenario considered (RCP4.5, 8.5). Comparison with simulations of a natural world, without anthropogenic forcing, indicate that these trends have emerged from the range of natural variability within the first two decades of the 21st century. This implies that the climate system has departed significantly from natural marine heatwave conditions under which ecosystems evolved, and therefore impacts on marine ecosystems can be expected to be widespread, significant and persistent.”
https://agu.confex.com/agu/osm20/meetingapp.cgi/Paper/650732
Willis, when I compare your article to this pair of papers, there is so much conflict of concepts and interpretations that I hardly know where to start. I can imagine that it I make a public criticism of this AAS paper, I will be told to shut up and read the cited literature, as if there is no more argument to be had.
I suspect that you have found yourself in a similar position at least once before now, so I will simply throw this material into the pot and say that you are a strong person to keep blogging as you do.
Geoff S
And we have just recently heard about “mega-plumes” that can cause transient heating of surface waters. Warm blobs?
Geoff,
Presumably this is all modelling and nobody was actually measuring annual marine heatwave frequency, duration and days back in 1925…..
Another question to consider: “What contribution to heat exchange (mixing) does the daily vertical biological migration make?” They bring their warm bodies down into colder water every day!
Clyde, if I understand my radiative climastrology correctly, it works like this: When those fishies rise from the ice cold depths, they cool the top layer of water, which means it cannot radiate heat, so it traps all the heat down on the bottom of the sea, causing the little tube worms to complain about itchy sweaters.
Hey, if it’s true for clouds, it must be true for all other fluids!
Further to marine heat waves, here is a projection graph from Oliver et al cited above.
It does not look plausible to me.
Geoff S
http://www.geoffstuff.com/marine_heat_oliver.jpg
That was THE most beautiful hockeyschtick I’ve ever seen. Boomerang? Phantasmagorical dramweave of a witch’s broom taking off? Like Granny Weatherwax, she had to take a long, straight run over somewhat lumpy ground, and then, next month sometime?? the entire thing suddenly shoots up into the far heavens.
But that one has also lapsed a bit, eh what, looks about 2005/9-ish? “Dread by 2015!!!” the caption probably said.
Willis, my understanding of mankind-created global warming is that the increase in heat in the oceans will have come from the atmosphere. The atmosphere has a mass of about 5E+18 kg. Assuming a specific heat capacity of about 1 and an increase in temperature of about 0.5degC since 1950 (up until 2013, IPCC AR5), the atmosphere has increased its total heat by about 2.5E+18kJ or 2.5E+21J. So there is enough extra heat in the atmosphere to cause the ocean warming you describe, if that is the cause and mechanism. Is this your understanding?
I have to ask the question.
Is this data “Raw” or manipulated in any way?
Well, it’s kinda complex, but basically the answer is “raw”.
w.
Climate is always changing and this includes ocean temperatures.
Ocean temperatures have varied substantially over the Holocene
doi:10.1016/j.yqres.2004.07.001 (caltech.edu)
Deglacial to Holocene Ocean Temperatures in the Humboldt Current System as Indicated by Alkenone Paleothermometry (wiley.com)
Microsoft Word – Thornalley_article (ucl.ac.uk)
Any attempt to describe current changes as alarming and human caused must distinguish such changes from continual natural warming and cooling.
It surprises me that you assume all ocean heat comes from the sun and that you ignore subsea volcanism and the huge contribution it can make to ocean temperature; as an example have a look at: Energy Unleashed by Volcanic Eruptions Deep in Our Oceans Could Power All of the United States (scitechdaily.com) . Maybe the mysterious “downwelling” of warmer water, is actually a manifestation of upwelling from the ocean floor.
Case, good question. Here’s the math.
The US uses about a hundred quads (quadrillion BTU, 10^15 BTU) of primary energy per year. This is about 29 petawatthours (PWh, 10^15 watthours) per year.
To convert this to ocean floor heating, we need to first divide by 8,760 hours per year. This gives a constant energy flux of 3.3 terawatts (TW, 10^12 watts).
Then we divide that energy flux by the total ocean area in square metres, which is 3.7E+14 square metres. This give us the final figure of 0.01 watts per square metre (W/m^2) of heat coming up from the ocean floor.
Since this is trivially small compared to radiative surface heating of ~160 W/m2 solar + ~340 W/m2 downwelling longwave infrared ≈ half a kilowatt per square metre, it’s ignored in all but the most detailed analyses.
My best to you,
w.
Willis
That approach provides an average for all the oceans, and is appropriate for generic geothermal heating arising from primordial heat in the core. Your figures 1 & 2 show hot and cold spots. To be comparable, you should probably divide by an estimate of the areas of spreading centers (and active seamounts), where the mega-plumes occur, and tag it “potential local heating from transient volcanic events.”
Thanks, Clyde. Scale is still the problem. Let’s say, for example, that spreading centers and seamounts are 5% of the ocean floor. Seems doubtful it’s that much, but OK. If there were zero heat coming from anywhere else on the floor, those areas would be putting out 20 times my calculations above … which is still a pathetic 0.2 W/m2. Lost in the noise.
w.
Willis
Recently, there was an article about NASA claiming that 0.5W/m^2 over a 15-year period was throwing the energy budget off balance.
https://wattsupwiththat.com/2021/03/25/claim-direct-observations-confirm-that-humans-are-throwing-earths-energy-budget-off-balance/
By comparison, 0.2 W/m^2 per year is the same order of magnitude as the 15-year period, or about an order of magnitude greater than the forcing that had NASA in a dither.
what we can see is the minimum around 1970 , but we cannot see the data before 1955 , because they didn’t exist before ! That’s the problem with the climate models , they are half blind !!!
Interesting. I think you found more evidence for your “Emergent” temperature regulation hypothesis.
If you derive the heat capacity of the oceans to 700 m depth vs the heat capacity of the entire atmosphere, the difference is roughly 293 times.
That is the oceans to 700 m depth have 293 times more heat capacity as the entire atmosphere.
So if an increase of (x) exojoules have been observed in the top 700 m of the oceans, and that is a 0.25 deg C rise in that water temperature, then either:
a) the air temperature should have risen by 293 x 0.25C or 73.4 C; OR
b) the emergent temperature regulation systems of the atmosphere simply ramp up the dissipation of that extra energy as per your hypothesis.
Or is my view too simplistic?
How does CO2 warm water that 13 to 18 micron LWIR can’t reach? The only mechanism CO2 has to affect climate change is through the absorption and radiation of 13 to 18 micron LWIR, and those wavelengths don’t penetrate the oceans, yet it is the ocean 50 m depth that is warming. That is due to visible radiation, not IR.
This is important in regards to Mr Eschenbach’s response to Case Smit.
How does 340W/m2 of LWIR warm below a couple of mms let alone to a depth of 700M?
AC, see my post Radiating The Ocean.
w.
“And that means that if a fishie or other subaquatic denizen goes up or down by ten metres or so, it’s already endured the dreaded quarter-degree temperature change”
Interestingly, this is consistent with the observed depth changes from one indicator of marine species movement:
https://www.epa.gov/climate-indicators/climate-change-indicators-marine-species-distribution shows that a select group of species have moved about 10 meters deeper on average over that time period.
[fixed typo in email-mod]
Excellent again, Dr Eschenbach
Re; “I keep reading about how fish are changing their locations in response to oceanic warming” do these alarmists even consider the possible effects of overfishing and fish stock depletion on their findings?
I’d be much more inclined to worry about fish stock depletion than global warming.
There does seem to be more pronounced sea surface warming along the east coast of the United States, from about Florida to Virginia. Could this result in more hurricanes hitting this area in summer, and more evaporation to feed nor’easters in winter?
Awesome work 👍 I actually learned something today!
“There’s a line of giant oceanic slow whirlpool-type eddies that I’ve seen before. They start at the southern tip of Africa and extend down under Australia.” That deserves an article of its own! I can see how there would be a line of cold water in the sea where the cold is being churned upwards in the surrounding background temp water, but why the warmer line? Why a line at all?