
For the first time, scientists have used artificial intelligence not only to predict sunspots but also to correct the incomplete record of past sunspot activity.
A new paper just published in Advances in Space Research by Dr Victor Velasco Herrera, a theoretical physicist at the National Autonomous University of Mexico, Dr Willie Soon, an award-winning solar astrophysicist at the Harvard-Smithsonian Center for Astrophysics, and Professor David Legates, a climatologist at the University of Delaware and former director of the U.S. Global Change Research Program, predicts that the new 11-year solar cycle that has recently begun will show near-record low sunspot activity that will last until mid-century.
Both Dr Soon (in 2004) and Dr Velasco Herrera (in 2008) had previously published papers speculating that the first half of the 21st century would be a period of unusually few sunspots, potentially slowing the rate of global warming
Sunspots matter. When there are many sunspots and the Sun is active, there is a danger that a strong solar ejection directed towards the Earth could damage or even destroy the thousands of satellites on which the world depends for everything from radio, telephone, television and internet communications to monitoring the climate and observing the farthest reaches of the universe.
Worse, a really strong solar storm could damage the largely unshielded terrestrial electricity grid. Most power lines and transformers are above ground and thus acutely vulnerable. Solar panels, too, could have their lives shortened by intense solar radiation.
The three scientists taught a machine-learning algorithm how to recognize underlying patterns and cycles in the past 320 years’ sunspot record. The algorithm then discovered a hitherto-unnoticed interaction between the 5.5-year solar half-cycles (blue) and the 120-year Gleissberg double cycles (red dotted lines) which allowed it to confirm the earlier predictions of a quiet half-century to come – predictions which are now shared by solar physicists.
That interaction between the two periodicities led the algorithm to indicate that from the 1730s to the 1760s, early in the modern sunspot record (the gray band below), sunspots appear to have been under-recorded: as the 120-year cycle approached its maximum amplitude, sunspots should have been more numerous than reported at the time.

The algorithm then predicted the sunspots from 2021 to 2100. It suggests that the current low solar activity is likely to continue until 2050:

Dr Velasco Herrera said: “Not everyone agrees with our expectation that solar activity will continue to be low for another three solar cycles. A paper in Solar Physics by Dr Scott McIntosh of the U.S. National Center for Atmospheric Research, says the coming solar cycle will be unusually active, with a peak sunspot number of 233, compared with our estimate of less than 100. Place your bets in the Battle of the Solar Cycles!”
Dr Soon said, “The machine-learning algorithm, with its interesting interplay between the very short 5.5-year cycle and the long 120-year cycle, confirms our results of 10-15 years ago suggesting that the next three or four solar cycles will be comparatively inactive. This is the first time that the twin problems of hindcasting incomplete past records and forecasting the future have been combined in a single analysis.”
Dr Legates said: “President Trump realized the importance of space weather, and particularly of the Sun, in influencing global climate. It was he who signed the October 2020 ProSwift Act into law to assist in studying and forecasting space weather. Given the history of previous periods of comparative solar activity, the weather may get a little cooler between now and 2050. If we are right, our electricity grids and our satellites should be safe until then.”
Interested readers may download the paper for free from the journal before June 6
https://authors.elsevier.com/a/1cwLK%7E6OilW7X
However, the sword has two edges. The other: increased exposure to cosmic radiation for pilots and air travelers.
Note that what this article terms “Artificial Intelligence” is more accurately termed – in the words of Patrick Winston, founder of the MIT AI Lab – “computational Statistics”.
This application is AI only in the sense that the pattern recognition algorithm is in the class of algorithms that use computational heuristics (aka short cuts) to approximate a full Bayesian classifier. Learning a full joint probability distribution from data is computationally intractable in the number of features. (doing inference using a full JPD is also intractable – NP Complete – but does not need to be re-learned every time and in practice can be run overnight).
There are standard methods to estimate the possible error in the posterior distribution (the PDF of the target feature after incorporating evidence). But scientists who are not deeply experienced in the computational methods rarely have the competance to do such a calculation.
Bottom line: nothing new here, possibly excepting that data was substituted for expert knowledge.
Despite my respect for my friends Dr. Soon and Dr. Legates, I have some issues with this study.
First, I’m always concerned about the use of AI. The issue is not the results, which are sometimes spectacular. It’s that in general, how the AI got the results is totally opaque … meaning that we have no way to verify if it is AI or it is actually AS (Artificial Stupidity).
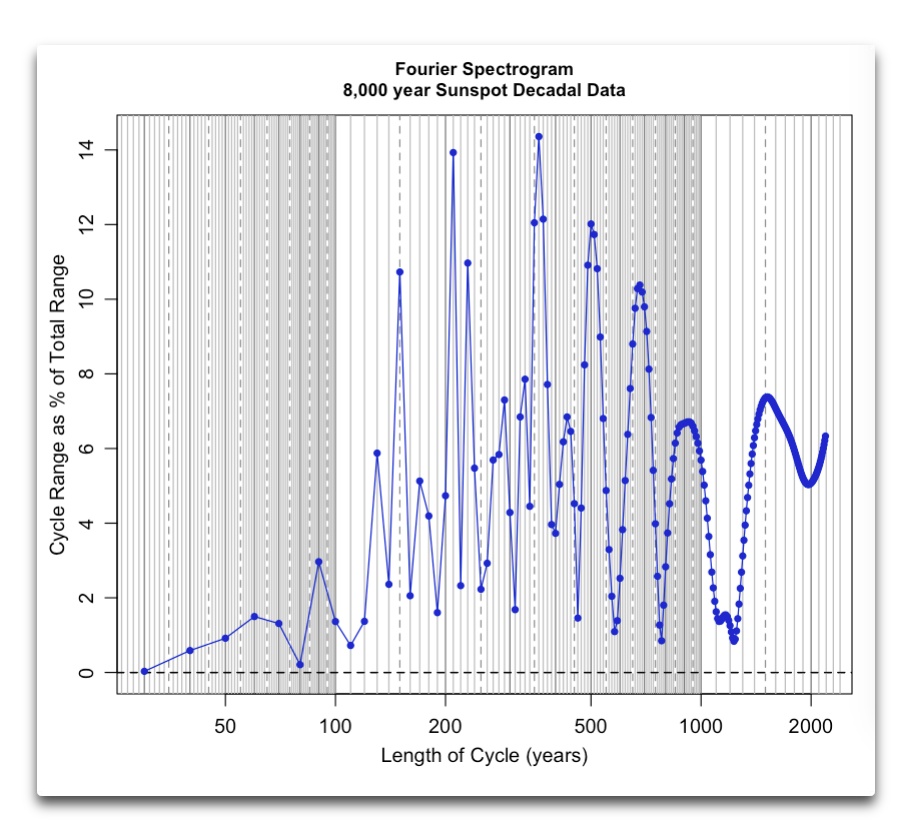
Second, we have annual sunspot data from 1700 to 2020, a total of 321 years. In my opinion, diagnosing a putative cycle that is 120 years, 40% of the length of the dataset, is … well, let me call it “wildly optimistic”.
The problem is what I call “pseudocycles”. These are variations that look like regular cycles, but instead they appear and disappear without warning. My rule of thumb is that you need at least three complete cycles to make a tentative claim that a real cycle exists, and even then you can get fooled. I once analyzed a sea-level dataset that appeared to have a connection to no less than five sunspot cycles … but once I looked at the full dataset, there was no sign of the connection before or after the five apparent cycles.
Third, a CEEMD analysis shows no sign of a putative 120-year “Gleissberg Cycle”. I’ve never believed in the actual existence of this cycle, in part because various researchers have strongly declared that it has a certain length … but the length has varied in each study:
Note they make the same point I make above, that 300+ years of data is too short to diagnose an ~100-year cycle.
The study discussed in the head post purports to find a 120-year cycle …
In any case, here’s the CEEMD analysis:
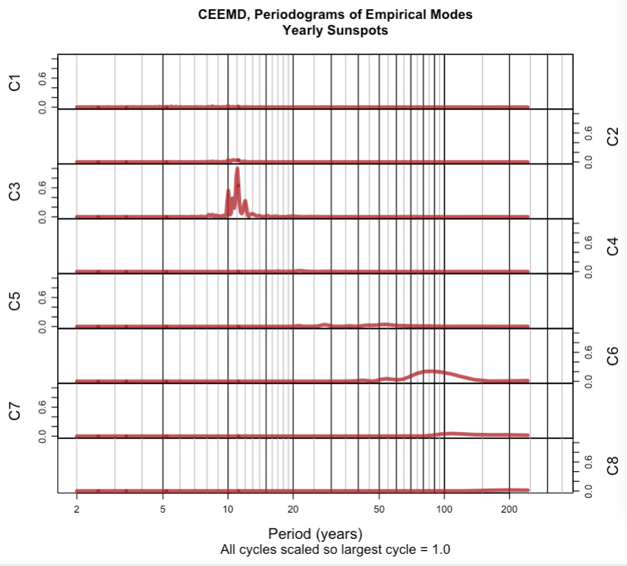
As you can see, there’s almost no power in the 120-year range. There is a very broad peak around 90 years or so (Empirical Mode 6) … but the width of the peak indicates it’s not any kind of solid cycle. And indeed, when we plot up that Empirical Mode 6, here’s what we find:
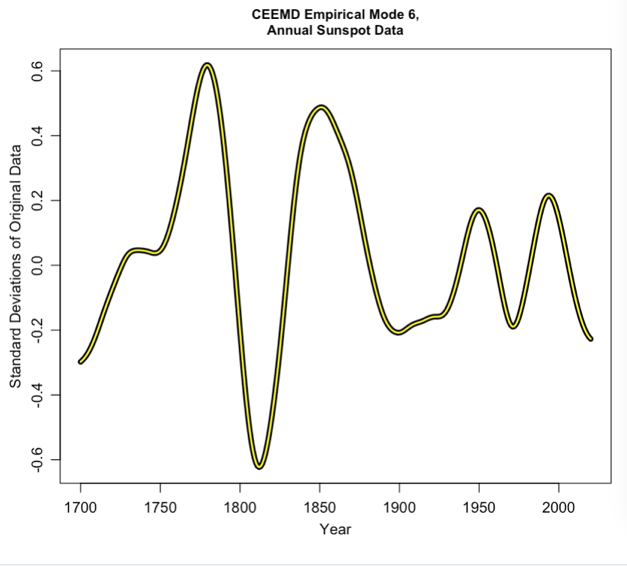
Remember how I said that “pseudocycles” appear and disappear? It looks like there’s a strong ~ 90-year cycle in the early part of the record … but it fades away entirely.
So … those are my objections to the study.
My very best regards to Drs. Soon and Legates, and to everyone,
w.
PS—For further discussion of these issues, see my posts The Tip Of The Gleissberg and The Effect Of Gleissberg’s Secular Smoothing.
I see two problems with the AI claim:
1) AI is just glorified curve fitting with no physics involved. And further mystified by the use of ‘hidden layers’.
2) The assumption that there are ‘cycles’ running on for centuries [millennia?]. The record is too short to demonstrate that, and there is no explanation of where the ‘memory’ of such cycles is stored.
Even if the ‘prediction’ turns out ‘right’ there are at least 20 registered ‘predictions’ of lower activity for SC25, see slide 25 of https://leif.org/research/How-to-Predict-SC-25.pdf so most will be right for the wrong reasons.
Thanks, Leif, your opinion on matters solar is always greatly appreciated.
For those who don’t know of Leif, he’s the man behind one of my many rules of thumb. This one is:
“Be very cautious when disagreeing with someone who has an effect in the field under discussion named after them.”
In this case, see the “Svalgaard-Mansurov effect” …
w.
<blockquote>1) AI is just glorified curve fitting with no physics involved. And further mystified by the use of ‘hidden layers’.</blockquote>
At 80+ I’ve been getting to grips with machine learning or ‘AI’ (which is just a mystifying title!) and I am not expert in the subject. However, as I see it, the “hidden layers” are not really hidden, per se, and each has a function associated with it which modifies input to the element before it is passed on as output. This function, as far as I can see, might contain physical relationships. So, in my opinion, physics can be involved—I’m working on understanding that. As far as I can tell it appears to be a modern development of Richard Bellman’s concept of dynamic programming from the 60’s and 70’s. I used that method successfully in complex process control systems. I see no reason why AI can not be used similarly.
Not all AI methods use neural networks. Some use the CEEMD techniques Willis talks about.
There are a couple of points which might be confusing. In AI terms a “model” refers to an implementation of one of the methods used in the technique—which might be a neural network. It doesn’t refer to a GCM model. The other is that a particular implementation of an AI solution might involve processing many different models on the same data searching for most accurate result from the training data. Which is why AI approaches tend to be computing resources hungry. Still it is surprising what can be achieved on a laptop! Haven’t tried it on my iPad. Yet!
Agreed, would you prefer a 9000 year “multimessenger” record ??
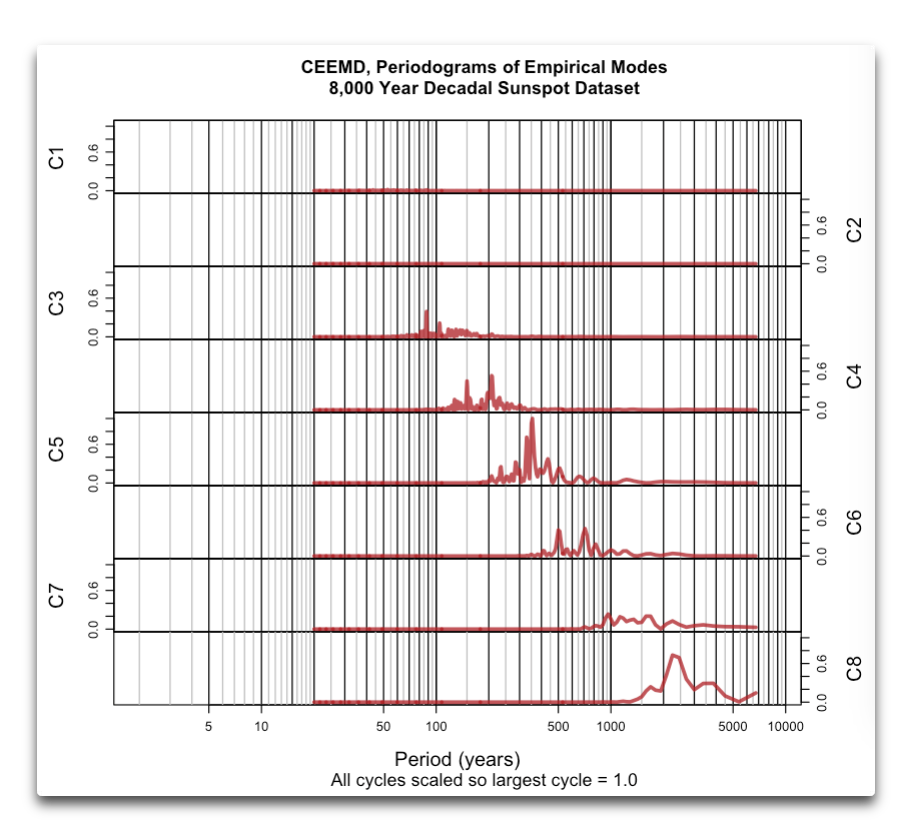
This power spectrum from the auto-correlation fn shows peaks at 114y and 67y .
The data is 10y resolution so the alleged 5.5y modulation is not detectable.
Correction periods marked are 87.6, 150y also 67y
Greg, I took a look at that dataset. The problem with it is that it’s calculated at 10-year intervals. That means that we get a spurious frequency at 10 years times the 11+ years of the sunspot cycle … which is the 114 year frequency shown in the spectral power density graph above.
In addition, what I find is that there isn’t much in the way of clear longer-term cycles.
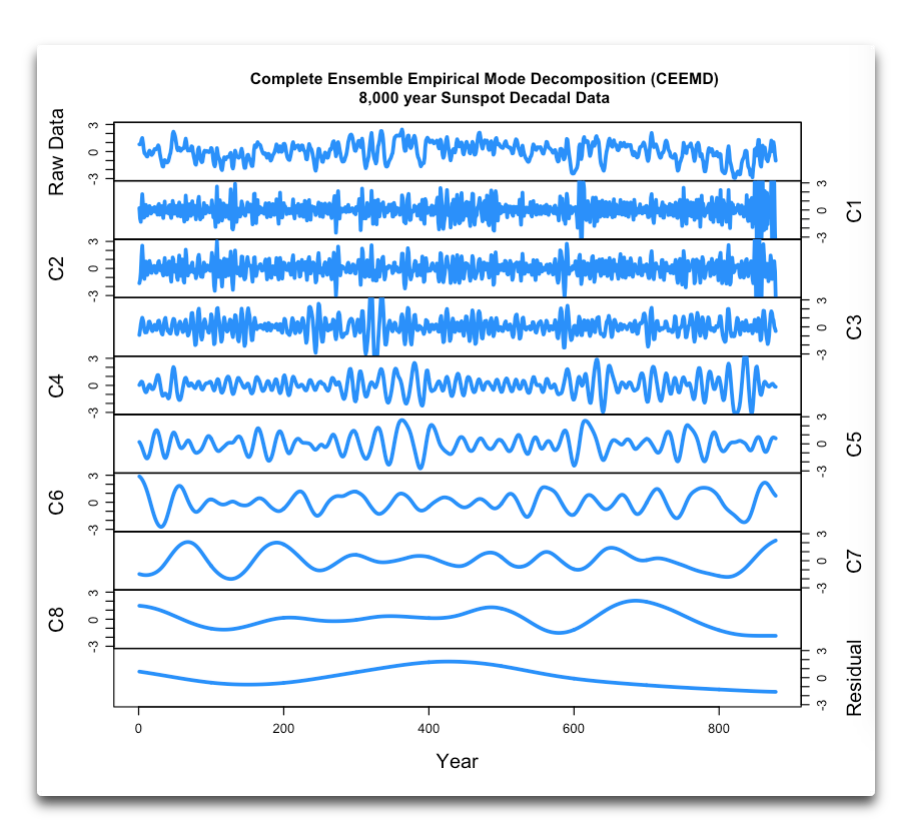
This shows the advantage of CEEMD over Fourier analyses. You can actually see the cycles in question. In this case, as in many cases, they fade into and out of existence, with nothing solid like the 11-year sunspot cycle.
w.
The accurate Solar Cycle-sunspot number observational record of ~400 years is far too short to properly train an AI on the pseudo-chaotic flaring behavior of a 4.6 billion year star. The proxy reconstructions (10Be, etc) going back thousands of years can give us a general picture, but the low resolution doesn’t tell us much about details of a cycle or two on extremes. Additionally, 10Be can be significantly affected by solar energetic particle (SEP) fluxes, further “muddying” the major flaring frequency and confidence in that resolution.
https://www.swsc-journal.org/articles/swsc/full_html/2018/01/swsc170075/swsc170075.html
As more large data set continue to grow from stellar surveys on G-class stars, the one thing that is becoming clear — our Sun is a well-behaved G-class star with limited to no-super energetic flaring (energy > 10^33 erg) like what seems more common. G-class stars have surface temps of 5,200 K to 6,000 K, and our G2V class Sun is teff = 5,772 K.
By common, I mean superflares every few millennia or shorter, producing a major flare that would fry our pretty blue ball. Our Sun doesn’t seem to do that, evidence: we’re still here.
An important discussion on superflaring frequency can be found in Wikipedia on the subject of Superflares and G-class stars observed so far:
https://en.wikipedia.org/wiki/Superflare#G-type_stars
Age, rotation rate, specific surface temp above or below a teff = 5600K, and metallicity are all apparently important factors in categorizing frequency of superflares statistical distribution. Cooler G-class stars actually appear in the Kepler data to have more superflaring frequency than those above 5600K, like our own Sun (at teff = 5772 K).
The role of orbiting exo-planets, like close, hot gas-giants is still unknown, just as our own gas-giants role in the Sun’s 11-yr magnetic cycle is still a matter of much debate, even where we have 400 years of data, and 66 million years of biological evolution since the last great biosphere extinction event (from a bolide impactor).
So training an AI it is absolutely critical that the learning algorithms get “truthful” data if one is to expect anything that is not garbage on the output. And we simply do not have a long enough, high resolution record to understand the frequency and magnitude of large solar flares (energy > 10^32 erg), especially during periods of low SC-magnetic activity. Train an AI on a combination of truth and some amount of unknowable “lies”, in other words, and it will lie to you on the output. Guaranteed.
OK. The sun might as well have a sign on it… That flashes ….Danger! Danger! Danger!
30 years of stupid pointless discussions about atmospheric CO2 levels and planetary temperature.
Super large, Earth affecting weird solar events are coming.
As solar cycle 24 progressed, it is an observational fact, tha the large long-lasting sunspot in sunspot groups that have an average group lifetime of 22 days (in all of the other solar cycles which humans observed) have been replaced by a sunspot group of tiny sunspot ‘pores’ that has a lifetime of less than 10 days.
Why is it there are no real scientific presentation about this in your face solar crisis.
The following papers are few of the dozens of papers that find that solar cycle 24 is anomalous ….
Based on current detailed solar observations and astronomical observations of other solar like stars,…
The conclusion is based on observations of other stars, the sun is changing and will no longer produces an 11 year sunspot cycle.
What we did not find out is these stars (which do not have a solar magnetic cycle) about every 3000 years of so….
Get a very a single super, super, large sunspot, on their surface) which has a lifetime of about a year. The super, super large single sunspot on these stars ejects stuff which we assume is a normal sunspot flare. These flare like ejections are roughly 10 to a million times larger than solar flares that have been observed.
Are the sunspots really vanishing?
Anomalies in solar cycle 23 and implications for long-term models and proxies
Conclusions: Our results and interpretation show the necessity to look backwards in time, more than 80 years ago. Indeed, the Sun seems to be actually returning to a past and hardly explored activity regime ending before the 1955–1995 Grand Maximum, which probably biased our current space-age view of solar activity.
https://www.swsc-journal.org/articles/swsc/full_html/2012/01/swsc120019/swsc120019.html
The Sun in transition? Persistence of near-surface structural changes through Cycle 24
….. we confirm earlier findings that there appears to have been a change in the frequency response to activity during solar cycle 23, and the low frequency shifts are less correlated with activity in the last two cycles than they were in Cycle 22.
At the same time, the more recent cycles show a slight increase in their sensitivity to activity levels at medium and higher frequencies, perhaps because a greater proportion of activity is composed of weaker or more ephemeral regions.
This lends weight to the speculation that a fundamental change in the nature of the solar dynamo may be in progress.
https://arxiv.org/abs/1705.09099v1
“The Maunder minimum may represent one manifestation of the Sun beginning to enter this flat-activity phase.”
https://iopscience.iop.org/article/10.3847/2041-8205/826/1/L2/pdf
STELLAR EVIDENCE THAT THE SOLAR DYNAMO MAY BE IN TRANSITION
The source of disagreement between the age scales from asteroseismology and gyrochronology came into focus after scrutinized Kepler targets with precise ages from detailed modeling.
They confirmed the existence of a population of field stars rotating more quickly than expected from gyrochronology. They discovered that the anomalous rotation became significant near the solar age for G-type targets, but it appeared earlier in F-type stars and later in K-type stars.
Perhaps the most significant indication that the Sun is in a transitional evolutionary phase is its 11-year magnetic cycle, which falls between the active and inactive branches established by other stars (see Figure 2).
Even the slightly younger solar twin 18 Sco exhibits a normal cycle on the I-branch, while the Sun is the only star with a rotation period between 23 and 30 days that shows a cycle at all.
There were several Mount Wilson targets with rotation periods in this range, but they are all flat-activity stars. The Maunder minimum may represent one manifestation of the Sun beginning to enter this flat-activity phase.
The fact that all of the slower rotators with cycles are K-type stars is perfectly understandable, since magnetic braking ceases in G-type stars before they reach these long rotation periods.
Where they write: “Such a transition may represent the shift from a dominant α–Ω dynamo to an α^2 dynamo, but this remains to be demonstrated.”
The problem is, “How many hundred millions of years must we wait for that transition to be confirmed or refuted?” At a minumum, any transitions are certainly in the range of many millions of years.
You are missing the point. Big surprise. Have you looked at the paleo data and wondered what makes the cyclic changes in temperature? There is an imagination issue.
Our science assumed the sun was a simple fusion engine, a conventional star. That assumption appears to be incorrect.
The sun is a complex active object which is gaining mass… if it was a simple conventional fusion star, it would be losing mass.
An observation to support the assertion that the sun is a complex active object is the fact that based on a half dozen independent satellite radar observations the planet’s orbits are changing exactly as if the sun was gaining mass. This is an observational fact, not a theory or something that could be explained by an error or limitation in measurement. The paradox is real.
“If the reported increase is absorbed into a solar mass increase, and not into a changing gravitational constant G, the inferred solar mass increase is (6.0 ± 1.6) × 10 ^18 kg yr −1 .”
Astrometric solar-system anomalies
https://www.cambridge.org/core/services/aop-cambridge-core/content/view/7FB105AC2EC0518570DF502BF3D00A17/S1743921309990378a.pdf/astrometric-solar-system-anomalies.pdf
“Astrometric solar-system anomalies
However, rather than increasing, the AU should be decreasing, mainly as a result of loss of mass to solar radiation, and to a much lesser extent to the solar wind. The total solar luminosity is 3.845 × 10 26 W (Livingston 1999).
This luminosity divided by c ^2 gives an estimated mass loss of 1.350 × 10 17 kg yr −1 .
The total mass of the Sun is 1.989 × 10^30 kg (Livingston 1999), so the fractional mass loss is 6.79 × 10 −14 yr −1 . Again with the factor of three from Eq. 2.1, the expected fractional decrease in the AU is 2.26 × 10⁻¹⁴ yr −1, or a change in the AU of − 0.338 cm yr −1.
If the reported increase is absorbed into a solar mass increase, and not into a changing gravitational constant G, the inferred solar mass increase is (6.0 ± 1.6) × 10 18 kg yr −1 .
This is an unacceptable amount of mass accretion by the Sun each year. It amounts to a fair sized planetary satellite of diameter 140 km and with a density of 2000 kg m −3 , or to about 40,000 comets with a mean radius of 2000 m.”
It can do what it does to serially force the geomagnetic field and the forcing of the geomagnetic field causes the abrupt climate change.
An observation to support that assertion is the discovery of geomagnetic excursions at all of the past abrupt large climate changes and recently at the abrupt small climate changes.
Based on the paleo evidence there is a serial forcing event that appears every 16 million years, every 6000 to 8000 years, every 2,200 years, every 1400 years (beat of plus minus of 200 years) and every 500 years. If the sun is the cause then the sun changes on that frequency to cause what is observed.
Based on observations and systematic paradoxes (paradoxes which are structured) … It is appears it is an observational fact, that we live in a ‘steady state’ universe that has active complex objects which make atoms and shoot out stuff like baby complex objects which become ‘dwarf’ galaxies and which become large galaxies, like the Milky Way and Andromeda.
An example of the paradoxical complex structure are globural clusters which have been found to occur in every galaxy and the number of these strange objects correlates with galaxy luminosity, except the baby dwarf galaxies have 30 times more and the large Cd galaxies which there is one of in every large super old cluster also have 30 times more globural clusters.
As discussed in the paper below, the globural clusters have a complex structure that cannot be produced by collapsing gas clouds or by nucleosynthesis. Absolutely physically impossible. No chance. Did not happen.
About 30 years ago a German astronomer Halton Arp discovered observational evidence that active galaxies (these are galaxies that have a quasar like object in their core that is producing massive amounts of dust and shoot stuff out of the poles of the massive object) were ejecting quasar like objects which…
… as there is a line of these objects… turned into quasars by seeing the connecting gas cloud using a combination of radio telescope observation and optical.
30 years later using new more powerful radio telescopes…which can see detail in the radio spectrum. Observations that Halton Arp has conceptually correct. Matter is being made ejected from complex objects.
There are now pictures of a massive electric current (light years long) that is travelling in the emitted gas from the ejected object back towards the AGN towards the ejected quasar (powerful radio telescopes now can ‘see’ the line of radio emission which is light years long pointing at from the AGN to the ‘knot’ which is emitting x-rays.
The ejected knot will become a baby complex object which will turn into a quasar and which will later become a dwarf galaxy which will then grow up to be a large galaxy like Andromeda or the Milky Way… which produces (the massive electric current from the AGN towards the knot) the most powerful emission at radio frequencies in the universe…. Emitting radio waves just like an antenna.
https://arxiv.org/abs/1503.03071v1
https://arxiv.org/pdf/1510.01330.pdf
Astronomy about 10 years ago that all globural clusters older than 1 billion years have two or more generations of stars in them. And all globural cluster younger than 1 billion years had only one generation of stars in them.
The big bang theory cannot make/explain the elemental patterns found in the second generation. These complex objects (and our sun if it is gaining mass has a complex object in it) is new physics … which is the new physics of a ‘steady state’ universe.
The second generation has exactly the same elemental composition except for elements lighter than calcium which are more and less than the first generation of stars.
The second generation is the majority. About 60% based on number. Gas clouds will not collapse and do not collapse in regions where there are clusters of tightly packed stars.
Ignoring that fact, it is impossible to make more light elements to explain the increase in some light elements and decrease in others in the second generation of star like objects
The globural clusters star like objects at tightly packed in a closed cluster with stellar density (the distance between star is roughly about the distance between the sun and Pluto) similar to that in the core a galaxy where there is a massive object.
There is a fundamental problem in their assumption that half cycle is 5.5 years. Sunspot cycle duration alternates about every 100 years between ~10.4 and 11+ years
Assumption, assertions, an AI model (i.e. hypothesis), but is it plausible? Is it politically congruent? That is, can it be exploited for political, social, and economic leverage?
Was that picture of the Sun done by Vincent van Gogh?
No.
Computer algorithm recreates Van Gogh
https://www.theguardian.com/technology/2015/sep/02/computer-algorithm-recreates-van-gogh-painting-picasso
Like some other commenters, I don’t buy it. 1. Changing past data. 2. Opaque logic (how was the AI trained?, has the changing of the past led to circular logic?, eg.). But at least the predictions are out there for testing. It seems there is high divergence between scientists now, which is a good basis for progress. Pity it will take at least 5 years for the testing, but that’s a lot better than the totally-protected-from-testing climate models.
> That interaction between the two periodicities led the algorithm to indicate that from the 1730s to the 1760s, early in the modern sunspot record (the gray band below), sunspots appear to have been under-recorded
Not an entirely new discovery 🙂
https://link.springer.com/article/10.1007/s41116-020-0023-y
It so appears that this subject, as far as I can judge especially according to the Paris memoirs, was cursorily very rarely observed since 1719, and since 1722 in particular, rather out of amusing speculation than out of true scientific zeal.
“Coverage of decades by days with observations, adapted from Vaquero et al. (2016). The numbers include all sunspot observations, also the ones without drawings, and zero-spot detections”
:
“AI” is just another term for “software”.
OH dear. More models being used to “correct” observations. If your model is contradicted by observation you review the MODEL not the DATA.
If this indeed reflects the content of paper rather than BS added by press release, I’m disappointed in Soon and Legates.
OK paper says:
That gets translated into “appears to have been under-recorded”. More chinese whispers by uneducated media studies students writing pressers.
I thought the whole point of AI was that you did NOT train it how to do something.
Centennial solar minima occur on average every 107.9 years, but varying from around 80 to 130 year intervals. So a 120 year envelope is too long and cannot capture the variability either.
I can discretely map every centennial minimum by these correlations, and this centennial minimum is as short as they ever get, affecting only solar cycles 24 and 25.
https://www.linkedin.com/pulse/schwabe-cycle-variability-ulric-lyons