Via Spaceweather.com
After 4 years of non-stop sunspot activity, the face of the sun is suddenly blank–no sunspots. The first spotless days since 2022 herald the distant approach of a new Solar Minimum.
Click on this image to magnify it and take a careful look around the solar disk. Can you find any sunspots?
This week has brought the first “spotless days” since 2022. So far, Feb. 22nd, Feb. 23rd, and Feb 24th have had completely blank suns. This breaks an uninterrupted 4 years of non-stop sunspot activity.
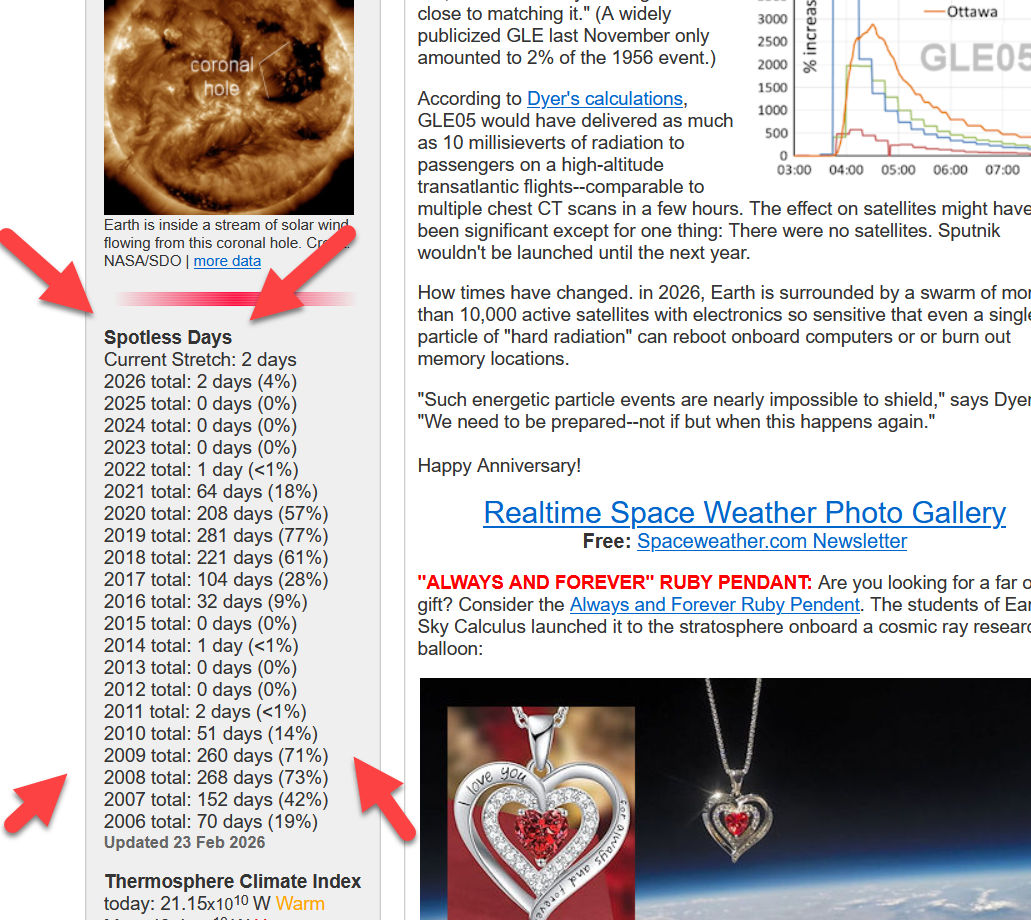
What does this mean? It’s an early warning of Solar Minimum, the low point of the 11-year solar cycle. During years around Solar Minimum, whole months can go by without a single sunspot, racking up dozens of spotless days in a row. Between 2018 and 2020 (the last Solar Minimum) there were more than 700 spotless days in total. You can find the daily counts right here on Spaceweather.com. The Current Spotless Stretch is 3 days.
Solar Cycle 25 still has years of life left in it. However, these spotless days tell us that the current cycle is waning. Sunspots will be back–probably tomorrow–but this week is a preview of things to come.
and the importance of this is ???????????????????????????????????
It’s good to know, that the sun is less active now, with all of the consequences.
Obviously Boris Badenoff took them all to Spotsylvania
FWIW, lesser (or greater) sunspot activity doesn’t correspond to a reduction in solar irradiance, or “the radiant power received by unit area of surface“, changes in sunspot activity affects the extent of heliosphere and, inversely, the amount of cosmic rays reaching the earth’s atmosphere (and by Svensmark theory, the earth’s cloud cover.)
Awww. I was afraid someone would ruin the fun. Dumm science.
You didn’t go far enough . . . if Svensmark’s theory is correct, the increase in ion-induced cloud condensation nuclei associated with an increase in incoming galactic cosmic “rays” (actually high energy particles) entering Earth’s atmosphere due to a “quiet Sun” (i.e., one with fewer sunspots) and associated lower strength geomagnetic field, will result in an increase in cloud coverage area, which in turn will lead to overall average cooler weather due to an increase in Earth’s albedo.
Hmmmm . . . cooler weather? . . . I think I’ve recently heard and seen news reports of that occurring over North America and Europe.
I was providing an abridged version, one that was only being presented to show why a fact is only meaningful if you have a theory that gives it meaning. Without a frame of reference you just have a disembodied ‘fact’ that, at best, you can formulate a definition for… and, if you want to turn it around on itself, you can get a tautology.
But, that said, Svensmark’s theory is one way to extract meaning from a fact… it also happens to be the one that I personally like but, assuming it can be made to make sense, any other theoretical framework would also do.
Well, it is science, a refreshing change from politics.
The solar cycle impacts aurora (who doesn’t want to see the aurora?), geomagnetic storms (remember 1859?), and is a climate driver. I decided to start following climate change seriously in 2008 at a end of a solar cycle and a PDO flip. I found WUWT soon afterwards.
“Well, it is science, a refreshing change from politics.”
Amen to that, brother, although we can’t ignore the politics.
The 1859 solar event was a comparative tiddler. The 774 event is believed to have been fifteen times as powerful.
Without a theoretical framework we are kind of looking at a tautology, that is, “a solar [sunspot] minimum means that the sunspots are at a minimum“.
In Svensmark’s Cloud Theory, a solar sunspot minimum means that the heliosphere will, because the solar flares are not renewing the pressure inside of the heliosphere, the heliosphere will deflate and because it is losing power, allow more cosmic rays to penetrate the atmosphere. And, since the earth is a big cloud chamber, the earth will have some increase in cloud cover, and a reduction in temperature as the solar radiation is reflected back into space, of some indeterminant extent.
But… if Svensmark is wrong then, lacking some other framework, we have to go back to the tautology above, that is, that “a solar [sunspot] minimum means that the sunspots are at a minimum“.
Admittedly, the tautology isn’t very interesting but, hey, I gave a least one frame of reference where a “solar sunspot minimum” has some meaning.
It also means that it’s a good time to go back to the Moon, and in the remaining spotless years to go to Mars.
Yeah, that’s a good thing too.
Why? I submit that there is nothing on the Moon or Mars which justifies the expense of sending astronauts there. Anyone who disagrees should be required to vindicate that opinion with their own investors’ money, and leave the taxpayers out of it.
Elon seems to have that covered.
I’ve often said that, if we’re going all that way to live in caves… and if we’re going to either the moon or Mars with the cosmic ray intensity on their surfaces, we will have to live in caves… we might as well find a cozy cave somewhere in the south.
That way, when we need supplies we can run over to the local Piggly Wiggly, , and pick up our supplies there.
The sun powers the earth energy systems.
Sun spot activity affects Cosmic rays which affect cloud formation.
Neither is singular control knob but both have their effects.
Maybe some people are just interested in things like this? Not every article has to be earth-shattering news.
Obviously, you felt it was important enough to comment.
Less chance of a Carrington Event?
It seems they will be back tomorrow, the one or the others.
Where’s Sting when you need him…
There’s a little black spot on the sun today…
There’s a fairly big spot on the far side, visible from the Mars rover Perseverance.
This one?

The solar minimum appears to be of little climate consequence. A Solar Grand Minimum or Maximum is quite a different matter. We had an ~80-year SGMax from ~1930 to ~2010, the longest and strongest for several thousand years, and that appears to have finished. Given that the average global surface temperature declined until nearly 1980, I suspect that we have several decades to go until the end of the SGMax can be seen in the global surface temperature. NB. It’s very reasonable for there to be such a delay, because (a) solar activity probably works mainly through the oceans, and (b) solar activity would relate more to δT than to T.
If we’d built those cool tinfoil space mirrors between Earth and the sun to protect Earth from overheating, we could move them so Earth is between the mirrors in the sun to protect Earth from overcooling. It would be fun to see a rectangular full moon.
We could fund it by selling the shape, like it could shine a moon-sized “Coke” emblem.
I calc’d about 7 years of total aluminum production of mankind to make enough tinfoil…but not gonna bother with how many tons of liquid fuel to launch it all…
We can do it. Aha!! “The Moon is primarily made of oxygen, silicon, magnesium, iron, calcium, and aluminum.” Might be an actual reason to build a moon base.
Wow, I did NOT know this 30 seconds ago: ” The aluminum content of the Moon’s surface, particularly in the lunar highlands, is roughly 3% to 10% by weight”
It’s pretty easy to imagine those space ‘mirrors‘ turn into huge space ‘sails‘ and, when they’re hit by the solar wind, they sail off to the edges of the solar system and beyond.
I blame global warming.
One might speculate that this precedes a mini ice age. Maybe not.
You cannot rule out a double peak, but it sure looks like it’s on the slow grind down to min. I find it intriguing that the F10.7 and SSN plunged from the high a few months back, TSI has held flat since the 25 Peak. Cycle 23 had a similar signature; it seemed to take longer for TSI to drop after a significant step down of SSN / F10.7