Richard Willoughby
Summary
This article follows up on an earlier article that considered how the movement of the Sun relative to Earth as well as solar activity alters Earth’s climate.
The motion of the Sun so far during this century is analysed in detail and gives insights into how the various planets contribute to the motion of the Sun. The cause of the daily anomalous distance from Earth to Sun is also investigated and quantified for the same day of the year over 30 years.
The originating Sun motion data for this analysis has been extracted directly from the NASA Horizons Application and used for free body dynamic motion analysis. The JPL free body model of the solar system treats each celestial object as a point mass concentrated at the centre of mass. The free body analysis of the Sun here extends to a point mass elastically connected to the centre of mass of the Sun and rotating around the centre of mass to determine the gravitation torque imposed on the rotating mass.
Sun Movement
The orbit of the Sun is somewhat erratic with each rotation being different to the preceding and those following. Diagram 1 shows the path of the Sun using the International Celestial Reference Frame (ICRF) for the period 2000 to 2030 in the celestial equatorial plane. In the ICRF, Point(0,0,0) is the barycentre of the solar system. The dynamic analysis in this article assumes the North-South motion of the Sun out of the equatorial plane is negligibly small.
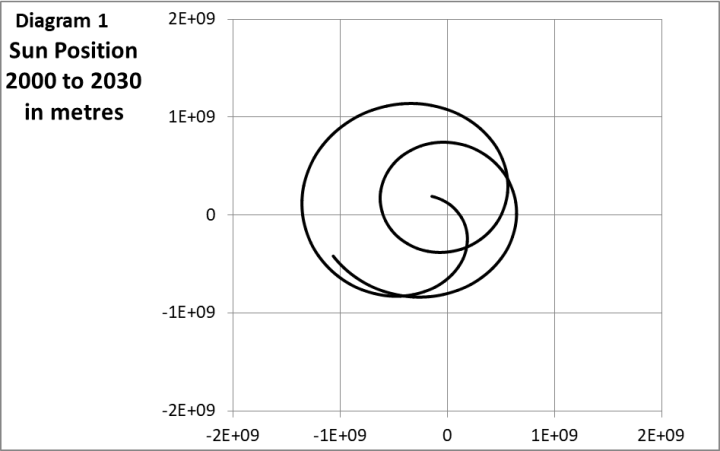
However, to complete the picture of the Sun motion, Chart 1 indicates the North-South excursions from the celestial equatorial plane over the same period as Diagram 1.
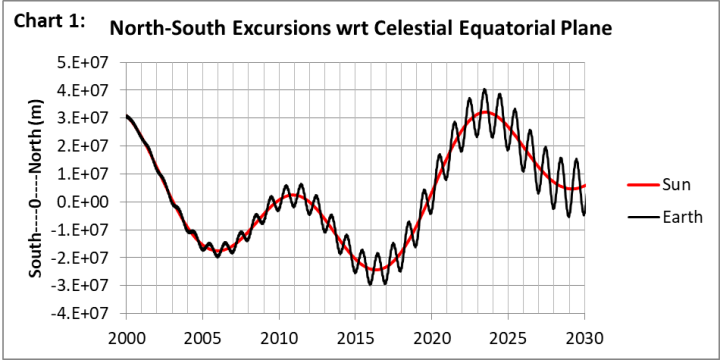
Jupiter’s orbit dominates the motion of the Sun and Jupiter’s orbital plane has a 1.3 degree tilt to the celestial equatorial plane. The North-South excursion of the Sun with respect to the ICRF is a result of the Sun essentially moving in Jupiter’s orbital plane. As observed in Chart 1, Earth tends to follow the Sun in its North-South excursion. Jupiter’s direct influence on Earth is more apparent in the equatorial plane as shown in Chart 2 that displays the Sun to Earth distance anomaly wrt to 2000 for the September Equinox over a 30 year period.
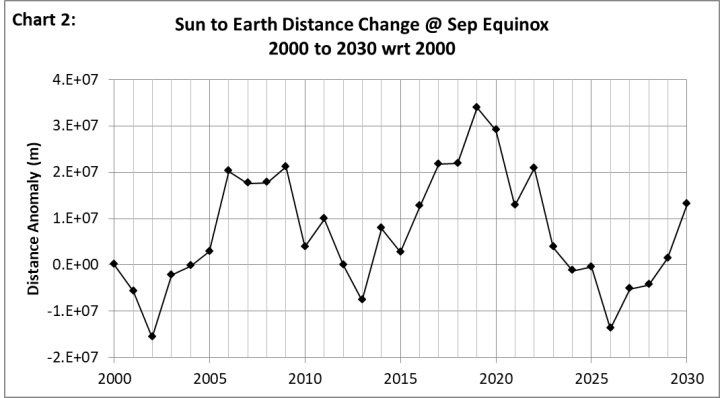
The range of the anomalous distance shown in Chart 2 is sufficient to alter the peak solar intensity by 1W/m² for the selected day. The day was selected for ease of annual alignment in the equatorial plane rather than being the maximum difference for any particular day of the year.
Individual Planetary Influence on the Sun’s Orbit
The Sun orbit is broadly in opposition to Jupiter; as in the Sun being the hammer thrower and Jupiter being the hammer. The Sun is 1050 times more massive than Jupiter so the orbit of the Sun needs to be 1/1050th of Jupiter’s orbit to keep the orbits stable. Diagram 2 shows the 2-D free body orbit of the Sun being driven by Jupiter’s actual orbit.
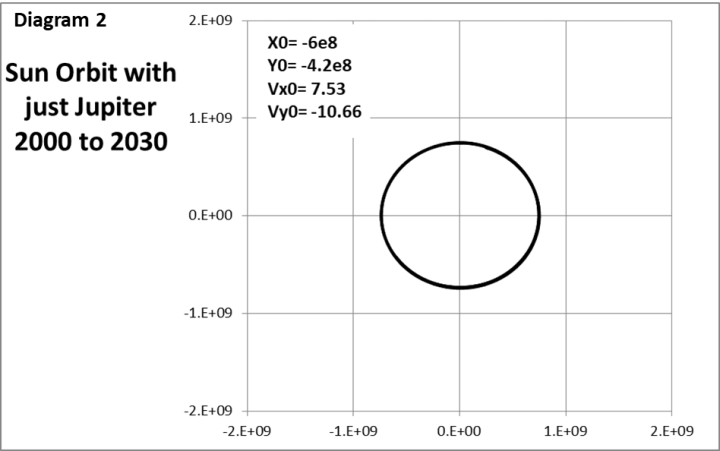
To be clear, the motion of the Sun shown here is the result of the Sun only being influenced by Jupiter while Jupiter is following its prescribed path under the influence of all the other celestial bodies having gravitational influence on the solar system. The initial conditions shown on Diagram 2 for the Sun position and velocity differ from the full system that produces the actual orbit shown in Diagram 1 above.
Diagram 3 shows how the Sun would move when both Jupiter and Saturn are present. Saturn has sufficient influence to require resetting the initial conditions to maintain stable orbit of the Sun.
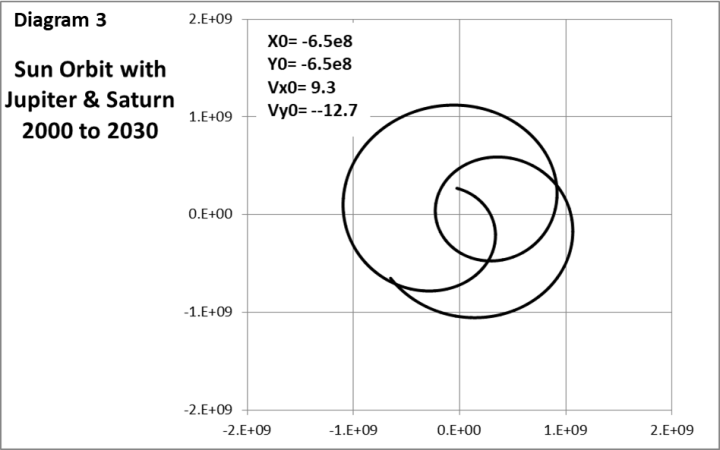
Including Saturn causes the orbit of the Sun to have some similarity to the full system orbit of Diagram 1.
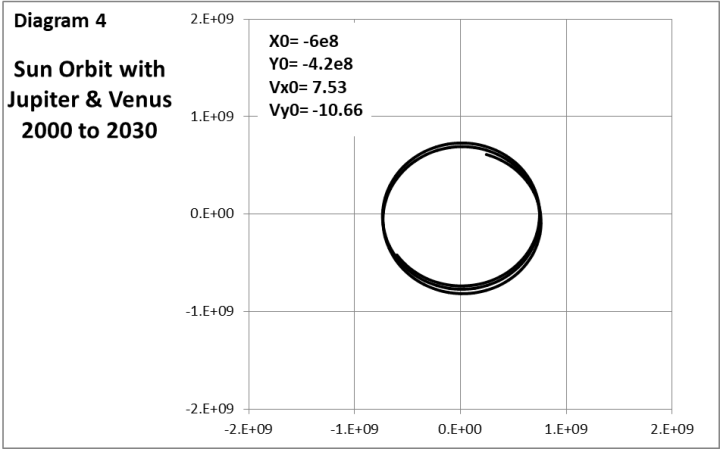
Although Jupiter is 390 times more massive than Venus, Venus is 1/7 the distance from the Sun so Venus has detectable influence on the motion of the Sun as shown in Diagram 4.
Neptune is the most distance planet from the Sun but its mass is slightly more than half the mass of Jupiter so it has gravitation influence by virtue of the double integration of time from force to distance as shown in Diagram 5.
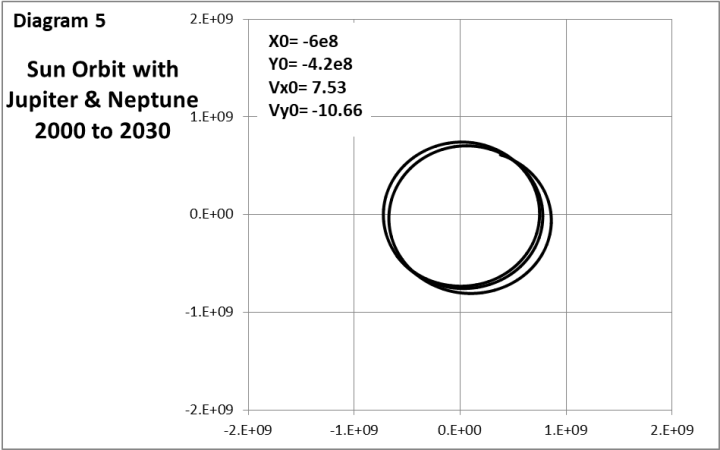
The 30 year time period shown in Diagram 5 is somewhat brief to get a full appreciation of Neptune’s influence on the motion of the Sun because the planet has only moved through 65 degrees of arc in that time. Neptune is the plodder in moving the Sun; slow and steady.
Distributed Mass of the Sun
The radius of the Sun at 6.96E8m is significant relative to its orbit of 7.31E8m under the influence of only Jupiter. Considering the erratic orbit of the Sun under the influence of all the objects of the solar system, there are times when the barycentre is within the sphere of the Sun. In fact there are some orbits when the centre of mass (CoM) of the Sun does not encircle the barycentre.
Another feature of the Sun is that its mass is in the form of plasma. Hence it is more fluid than solid. Under the influence of its spin, the centrifugal forces on the plasma cause the whole Sun to oblate with the diameter at the equator increasing relative to the pole to pole diameter.
The simplest way to analyse the free body motion of the surface of the Sun is to reduce it to a single point in space tethered to the CoM. This is shown diagrammatically in Image 1.

The tether has elasticity to represent the behaviour of the plasma oblation under centrifugal acceleration.
The initial analysis, shown in Diagram 6, displays the position of the Sun as determined by JPL as the black locus for the CoM and the red locus for the equatorial point (EP) under the influence of the same gravitational accelerations moving the CoM. The EP is set in the X-direction from the CoM.
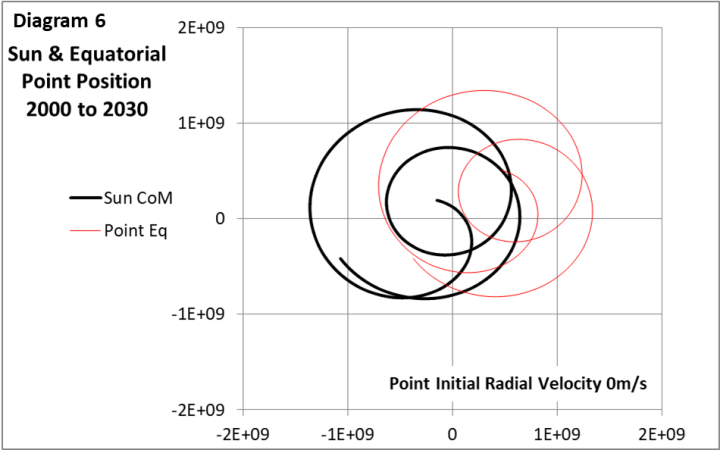
The EP essentially holds its position in the X-direction tracing a similar, but displaced orbit. Chart 2 shows the velocity of the EP if the Sun did not have any spin. It is the same as the velocity of the Sun. Venus contributes most to the small dither in the velocity.
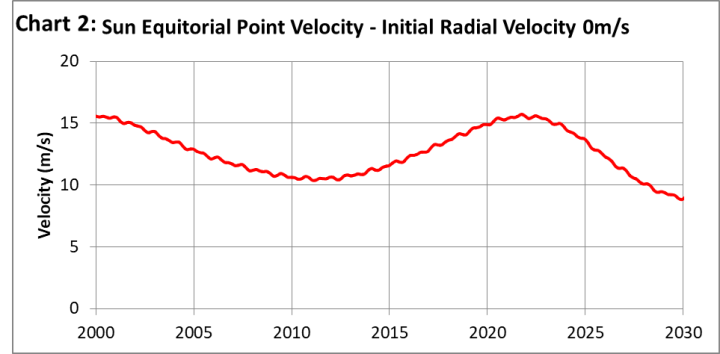
Diagram 7 shows the loci of the CoM and EP after the EP is given initial motion in the Y-direction of 100m/s relative to the CoM.
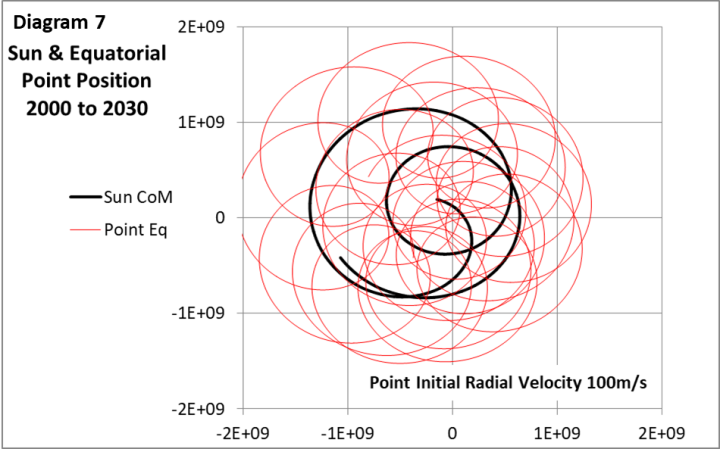
The initial spin of 100m/s gives a spin period of 506 days so the EP orbits the CoM 22 times over the 30 year period minus the almost 3 orbits the CoM completed in the same time. This is observed in Chart 3, showing the velocity of the EP over the period with average of 100m/s and 19 excursions.
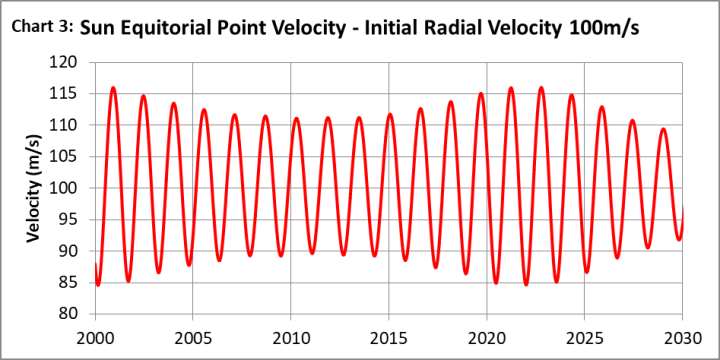
The velocity of the EP is observed to have a range about the average governed by the velocity of the CoM. The EP has to be accelerated and decelerated through the course of each rotation resulting in the tether stretching and relaxing each rotation. If the EP was not influenced by the gravitation field, the accelerating torque and decelerating torque would cancel out. The gravitational force acting on the EP is orders of magnitude smaller than the tether force but gravitation force creates a net torque as shown in Chart 4. The calculated torque is based on the EP having unit mass of 1kg.
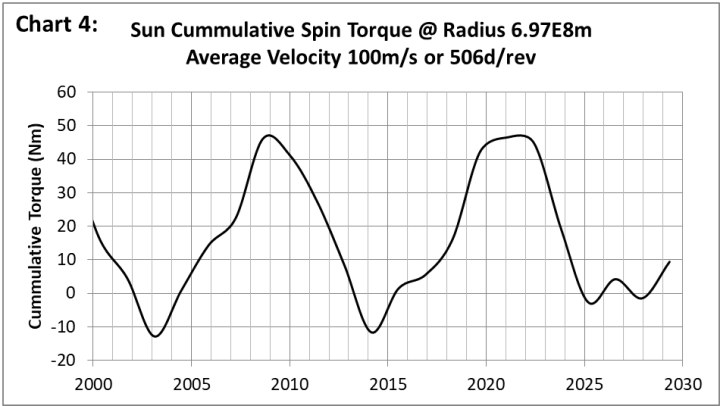
Over the 30 year period, the average spin velocity increases by 0.04m/s but there are periods when the spin also slows down.
The equatorial spin of the Sun is approximately 25 days; corresponding to 2000m/s. Chart 5 shows the cumulative spin torque on the EP under these conditions.
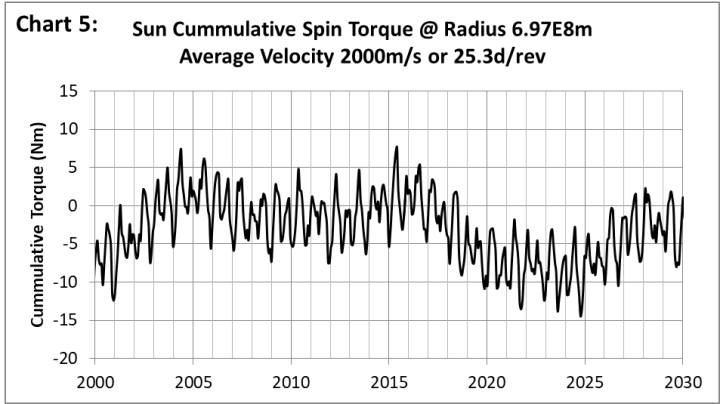
The average torque for a spin period of 25 days is slightly negative.
Spin Torque Between 100m/s & 2000m/s
The two examples considered so far yielded both a net positive cumulative torque and net negative cumulative torque over the 30 year period considered. This begs the question – what happens in between these extremes.
If the Sun spin was caused by gravitational effects then they would be most pronounced in the region that could generate the highest torque. Considering the Sun as a series of concentric cylinders surrounding the spin axis and assuming constant density, the highest torque would be achieved at 5.7E8m; corresponding to latitude of 35 degrees. Accordingly, Chart 6 shows the cumulative torque for a range of initial spin velocity at 5.7E8m from 900m/s up to 1850m/s.
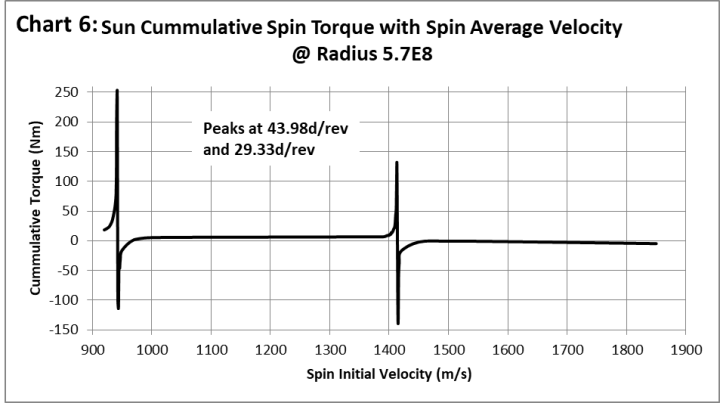
There are two interesting peaks indicative of resonances. The first occurs at periods of 44 days and the second at 29.3 days. Both peaks exhibit a sharp increase in torque followed by a rapid collapse into negative torque. There is a recovery to positive torque at 970m/s with a gradual increase to 1400m/s before the next peak and sudden collapse.
The cumulative torque goes through a phasing sequence as the initial velocity approaches the resonance. Chart 7 shows the cumulative torque at 5.7E8m for 1403.7m/s, which was chosen because the cycles have good negative correlation with solar activity over the 60 year period.
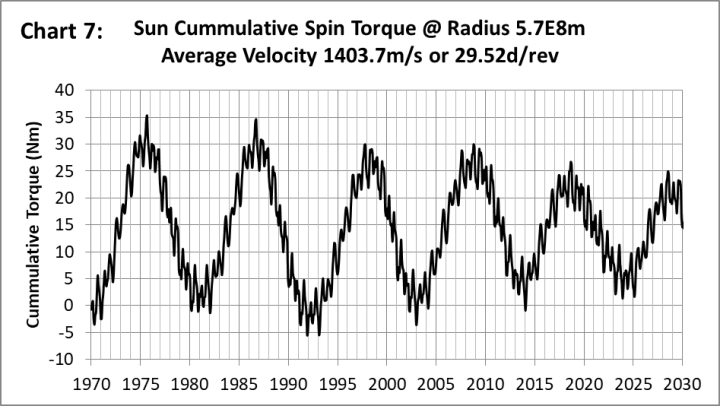
The cumulative torque cycles reduce as the initial velocity approaches 1413m/s where it just becomes a steady upward trend per Chart 8.
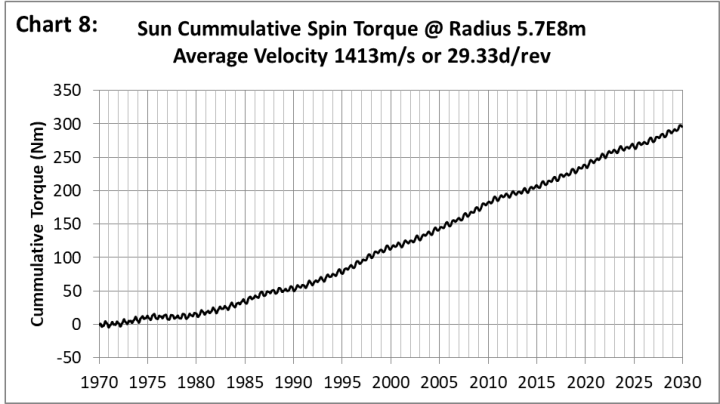
Although the torque rises throughout the period, it only increases the EP velocity by 0.05m/s over that period. The torque drops precipitously above 1413m/s and is negative by 1414m/s. So any portion of the Sun spinning with a period of 29.33 days is on the verge of switching between spin acceleration and spin braking.
Discussion
The period of the two resonances show Mercury has a tidal influence on the Sun. In fact, this analysis may underestimate the impact of Mercury because the individual planetary contributions are summed and applied as a single varying gravitational force to both the CoM and the EP. Given Mercury’s proximity to the Sun and the large diameter of the Sun, the local tidal effects of Mercury on the adjacent Sun surface may be significant as well. Mercury’s contribution to the motion of the Sun CoM is miniscule but it appears to play a key role in the spin of the Sun, which extends to the development of solar activity.
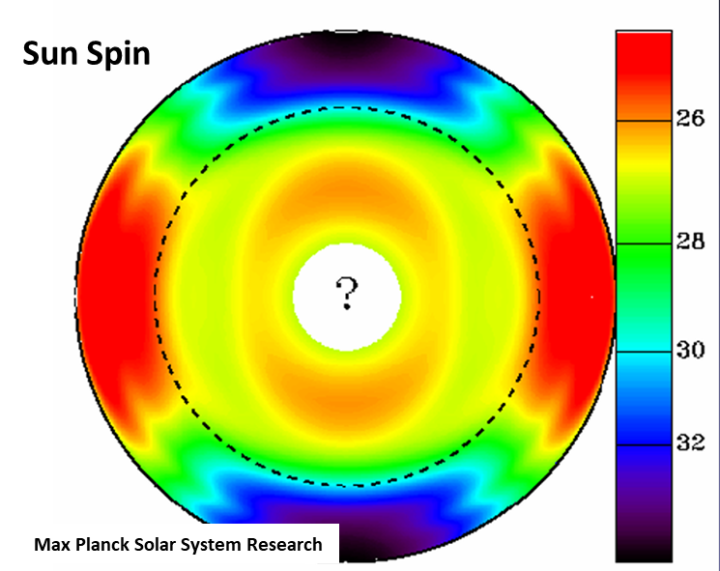
If the torque was always positive, the Sun would continue to spin faster. The fact that the torque reaches a tripping point that causes a sharp torque reversal is consistent with generating local turbulence and high shear in any region spinning at a period of 29.33 days. This aligns with the observed dominant period of the Sun per the headline image above from the Max Planck Solar System Research.
The torque calculations do not explain the period of rotation of the Sun’s equator nor why the rotational speed at smaller radii is slower than 29.33 days.
Conclusions
The motion of the Sun is uniquely different to the movement of the planets. The Sun tracks an erratic path while experiencing a two to one range in its orbital velocity. The plasma of the Sun imbues the ability to oblate under centrifugal acceleration from axial spin. This ability is shared with the gas giants Jupiter and Saturn which spin at even higher equatorial velocity than the Sun.
Analysing the motion of celestial bodies as point masses is a simplification that limits understanding of their behaviour. The distribution of the mass and its physical state are important considerations for assessing gravitational influences beyond velocity and position.
The Author
Richard Willoughby is a retired electrical engineer having worked in the Australian mining and mineral processing industry for 30 years with roles in large scale operations, corporate R&D and mine development. A further ten years was spent in the global insurance industry as an engineering risk consultant where he developed an enduring interest in natural catastrophes and changing climate.
Climatistas will either spin the spin or dismiss it entirely. Their narratives are sometimes so bizarre that they are harder to predict than climate.
The amazing thing is how CO2 causes all of this in the first place.
Professor Harald Yndestad talks about the Little Ice Age is returning.
The scientists’ mathematical calculations about how the planets’ perihelion affects the Earth’s orbit give different answers.
How are we supposed to know which calculations are correct?
re: “The scientists’ mathematical calculations about how the planets’ perihelion affects the Earth’s orbit give different answers. How are we supposed to know which calculations are correct?”
Are we, or are we not into at least the ‘physics three body problem’ here?
https://duckduckgo.com/?q=physics+three+body+problem&t=ffnt&ia=web
Thanks. We complain about climate scare writers using models as data. As soon as we start basing analysis on the most likely thing to have happened based on a tiny window of real data… ‘we’ become ‘them’.
The movement of the planets is reasonably assessed by observers from Earth. The Sun is a bit harder due to its chaotic orbit, large size and slow movemenr.
I spent considerable time comparing the starting conditions for the Sun’s motion compared with what JPL have determined. It is possible to alter the starting conditions slightly and still get stable orbit. But they are fine adjustments.
I do not know how precise JPL’s movement of the Sun actually is but I know their starting conditions result in stable orbit of the Sun.
The torque or tidal component is something I have considered for a long time but this is the first time I have actually devised a simple way to assess it. I was surprised by the observed resonance.
If there is anyone out there with dynamic analysis ability, I can advise that I had to go down to 4 hour time resolution to get the elastic constant of the tether so it limited the stretch to 200km, which is about twice of what has been estimated for the observed oblation.
One of the constraints to my analysis is the 90,000 line limit on JPL downloads. I could get 30 years at 4 hour intervals.
“I spent considerable time”
Average life expectancy modern human:
“Life expectancy at birth in the U.S. reached an all-time high of 79.0 years in 2024”
‘Scientific’ age of Earth:
“The Earth is approximately 4.54 billion years old”
I don’t love radiometric dating (you have to guess the starting quantity that will be reduced with exactitude. Plus-or-minus one percent my anus), but I’ll give them the billions.
Point:
Einstein lived one tiny lifetime and thought some big thoughts, but so has my trash collector.
Professor Harald Yndestad calculated how the occurrence of cod in the Atlantic will develop in the coming years using the 18.6-year lunar cycle.
The temperature of the North Atlantic is a climate indicator and follows an 18.6-year lunar cycle. This is caused by the interaction of three astronomical bodies: the sun, the moon and the earth. Within this cycle, cod spawn twice a year during the high temperature phase, otherwise only once. Half a degree higher average temperature thus causes a twentyfold increase in the cod population. Since the average temperature will drop somewhat in the next 30 years, low fish stocks can be expected in the same period.
Lots of cycles are observed in Earth’s climate. I rely on NASA JPL getting Earth’s relationship with the Sun close to reality. The motion of Earth includes the moon with the moon contributing to declination through nutation of the axis over the 18.6 year cycle..
The tidal effect of the moon on Earth is not included in the JPL Horizons data because it treats all bodies as point mass. Hence my interest in tidal effects on the Sun due to the planets. Mercury is insignificant in the motion of the CoM of the Sun but it appears it has a key role in the Sun’s spin.
Orbital data about the planets and the moon must be linked to relationships such as temperature, weather and climate change on Earth.
If it is possible to find connections between the climate and the planets through spectral analyses, it simplifies the search.
Overfishing is also a big factor.
“the Little Ice Age is returning”
Seems like it this winter in the northeast of the US.
Who was it that said, “our grandchildren won’t know snow”?
“Winter is coming” — his final slide.
A.D. 2050: TSI deep solar minimum
A.D. 2070: Deep[est] climate minimum of the past millennium*
‘Our grandchildren won’t know thaw’
Damn that’s a very dodgy YT. The wavelet bit is somewhat believable, but the astrology bit is at best correlation is not causation.
It is fortunate that it is only a correlation that will not occur again.
The correlation is therefore not statistically certain.
Imagine the panic that will arise in the world if a new little ice age can be statistically certain.
Could Grok or one of the other AI engines come up with an animation of what’s being described?
This is a lot for a layman to absorb … I think I understand it, but I’m thinking of the other guy who may get tangled up in the intricacy of what’s being said here.
Something I would like to do. However my current focus is clear proof that the Sun and Earth’s relationship with it controls Earth’s climate.
This work confirms that solar activity is linked to the velocity of the Sun as it speeds up and slows down but I would have never dreamt that tiny Mercury would be the main player in creating solar activity.
Climate is the statistics of weather observations. Weather is the end result of chaotic atmospheric processes, and is thus not usefully predictable – any better than a reasonably intelligent 12 year old can do.
A characteristic of chaotic systems is that there is (seriously) no minimum change to inputs which may result in completely unforeseen outcomes. Newton’s Law of Universal,Gravitation “describes gravity as a force by stating that every particle attracts every other particle in the universe with a force that is proportional to the product of their masses and inversely proportional to the square of the distance between their centers of mass.”
So even the indeterminate position and momentum of a photon at the edge of the universe may have unknown effects on the orbit of the Sun, or any other heavenly body, for that matter.
By definition, all orbits are chaotic. The best that can be done is to assume that nothing catastrophic will occur in the next second, year, or century.
However, weather cannot be predicted on the basis of knowledge of properties of the Sun. Over the past four and a half billion years, the Earth has cooled in spite of continuous sunlight pouring down upon the globe, and presumably will continue to do so until it achieves thermodynamic equilibrium with its cooler environment.
Chaos controls the weather, and hence the climate. In the Earth system context, weather and climate cannot usefully be predicted. Maybe you’ll stumble upon something new.
Who knows?
There are many features influencing climate trends that are not chaotic. History demonstrates that. The Sun rises every day. Earth experiences seasonal changes every year. There are certain events with less predictability than others. But orbit of planets around the Sun are predictable to some precision – within fractions of a second for Earth..
Some weather trends are quite predictable. I am on the record of predicting above trend snowfall in the NH this year based on solar forcing. There will be another temperature spike like the 2024-2025 spike in 2032-2033. Simply based on solar forcing. And it will be higher than the 2024-2025 spike because the trend is up and SC26 will be more active than SC25..
Greenland summit is already gaining altitude as the oceans of the NH warm up under the predictable nature of Earth’s orbital precession. The Northern Hemisphere is only 300 years into increasing solar intensity that will extend for another 9,000 years. You do not need to be very smart to appreciate that there will be much heavier snowfall across the NH in centuries to come. This year was above trend. But the trend is relentless and has only just started.
Professor Harald Yndestad makes spectrum analyses on temperature and TSI series and sees patterns that are consistent with the orbits of the planets and the moon.
Professor Harald Yndestad talks about these spectrum analyses in the second video clip that I attached.
You can’t name any, though. You assume, like any 12 year old, that the Sun will rise tomorrow, and so do I.
However, even the IPCC has stated that is not possible to predict future climate states. If you are implying that the IPCC is wrong, I’ll need more than your word for it.
The universe is chaotic, and therefore ultimately unpredictable. If you don’t accept chaos, then even classical physics will rapidly lead you to the conclusion that usefully predicting weather (better than a 12 year old) is impossible.
In my worthless opinion, of course.
Motion of gas molecules is chaotic. There are N>>>3 molecules not just 3. But the large scale motion of gas is quite predictable. Even chaotic systems have attractors and gross features of dynamics can be predicted.
Well, depends on definition of climate and this data is good enough as a predictor for me.
https://en.climate-data.org/
Can’t think of a reason to average two cities on opposite sides of the world or an equatorial one with a polar one.
Very impressive RickWill. One question if I may, why centrifugal?
If the initial conditions for the equatorial point are set to minimise the stretch of the tether then the stretch is always outward from where the circumference would be with now spin. It means that the plasma always oblates around the circumference although it will have more bulge in the region of highest velocity.
The tether provides the centripetal force.
The literature estimates given for the oblation is about 100km, which is not much in 6.96E8m. My tether stretches by 230km at 1400m/s. That is as small as I can go using 4 hour time division and remain numerically stable.
Thanks once again. In my mind the use of the word centrifugal implies a non-inertial frame of reference. Am I missing something?
If you can find an accepted engineering definition for the outward pull being reacted by the stretch of the tether then I will certainly change the wording to whatever is best..
Neptune has slightly more than half the mass of Jupiter ? Really ?
The data in the motion model at 1.02E26kg for Neptune and 1.9E27kg for Jupiter is correct but clearly 1/20th not 1/2. Good pick up. I will correct in the original document.
When the climate went on a rollercoaster ride – What the Dansgaard-Oeschger events teach us about abrupt climate change
Anyone who believes that abrupt climate changes are a modern invention should take a look at recent Earth history. During the last ice age, our planet experienced temperature fluctuations whose speed and drama dwarf anything we observe today. These are the so-called Dansgaard-Oeschger events – and a study in Nature Geoscience (Markle et al. 2017) shows just how globally interconnected these climate leaps were.
Thank you RickWill. Very interesting, and humbling to ponder.
I read in the latest addition of Astronomy magazine that some of the giant planets in our solar system have jet streams that blow west to east, and others that blow east to west.
Does the Sun have similar winds?
Earth spins
Air is free moving
Is the wind blowing, or is it trying to stay in the same place while Earth keeps moving?
Note that several of our Gas Giants, the wind on a couple of them are blowing in one direction, while others are blowing in the opposite direction, even though all of them rotate in the same direction.
The Sun is mostly fluid so it is able to have differential spin across depth and latitudes. The top image of the article that I found on the Max Planck site shows the variation in spin across the surface and at depth as far as has been assessed using various techniques.
The consensus view is that the Sun spin is the result of initial formation and is slowing down due to loss of mass from ejections. I now believe the spin is driven by tidal influence from Mercury. The spin resonance in combination with variation in the velocity of the CoM produces internal viscous shear that creates sunspots. A simple explanation for an observation compared to all the dynamo stuff. Proof would be to tie the production of sunspots to the 29.33 days/rev.
The image shows that 29 days is quite dominant on the surface and at depth. I expected another tidal resonance at 22 days but the torque was negative above 29.33 days. The shorter spin period of the Equator and lower latitudes may be convective and/or magneto-electric powered to get above the tidal influence.
I looked for evidence of Mercury slowing down due to tidal coupling with the Sun but could not find any data.
I like your theory.
I’m looking for something that explains the short-term cyclical nature of the climate since the end of the Little Ice Age. 1850 = cold, 1880 = hot, 1910 = cold, 1930 =hot, 1980 = cold, 1998 = hot,
You showed some numbers in an earlier post that correlated with the ups and downs of the temperatures, but I’m uncertain if those numbers are sufficient enough to cause the magnitude of changes we have seen during that time.
This doesn’t explain anything, it’s not a model, just an observation. Orbits aren’t circular, and Uranus and Neptune play a role, so the conjunctions vary over time.
This is the model. The prediction is based on filtered sunspot data.
Do the orbits of Saturn, Uranus, and Neptune correlate with periods of Little Ice Ages?
Are the relationships between planetary orbits and Little Ice Ages statistically reliable?
https://www.climateclock.no/2025/01/deep-minimum-2025-2072/
Climate largely repeats after 3560 years, a number found in the orbits of the Sun and Jovian planets. So periodicities correlate to many, if not most climate events.
As you can see in the bottom panel, the LIA isn’t unique, The associated cool period is around 2000 BC (black). It’s followed by the Minoan Warm Period, as experienced at the NGRIP site.
Bravo-Bravo Richard (hands clapping overhead). To me, his is a classic example of using “simple” models to better understand complex events. This is particularly important when the purpose is understanding, not prediction. I suspect your selection of 30 and more years of analyses might relate to climatic events; it is certainly enlightening on its own. It makes one wonder what surprises a complete revolution or more of Jupiter might uncover.
The 30 years was simply related to the 90,000 line limit on the JPL Horizons file download and the time interval of 4 hours to enable setting an elastic constant that did not result in enormous bulging while retaining numerical stability.
I can get 10 years at 1 hour which enables lower and more representative bulging but it is less than one of Jupiter’s orbit.
I intend to see what happens with two objects with slight radial separation but with the same initial angular velocity and angular position to observe if one advances radially faster than the other.. I will initially use the 1 hour time resolution so I can recreate observed bulging.
Wiki and Interbet quotes:
“A planet’s year (orbital period) increases with its distance from the Sun, ranging from 88 Earth days on Mercury to 165 Earth years on Neptune.”
Three heaviest planets:
”
Mass (kg):
Jupiter: 1.9e27
Saturn: 5.7e26
Neptune: 1.0e26
One rotation (Earth years):
Jupiter: 11.86
Saturn: 29.46
Neptune: 164.8
”
Article:
“The motion of the Sun so far during this century is analysed”
Math:
2026-2000 = 26 years
So what?:
Same problem with all climate analysis. If you want to analyze periodic things you have to wait for several cycles… “this century” earth time is 1/6 of one rotation of Neptune. I can think of plenty arguments about humans watching planets for thousands of years, but let’s not do that. I’m not trusting solar irradiance data from Victorian England.
“Interbet” -> “Internet”
“rotation” -> “revolution”
It is a period that most people reading this blog can relate to. It shows how the Sun has moved in its orbit this century plus the next 4 years. I was limited to 30 years by the file dump limit from the JPL Horizons site and my time resolution of 4 hours. I strung two dumps together to get 60 years so I could see how the spin torque related to solar activity.
I have previously done daily Sun movement from 1850 to 2040.
https://wattsupwiththat.com/2025/05/04/high-resolution-earth-orbital-precession-relative-to-climate-weather/
I am currently doing 1100 years at 5 day interval.
This detail analysis of the Sun movement inevitably matches observed changes in climate.
Climate models run on solar energy. The solar power is far more important. It is peak solar power that drives temperature not average energy.
Comment reads more critically than I intended when I wrote it.
I understand that using 30 years is because that’s all that was available.
Still, if the sun has really been there for 4 billion years, and all we ‘know’ is what happened in 30 years, then future projections are what they are.
The JPL Horizons data goes from 9999BC to 9999AD. But the download file size is limited to 90,000 lines. I needed relatively high time resolution to d the dynamic analysis of the spinning point. I got away with 4 hours by allowing around 200km oblation, which is greater than estimated. 4 house and 90,000 lines permitted 30 years if movement data.
“The Sun tracks an erratic path while experiencing a two to one range in its orbital velocity.”
Sorry Richard…its orbital velocity around the black hole in the middle of the Milky Way?…I’m missing something in your explanation I think….
The article notes that the analysis is based on the ICRF. Accordingly, the Sun’s velocity is relative to the barycentre of the solar system.
The common belief is that Earth revolves around the Sun and the year-to-year variation is due solely to changes in Earth’s orbit . One of the questions that prompted the detail of this article was to show how the Sun moves and how its movement impacts on the Sun-Earth distance.
The Sun movement alone this century is enough to alter the solar intensity by 1W/m^2. Or daily average of up to 0.4W/m^2 in just the movement of the Sun so far this century.
The solar inertial motion is described by many professionals from Joshi, 1965 to Fairbridge and Shirley, 1987. Charvatova, 1988, 1990, 2000; Palus et ll. There is a official simulator of solar orbits that don’t look so strange as shown in this text but more like presented here.
The part of the solar inertial motion (SIM) occurring over the period of 2200-2300 years causes the variations of solar radiation on earth in Hallstatt cycle derived from the C14 isotope in the terrestrial biomass as described in this book chapter https://www.intechopen.com/chapters/75534. This SIM is the source of the current global warming which will continue until 2600 when the temperature will increase for further 3.0C.
The previous global warming was reported during the Rome empire in 300-400 AD when grapes were grown inscotland and England and Romans had open stone sun baths in Scotland.
“This SIM is the source of the current global warming which will continue until 2600 when the temperature will increase for further 3.0C”.
i am not sure whether one can put an exact temperature number on that. It assumes a dubious ‘global average mean temp’ which is, of course, a doubtful concept.
And if this warming happens it wont be linear. I remember Zharkova ( PCA analysis) stating that we will get cooling from around 2030-2050, after which it will warm again until 2600. How much warming? That is uncertain and i believe cannot be clearly calculated.
Zharkova placed this all in relation to 350-400 year sun cycle and magnetic fields. Plus the orbital influence 2100 year cycle in relation to the Earth and Sun.
Here is the interview by Prof. Zharkova clarifying your points https://www.youtube.com/watch?v=SawIG4TNpHQ
Hi Richard, you’ve introduced me to a brand new (to me) field. I’m guessing the sun’s plasma and surface constantly changing will have an effect on EMR emitted?
I look forward to future articles,
Ken S
The solar output is surprisingly constant. It was actually measured by Earth orbiting satellites from 2003 till 2020. So it picked up all of SC24, which was lower than average but still gave data that could be correlated to other more readily observed solar surface activity.
When the Sun is active, the daily swing in the solar output at Earth average distance can be from say 1360 up to 1368. but the monthly average range is from around 1361.8 to 1364. Not much but far more significant than what CO2 could possibly do.
The solar changes with season and latitude also have the Sun-Earth distance and the declination changes due to various factiors. The year-to-year seasonal change at a particular latitude for daily solar can be as much as 10W/m^2 over Jupiter’s orbital period. Way more than any speculative effect of CO2.
The Sun provides the vast majority of Earth’s surface energy. It is the first place to look if you want to know why the climate is changing.unless you want to push a religion.
I admit it I am lost I don’t understand the point here except the planets have an influence on the sun and the sun has an influence on the planets. I know many here at WUWT will understand what you have said but I don’t. Can the average guy use what you have said here to argue against CAGW? In simple language if you please.
This article was preceded by a couple of earlier articles where there were questions on how the Sun movement affected sunlight on Earth.
The articles covering sunlight on Earth and its correlation with observed climate change. They are at these links:
https://wattsupwiththat.com/2025/05/04/high-resolution-earth-orbital-precession-relative-to-climate-weather/
https://wattsupwiththat.com/2026/01/26/changing-sunlight-weather-climate/
Observed climate change is all well explained by the changes in seasonal solar intensity across latitudes.
The current article also gets into detail on tidal influence of Mercury on the Sun and its relationship to solar activity. The three dominant factors Each-Sun distance; Sun declination to Earth’s equatorial plane and solar activity cabn be reasonably forecast and the trends in climate follow. the Sun.
I am surprised you got through this mentioning neither Theodor Landscheidt nor Prof Rhodes Fairbridge. They both published a lot of work on this topic. Landscheidt in particular devoted time to studying solar activity and variations in the the centripetal acceleration of the sun’s centre of mass. He held that the central mass of the sun (however defined) moved relative to the outside diameter and that this directly affected solar activity. His main conclusion, in consequence, is that we are now entering quite a long period of solar quietude, perhaps 30 years.
All grist for the mill…
In my early working career I worked at large industrial sites and was always on call to problem solve a range of engineering faults and failures. I learnt to always start from first principles rather than taking someone’s word for the cause of some observation. And I learnt to always seek and rely on first hand observation. I have more than once come across a problem that was logically impossible in my mind as an operator had observed and described an event only to find the logic at fault. The operator’s observation proved correct.
Hence I tend to do my own validation. And there is not much in climate science that passes for real physics.
Many observations in climate have their bias but many are useful. A classic is the negative ice loss on the Greenland plateau rather than simply stating a gain in altitude. Ice gain is unacceptable so it has to be a negative loss.
” And there is not much in climate science that passes for real physics.”
+100 Or even real math, statistics, or metrology
“A classic is the negative ice loss”
ROFL!!!
Chart One needs some more explaining.
At the start the Earth seems to have no appreciable amplitude, relative to the Sun. This amplitude then ramps up and up and up till the end of the time scale, (as displayed).
Why? Surely the Earth is in a stable orbit, probably has been for a long time, so what is so special about the year 2000 that the amplitude is zero?
And equally important, when will the ramping up change.
This looks like either a very convenient starting point/special condition or a software error where the starting conditions were zeroed and then the model started. If the latter, then the model has errors.
It at least deserves an explanation.
The amplitude out of the celestial equatorial plane is not zero in 2000. It is zero in 2003 for both the Sun and Earth.
The Sun and Earth are reasonably well locked in N-S excursion till 2005 when the deviation becomes more apparent.
I have not checked the NASA JPL free body motion of Earth because I figure it is possible to do reasonably accurate measurements of Earth’s position. I have checked the free body motion of the Sun but any stable orbit I can produce is not far off what JPL produce.
You would need to look at Vector data files for both Earth and the Sun from JPL to see how they move before 2000. JPL may have made some adjustments then. I know the ICRF has been changed from time-to-time. The current ICRF3 was adopted in 2018. And I have no idea if this altered much.
When I do my analysis of Sun and Earth, I use the Observer Table with the Sun as target and Geocentre as the observer. That means I can just select distance and declination as output so Horizons is doing a lot of the grunt work.I use the vector table of the Sun for velocity so I can predict solar activity.
Chart 1 is the first time I have plotted the Z axis for both the Sun and Earth on the same plot. Until then I did not know that they were essentially aligned in 2000. I did know Earth moved in and out of the equatorial plane but did not know how much relative to the Sun until plotted.
I see that the periodicity of the cyclical curve of [Sun-to-Earth distance] is about the same as that of the Sun’s sunspot activity (~11yrs), at least for the period 2000 – 2030.. that’s curious! – so it seems that there may be times when this Effect is ‘in phase’ with the Effect that Sunspot Cycles have on Earth’s Temperatures & we’ll get a measure of ‘Constructive Interference’ i.e. higher ‘peaks’ & lower ‘lows’, & there may be times when this Effect is ‘out of phase’ with the Sunspot Cycle’s Effect so we’ll get some ‘Destructive Interference’..? – So this Effect simply adds to the ‘chaoticness’ of the already chaotic Nature of the Sun’s Effects on Earth’s Climate!
The amplitude of solar activity is well correlated with the square of the difference in the actual velocity of the CoM and its average velocity. If the Sun has a near circular orbit near average velocity, the solar activity is low. Average velocity is 12.6m/s so the minimum velocity around 2012 of 10.8m/s was not a lot lower than average; resulting in low solar activity for the SC24 that peaked in 2015.
The timing of the peak solar activity is delayed by a few years from the minimum and maximums. I now know that delay is due to the tidal influence from Mercury generating a spin torque.
The most circular orbit of the Sun occurs when Neptune and Uranus are in direct opposition to Saturn. The influence of these three planets then cancels. The last near perfect alignment of Uranus and Neptune in opposition to Saturn was in 1649. The alignment impacted on three solar cycles. The middle one was almost zero. The last near alignment was in 2007 and resulted in SC24 being low.
At first it was hard to believe your 1W/m2 Chart 2 claim so I calculated it as 0.9 W/m2, close.
Noting the decent timing of your Chart 2 peaks with solar minima, I was motivated to convert your distance anomalies into an adjusted TSI timeseries and compare it to daily NASA CERES 1au TSI, which is mostly based on SORCE and TSIS-1 TSI from LASP, for each September 21 equinox.
Given the 1au distance is 149,597,870,700 meters and the solar constant at 1au of 1361 W/m2, the sun’s intensity is calculated as Isun=1361*(1au)^2. The new adjusted TSI is Isun/(1au+anomaly)^2.
Your adjusted TSI is shown below with Sept.21 equinox CERES TSI data, having diverging trends.
TSI an the Sun motion are linked as you have verified.
The solar intensity pears are well correlated to the square of the difference between the Sun velocity and its average velocity. However there activity is displaced in time from the peaks derived from this relationship. The tidal torque pumping explains that time difference. It is a big machine that takes rio to accelerate and decelerate.
So we have a multiple energy systems, coupled, and powered by a chaotic power source.
And there are those the believe a step wise computer model based on a 25 km grid can provide any useful insights?
So is this the known variation of _earth_’s orbit due to different cycles of planets exerting varying amount of force on earth?
Here is an interview 278 on Tom Nelson podcast explaining the leading role of the Sun in the terrestrial climate, e.g. solar activity and solar inertial motion on the terrestrial environment. https://www.youtube.com/watch?v=SawIG4TNpHQ
In the above article, immediately under Chart 2 “Sun to Earth Distance Change at Sep Equinox”, this statement is found:
“The range of the anomalous distance shown in Chart 2 is sufficient to alter the peak solar intensity by 1W/m² for the selected day.”
Since the current annual average solar irradiance (at TOA) is about 1361 W/m^2 with an annual variation in solar irradiance at TOA of about 7% between aphelion and perihelion, equivalent to a variation of about 94 W/m^2, I should be concerned about a 1 W/m^2 variation that can take five or more years to be realized???
Get real!