Guest Post by Willis Eschenbach
My mind runs to curious corners of the climate question. I got to thinking about how little the atmospheric CO2 level has changed over most of the last two thousand years. Here is the CO2 data from ice cores (colored dots) and from the Mauna Loa CO2 measuring stations (red/black line).

Figure 1. Ice core CO2, and Mauna Loa instrumentally-measured CO2.
Note that there is good agreement between the thirteen different ice cores, as well as good agreement during the period of the overlap between the ice core and the instrumental CO2 data.
Looking to see how the CO2 related to the temperature since the year dot, I took that CO2 record and I overlaid it on the Ljundqvist reconstruction of the temperature variability of the extratropical northern hemisphere from 30°N to 90°N. It is a decadal average record that goes from the year 1 to the year 1999. I also added in the recent Berkeley Earth decadal averages for the period since the end of the study, for 2000-2009, and 2010-2019. (Because one is a proxy record and the other is an instrumental record, I have variance adjusted the Berkeley Earth record to match the variance of the proxy record over the period of their overlap, which is from 1850 to 1999. This is the same procedure that Ljundqvist used for the black dashed line in his reconstruction.)
Here is that graphic.

Figure 2. Ljungqvist decadal temperature reconstruction 90-30°N, to which I’ve added ice core and instrumental CO2, as well as the two final decades of Berkeley Earth mean 90-30°N temperatures (blue circles). The ice core data is a lowess smooth of the individual ice core data points shown in Figure 1.
In Figure 2, we can see the early “Roman Warm Period”, which lasted up to about the year 200 AD. Then temperatures dropped until about the year 500 AD. After that, the world warmed up again to the “Medieval Warm Period”. Then the temperatures cooled to the “Little Ice Age” which ended about the year 1700 AD, and finally, temperatures have warmed in fits and starts for the three centuries since the Little Ice Age.
Here are my questions about this historical temperature record:
• Why did the temperature start dropping after the Roman Warm Period? Why didn’t it just stay warm?
• Why did the cooling start in 200 AD, and not say in the year 600 AD?
• Why did the temperatures start warming around 550 AD, and continue warming up to the Medieval Warm Period peak at around 1000 AD? It could have stayed cold … but it didn’t.
• Why was that warming from 550 to 1000 AD, and not from say 800 to 1300 AD?
• What changed in ~ 1000 AD to flip the earth from warming to cooling?
• What caused the seven hundred years of steady cooling from about 1000 AD to the depths of the Little Ice Age, where temperatures bottomed out around 1700 AD?
• Why was that cooling from about 1000-1700 AD, and not e.g. 1250-1850 AD?
• Instead of stopping at the year 1700 AD, why didn’t the world keep cooling down to real glaciation? What flipped the earth from cooling to warming? Given the Milankovich cycles and the lengths of the other warm interglacial periods, we’re overdue for another real ice age.
• Why didn’t temperatures just stay at the 1700 AD temperature?
• Why has it warmed, in fits and starts, from the Little Ice Age up to the present?
Here’s why all of that is important.
NOT ONE CLIMATE SCIENTIST KNOWS THE ANSWERS TO THOSE QUESTIONS.
Not one.
And from Figure 2 above, it is quite clear that the answer is not “CO2” …
Without having enough understanding of the climate to know the answers to those questions, there is absolutely no way to say that the recent warming is not merely more natural fluctuations in the earth’s temperature.
Speaking of fluctuations, I note in Figure 2 that the Earth’s extratropical northern hemisphere surface temperature has wandered around in a range of about 1.5°C over the last 2000 years. The earth’s surface temperature is on the order of 288 kelvin, so including the variance adjustment, this represents a temperature variation on the order of one percent over a two-thousand-year period … to me, this is the most interesting thing about the climate—not how much it changes over time, but how little it changes.
This thermal stability is not from thermal inertia—the land in each hemisphere swings about 15°C over the course of every year, and the ocean in each hemisphere swings about 5°C every year.
I say that this surprising and exceptional stability is due to the thermoregulatory action of emergent climate phenomena including dust devils, tropical cumulus fields and thunderstorms, the El Nino/La Nina mechanism that pumps excess heat to the poles, tornadoes, and hurricanes. I describe this theory of emergent thermoregulation in a series of posts listed in my 2021 index of my posts here in the section called “Emergence”. These act to keep the earth from either excessive warming or cooling.
Anyhow, that’s where my mind wandered to most recently, to the question of two thousand years of temperature and how it’s not ruled by CO2 …
Today was sunny and the ground was dry for the first time in a while, so I spent far too much of the afternoon underneath my truck unbolting and taking off the camper hold-down brackets. There’s nothing like discussing the concept of excess rotational inertia with a recalcitrant bolt, a bolt located where you can only get one hand in to twist the wrench, to give a man a reminder of his lack of importance in this miraculous world of wonders … made me glad I own an impact wrench, but there are places where it can’t go.
But as the I Ching says, “Perseverance furthers”, and after using end wrenches, sockets, breaker bars, deep-wall sockets, two impact wrenches, and saying more than a few bad words, I got it all done.
Best of the sunshine to everyone, life is good,
w.
Technical Note: Some folks have asked, is it OK to splice proxy and instrumental data, or more generally, any two datasets purportedly measuring the same phenomenon?
My answer is absolutely yes, IF two conditions are met:
Condition 1: There is enough temporal overlap between the datasets to verify that the two datasets are giving the same answer. In this case, for example, there is an overlap between instrumental and proxy data for both the ice core/instrumental CO2 and the proxy/instrumental temperature records. Figure 1 shows the ice-core/Mauna Loa CO2 overlap. Here is a closeup of the overlap between the Ljungqvist temperature and the Berkeley Earth variance-adjusted temperature.

Figure 3. Closeup, overlap of Ljungqvist temperature and variance-adjusted Berkeley Earth temperature
Looking at Figures 1 and 3, you can see the overlap in each case and verify that the proxy and instrumental records are clearly in good agreement.
Condition 2: The fact of the splice is made clear and evident, with no attempt to hide it. In both graphs, the overlap period is clearly shown, and the existence of the splice is acknowledged in the text as well
Here’s a post of mine which discusses splicing, appropriately entitled “Splicing Clouds” …
Usual Note: I can defend my own words. I can’t defend your interpretation of my words. So when you comment, please quote the exact words that you are referring to.
If the CO2 data any good (definitely no temperature variability causation) but it looks that about 25% of the atmospheric CO2 is the man-made.
This means that CO2 is a positive feedback knob not for the global warming but for the increase in food production leading to more human resources devoted to development of technology and the rapid industrialisation, rather than toiling in the fields for the purpose of food production.
Modern world with the CO2 at ~280 ppm would be technologically still stuck in the middle ages as is desired by the GW would be dictators.
Ergo: we need more and not less CO2.
“there is absolutely no way to say that the recent warming is not merely more natural fluctuations in the earth’s temperature.”
…
Yes there is. The slope and magnitude of the recent warming exceeds any of the natural fluctuations prior to 1850 in the graphic.
But human CO2 emissions before ~ 1950 were relatively insignificant:
http://jo.nova.s3.amazonaws.com/graph/chem/co2-emissions/global/global-co2-human-emissions-250-years-30-50-85.gif
They started to rise around 1850
http://www.solarnavigator.net/images/Global_Carbon_Emission_by_Type.png
INSIGNIFICANT before 1950
The globe COOLED from 1940s-1970s just as CO2 emissions were starting to rapidly increase
Anyway, there is absolutely no evidence that increased atmospheric CO2 causes warming.
Let’s see if you can provide any….
1… Do you have any empirical scientific evidence for warming by atmospheric CO2?
2… In what ways has the global climate changed in the last 50 years , that can be scientifically proven to be of human released CO2 causation
1000 million tons per year in 1910 is “insignificant?” LOL @fred250
Fred250, keep in mind the Titanic was a COAL burning ship that sank in 1912
So what. !
The big rise in CO2 emissions started around 1950
All this is immaterial any, because CO2 does not cause warming.
Roger, the temperature in the Little Ice Age bottomed out around 1690. Forcing from the change in CO2 didn’t even hit one tenth of one measly W/m2 until 1830. In other words, temperatures were rising for 130 years before even the most trivial increase in CO2, much less a significant increase.
w.
Big numbers confuse Rogered, don’t they, you poor thing.
Roger is a very knowledgeable fellow, Fred….
In his own mind !
If he is so “knowledgable” ..(LOL)
….why is he ducking an weaving presenting any actual evidence ?
The main increase started 1950
The globe COOLED from 1940s-1970s just as CO2 emissions were starting to rapidly increase
Just like in the Vostok cores……
Peak CO2 was ALWAYS followed by cooling..
Peak CO2 was incapable of maintaining the temperature.
noted that you COWARDLY AVOIDED the two questions
Let’s try again..
1… Do you have any empirical scientific evidence for warming by atmospheric CO2?
2… In what ways has the global climate changed in the last 50 years , that can be scientifically proven to be of human released CO2 causation
Roger:
“They started to rise around 1850”
As did SO2 emissions. The burning of fossil fuels produces both CO2 (warming (?), and SO2 (cooling) emissions
This graphic give one a better idea on the past temperature …. much better than the Ljundgvist reconstruction because it is global: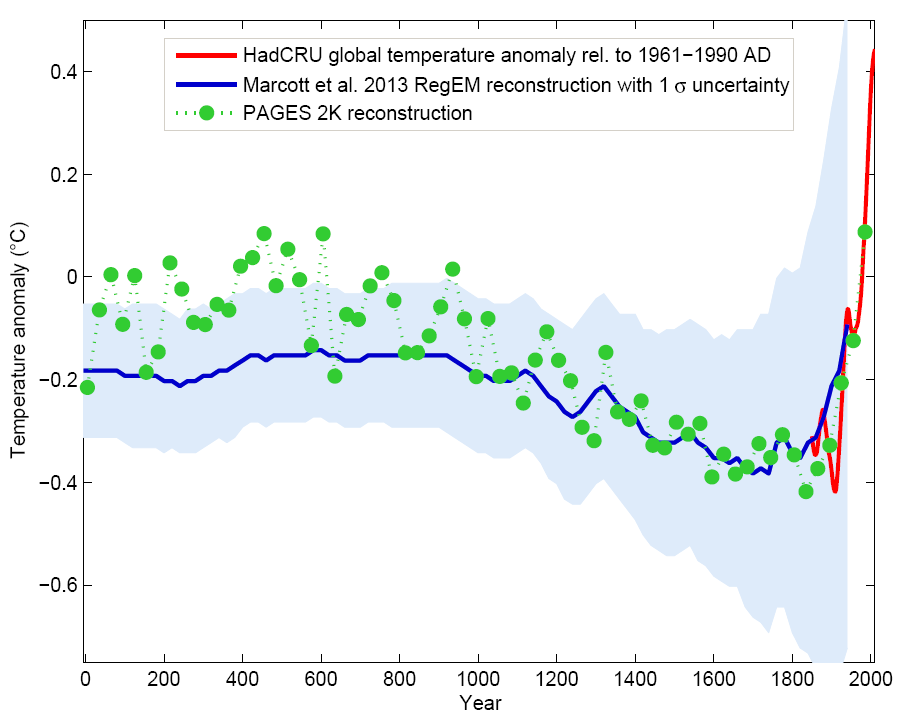
WRONG,
It is based mainly on treeometers and this is totally UNRELIABLE
The original Marcott did not have the up-tick at the end
PAGES 2K made predetermined decisions, upside down proxies, the whole AGW farce at work.
https://climateaudit.org/2014/10/07/pages2k-vs-the-hanjiharvi-reconstruction/
https://climateaudit.org/2018/10/07/pages2k-2017-south-america-revisited/
You cannot put instrumental temperature again proxies, especially not FAKE fabrications like HadCrud..
Ie there is ABSOLUTELY NOTHING correct about that graph.
This one uses much more realistic because of the points made above
More on the Pages2K travesty.
A bunch of AGW cultists COOKING the tree ring proxy data.
https://andymaypetrophysicist.com/2020/05/02/global-mean-temperature-flattens-the-past/
Marcott was based on more than tree rings.
Roger, PAGES2K is junk … my suggestion is before you look more out of touch, that you read every post linked to here.
w.
Please Willis, don’t post a link to another rejectionist (note non-use of “De Nile” word) blog. Show me YOUR post about PAGES2K. Something not in your echo chamber.
But rogered, all you have is your echo chamber, between your ears.
Just regurguitating the AGW cult mantra.
You are nothing but a low-end nil-science AGW shill. !
Roger, I’m sorry, but the fact that you don’t like someone’s analysis doesn’t make them a “rejectionist”. That, as you likely know, is an “ad hominem” argument, where you whine about the person who has presented facts and ideas rather than actually engage with the facts and ideas.
As I said above, READ THE DAMN POSTS AT THIS LINK, and don’t bother coming back until you can find something actually wrong with the facts as presented by Steve McIntyre.
w.
Come on rogered,
Tell us what we “reject” that you can provide solid scientific proof for..
You now have three questions you can run away from.
Roger, if you reject what McIntyre writes, then you reject one of the persons with more knowledge of the use of statistics in paleo records than about the whole climate science world.
It only shows that you aren’t interested in science, only what you like to believe.
For your record, the graph you uploaded from Marcott is a falsification of the data: he changed the time stamps of the data series, which turned the latest data upside down:
https://climateaudit.org/2013/03/16/the-marcott-shakun-dating-service/
Just one of the many examples that shows that the current climate “science” has very little to do with science…
Willis, I think you are throwing around the work “junk” a bit loosely, here. McIntyre points out a couple issues in the Arctic temperature reconstruction in PAGES2k, and it looks like all of those issues have been corrected. PAGES2k presents a global reconstruction that is unquestionably a more appropriate choice for the comparison you’re presenting here than a mid-to-high northern latitude reconstruction.
Additionally, if you dislike PAGES2k so very much, just pick a different global reconstruction, one that you find more palatable, and then justify your choice.
(One wonders why Steve McIntyre has spent literal decades of his life nitpicking others’ studies instead of using his superior knowledge of paleoclimate to produce the perfect reconstruction himself, but I digress.)
Another SCIENCE-FREE load of blah, blah from DAILY-FAIL. !!
Matches many other non-tree proxies.
GET A LIFE and a brain, twerp
Weekly, what Ferdinand said above in spades. Look, you’re free to ignore the NINE posts that McIntyre wrote about a myriad of problems with PAGES2k, after all, he’s only the world’s expert on paleo reconstructions … but rest assured, if you ignore McIntyre, I’ll ignore you.
w.
Willis, I have not ignored McIntyre’s posts on PAGES2k, my contention is that the errors he identified do not invalidate the reconstruction. I also propose that if you’re not happy with the PAGES2k reconstruction, you should just pick a different global reconstruction to use in your analysis. Using a mid-high latitude NH reconstruction is not appropriate for the comparison you’re trying to do. If you believe there are no global reconstructions that meet your expectations, then you should conclude that the analysis you wish to perform is impossible given the quality of available data, rather than presenting an analysis that is using inappropriate data.
Also, I will say, again, that if McIntyre is truly the world’s leading expert on paleoclimate reconstructions, we should all petition him to publish his own reconstructions. His enumerable talents must surely be wasted on nitpicking at other people’s work instead of making substantive contributions of his own to the field (or maybe he has published his own reconstructions, and in my ignorance I’m simply unaware of them).
McIntyre clearly thinks the errors he identified invalidate the reconstruction as do I. You don’t. So … since you’re obviously more of an expert than McIntyre, how come YOU haven’t published your own reconstruction? Your enumerable talents must surely be wasted on nitpicking at other people’s work instead of making substantive contributions of your own to the field …
With regards to my analysis, it covers a quarter of the planet. I’ve shown that natural temperature variations in most of the developed world are quite large, and occur without corresponding CO2 changes. Sorry that’s not enough for you. Ask me if I care.
w.
Weekly_rise March 24, 2021 9:22 am
Weekly, after looking at lots of reconstructions, I felt that the Ljungqvist reconstruction was typical. However, if you’d prefer a more global look, here’s the Loehle reconstruction compared to the Ljungqvist reconstruction. The Loehle reconstruction, A 2000-Year Global Temperature Reconstruction Based On Non-Treering Proxies, is far more global, using:
Here’s how that one compares to Ljungqvist.
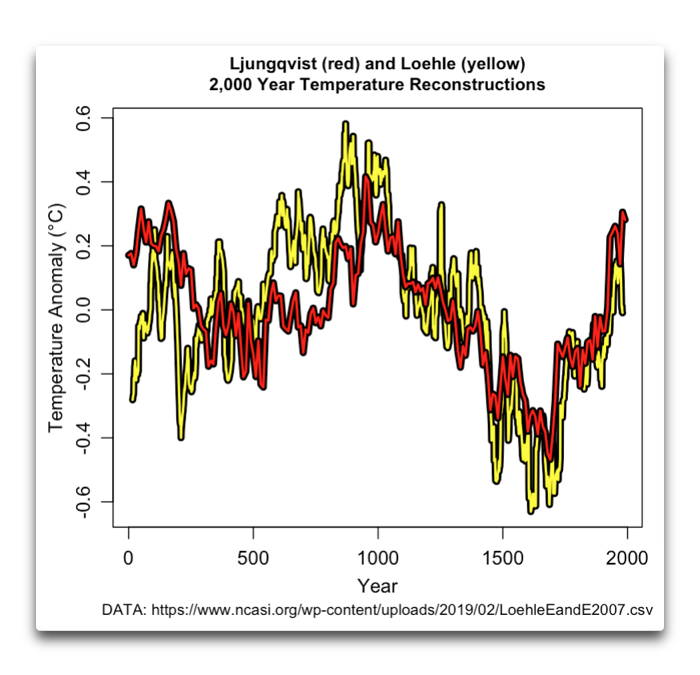
As you can see, using the much more global reconstruction doesn’t make one bit of difference to my analysis.
Happy now?
w.
Not quite happy. As I understand it, the graphic you present was prepared by centering both reconstructions on their long term mean values. This process makes the Ljungqvist reconstruction artificially warmer. Without recentering on the long term mean the two reconstructions compare thusly:
So, the two really don’t compare well at all. And the problem is quite bad because Ljungqvist is a NH reconstruction and, as you say, Loehle’s is global. It should certainly show dampened amplitude of MWP and LIA in reference to Ljungqvist’s, since these phenomena were expressed most strongly in the NH.
Loehle’s reconstruction does not vindicate your choice to perform this analysis using a NH reconstruction.
Weekly_rise March 24, 2021 12:34 pm
Oooh, some anonymous internet popup without the albondigas to even sign his own name is unhappy that I recentered the data … despite the obvious fact that the recentering makes no difference in the slightest to the point I made in the top post.
As to whether the LIA and the MWP were “expressed most strongly in the NH”, every proxy reconstruction gives different answers to that question. And Loehle’s, while much more global, is (like every such reconstruction I know of) more NH weighted than SH.
Nobody knows which reconstruction is better. Heck, if you use Mann’s reconstruction it shows basically no temperature variation at all globally … so what?
I can see now that you are unhappy with Steve McIntyre, you’re unhappy with his analysis of PAGES2K, you’re unhappy with Ljungqvist, you’re unhappy with Loehle … are we seeing a pattern here?
I’m done with your childish whining. If you don’t like my analysis, do your own damn work and submit it. That way, I can stand back and do what you are doing, making meaningless objections that have nothing to do with the main point of my analysis.
That point is that temperature naturally varies quite widely regardless of CO2, so there is no reason to assume that the last 100 years of the 300-year recent temperature rise are human-caused. You know, the 300-year rise that is clearly visible in both the Loehle and the Ljungqvist reconstructions that you are bitching about.
Me, I’m done with you. Go bother someone else, your objections are a sick joke.
w.
“I can see now that you are unhappy with Steve McIntyre, you’re unhappy with his analysis of PAGES2K, you’re unhappy with Ljungqvist, you’re unhappy with Loehle … are we seeing a pattern here?”
I’m not unhappy with McIntyre, nor am I unhappy with his analysis of PAGES2k. I agree with some of it, disagree with other elements of it. I’m also perfectly happy with Ljungqvist, I just don’t think his NH reconstruction supports the analysis you’re trying to do. I’m… skeptical of Loehle, but that’s irrelevant given that Loehle’s reconstruction doesn’t look anything like Ljungqvist’s, so your argument that the two show the same thing is plain wrong.
“I’m done with your childish whining. If you don’t like my analysis, do your own damn work and submit it. That way, I can stand back and do what you are doing, making meaningless objections that have nothing to do with the main point of my analysis.”
My objections are anything but meaningless. The entire thrust of your analysis is that there are large natural variations in the paleoclimate record that are decoupled from CO2 concentration. My objection is that your analysis design is unable to support such a conclusion.
You aren’t obligated to defend your work, but it’s something you ought to be willing to do, in my view (after all this site lauds skepticism as an ideal, does it not?).
Both Loehl and Ljundqvist show large natural variations in the paleoclimate record that are decoupled from CO2 concentration. They both support my conclusion.
That fact is obvious to any sane person who looks at them … obviously except you.
The fact that you don’t see that means that it is useless to talk to you, because no matter what I might show, you’ll raise yet another meaningless objection.
And of course that means nothing to you, because you don’t have the stones to sign your own words. That means you’ll never have to back them up or take responsibility for them, so you can say (and have said) any stupid thing that crosses your mind without fear of having to stand behind it.
Go away. Don’t go away mad. Just go away. You are worse than useless, you are a pebble in the shoe of progress.
w.
And the original Marcott , before he got in with the AGW crowd, showed no uptick at the end
Please try to keep up !
Show me where the Marcott study has been retracted.
But it should be..
https://wattsupwiththat.com/2013/03/16/mcintyre-finds-the-marcott-trick-how-long-before-science-has-to-retract-marcott-et-al/
A lot of NON-science happens in “climate science™.”
Roger, the number of climate studies that should have been retracted but never were is endless, starting with the original hockeystick paper and going on forever.
w.
http://rogerpielkejr.blogspot.com/2013/03/fixing-marcott-mess-in-climate-science.html
Tree rings 😉
Trouble with tree rings is that there has been a DIRE shortage of atmospheric CO2 for nearly all the time period that they are being used.
That means they will not respond much to temperature differences.
Hence you get these silly flat lines.
CO2 deprived tree rings. !
Subsistence level until recently.
Cannot respond well to temperatures and water changes
Hence near flat lines.
We all know what happens to Pine trees when they get a bit of extra CO2 🙂
You quote an opinion article by Renee Hannon on a blog by Andy May?….. ROTFLMAO, please try a reputable source of scientific data, not some fly by night blog.
ROFLMAO, the opinon of Roger T , AGW shill, while trolling on a science blog
Please find a reputable source, one that has at least a basic comprehension of science.
This blog is for news an opinion. It is not about science.
Certainly none of your comments are about science.
And yes this is a science blog.
Your comments show you didn’t know that.
“this is a science blog.”
…
ROTFLMAO
..
What is it’s impact factor?
Why is it that scientists that regularly publish in the journals do not write articles for this blog?
Because journals bring in money and prestige. (oh look how many publications he has !)
…and they don’t have to pass a proper scrutiny, just pal-review.
.
Many magnitudes more than yours. !!
Most read SCIENCE BLOG in the world.
But then, you have NO SCIENCE.. just waffle and Blah..
.
441,418,306 hits
WTangoF, Roger is making a valid point you might not agree with, while your bullying is infantile Fred. WUWT isn’t Redditt…
Roger is trolling..
Roger does NOT have a valid point.. and he knows it.
Roger Taguchi March 22, 2021 4:59 pm
Oh, please, Roger, STOP THE DAMN AD HOMINEM ATTACKS. I have no idea who Renee Hannon is, but who he/she is and where they publish is meaningless.
If you can’t attack their ideas, don’t bother us with your whining about who and where. Deal with the what, or people will just continue pointing and laughing at your pathetic comments.
w.
“The original Marcott did not have the up-tick at the end”
That would be the bogus, bastardized up-tick at the end.
The up-tick would look more like a flat line at the end if actual temperature readings were taken into account.
The up-tick at the end is a distortion of reality created to sell the Human-caused Climate Change narrative.
Reality doesn’t have an up-tick at the end, it has a flat line.
And another reconstruction that actually match history
Poor trees, they have been so deprived of CO2, for so long, that they basically flat-lined at subsistence level. .
Surge of CO2, and look at them go !!
Global temperature anomaly is an agglomerate of shifting data locations in growing cites with a growing Urban Heat Island anomaly. If you look at an individual location with long data record , despite increase in the urbanisation you might be tempted to reexamine your views.
One geographical location does not represent global temperatures.
One set of tree rings does not represent global temperatures.
Marcott had ocean sediment cores in addition to other proxies.
But the tree rings dominated.
Ocean sediment proxies clearly show a warmer past in most parts of the world, as do peat bogs and most other proxies.
Nope
Yep, Marcott is a MESS. !
And yes, ocean sediment proxies clearly show a warmer past in most parts of the world, as do peat bogs and most other proxies.
Sorry if you were ignorant of that fact.
As do peat proxies
Neither do all the homogenized constructs taken predominately from selected well-settled urban stations.
If you want to fiddle around with temp records and come up with anything meaningful, you have to do comparisons of changes within each climate.
Climate by climate – there are hundreds of them.
And then there is no point in averaging all the changes within climates to arrive at some eureka! figure, because all the climates each have their own vastly different and varying characteristics.
Look at what apples with apples comparisons tell you, not tubs of apples mixed with a number of oranges compared with other tubs of apples + differing numbers of oranges
Yep, how many different biomes are there scattered over the earth. Climate is usually the one main factor in determining what grows and prospers in any given biome. Many, many different parts to the whole and averaging them all together with anomalies simply hides the variance in the earth’s overall climate.
Watching the poleward migration of species is a good indicator of warming climate. Alligators in Tennessee ?
https://www.fox13memphis.com/top-stories/alligators-migrating-spotted-in-west-tennessee/722517780/
Trees under retreating glaciers is also a good indicator
And In the past, the range of American Alligators extended just up into Virginia, mostly in the area of the Great Dismal Swamp.
https://thevlm.org/herp-highlight-1-american-alligator/
So , A Nothing post from rogered
Satellite data (i.e. RSS and UAH) are global.
And UAH shows warming ONLY at El Nino events.
Nope: https://woodfortrees.org/plot/uah6/plot/uah6/trend
YEP, only at El Ninos.
Your trend only exists because of those El Ninos.
No warming from 1980-1997
No warming from 2001-2015
Try not to remain so dumb and ignorant little trollette. !
Now, back to CO2 warming.. which doesn’t exist..
1… Do you have any empirical scientific evidence for warming by atmospheric CO2?
2… In what ways has the global climate changed in the last 50 years , that can be scientifically proven to be of human released CO2 causation?.
Posting graphics with no attributions is bogus
The data is straight from UAH, idiot !
Noted yet again that you slither around presenting any evidence
Its quite funny ! 🙂
Want to try again
1… Do you have any empirical scientific evidence for warming by atmospheric CO2?
2… In what ways has the global climate changed in the last 50 years , that can be scientifically proven to be of human released CO2 causation?.
And the satellites will transmit that at a selected point in time the temperature at Cape Horn was 3C, while the temperature at Subic Bay was 34C.
So the “average” was 18.5C
Now, what exactly are you gonna do with that gem of “constructed data” Roger?
How are we in any way enlightened? About anything?
The average is calculated over ALL geographic points, not the two you cherry picked.
How many climates are accounted for in all these geographic points Roger?
More tellingly, how many climates (and which ones) AREN’T accounted for?
The tree rings will fix that 😉
Roger, it appears that your theory is “the largest fluctuation in any natural dataset has to be caused by humans” …
w.
The historical record does not show any point where we have proxy temperatures where CO2 is 400 ppm.
Ice core data has BOTH measurement of CO2 and oxygen isotope variation. Both of them are matched in time due to location in an ice core slice.
SO WHAT,
There is no evidence that increased atmospheric CO2 causes warming
Peak CO2 in the Vostok cores was always followed by cooling.
1… Do you have any empirical scientific evidence for warming by atmospheric CO2?
2… In what ways has the global climate changed in the last 50 years , that can be scientifically proven to be of human released CO2 causation?
Having an atmospheric CO2 concentration of 400ppm is a MASSIVE BENEFIT for ALL LIFE ON EARTH
There is NO DOWNSIDE.
800, 1000 would be even better. !
You are overlooking the fact that the farther back in time one goes, the more smoothed the data becomes as a result of increasing error in dating and diffusion of the proxy being used to estimate temperature. To make the claim that you did, it would be necessary to use a moving average with the number of samples increasing the closer one gets to the present day. I doubt that you have done that. I doubt that anyone has.
Depth of the ice core sample doesn’t increase the error in dating. Ice accumulation rates do not vary much. In fact volcanic eruptions identifiable in the cores allow matching various core’s dating.
.
Except when its colder or it warmer.
”“there is absolutely no way to say that the recent warming is not merely more natural fluctuations in the earth’s temperature.”
…
Yes there is. The slope and magnitude of the recent warming exceeds any of the natural fluctuations prior to 1850 in the graphic.”
So because the ”slope” differs that’s proof it’s not natural?
You can’t be serious. There are more than just single cycles taking their turn to influence the climate. There are many. Sometimes they interact with each other. If they are both peaking at the same time the slope will differ.
Show me where in the historical record the “rate of change” (aka slope) is equivalent to what is occurring today.
Ice cores don’t have that resolution……
Its irrelevant anyway.
The increased atmospheric CO2 we are lucky enough to have managed..
.. is totally beneficial to all life on Earth
IT IS A GOOD THING.. and we need MORE.
Take a close look at Willis’ Fig. 3. The periods right around 1700 and 1950 have temperature slopes very similar to what has been happening very recently. If you look at reconstructions going back farther in time, you will similarly see periods where there are even steeper slopes, despite the older data effectively having a low-pass filter applied. You argument is not supported by actual data.
Roger, there were many times in the past that temperature changes of several degrees in only a few years to a few decades were happening. The current temperature change is not unusual at all:
https://www.pnas.org/content/97/4/1331
The main problem is finding reliable, high resolution proxy’s for past temperatures…
Nice work Willis!
Some small addition:
The high resolution (~20 years) DSS ice core of Law Dome spans about 1000 years and shows the global cooling influence of the LIA in its CO2 levels around 1600 (from the work of Etheridge e.a., 1992 on three Law Dome ice cores):
http://www.ferdinand-engelbeen.be/klimaat/klim_img/law_dome_1000yr.jpg
The drop is about 8 ppmv for a drop of about 0.8 K or again around 10 ppmv/K…
Although one need to be careful, as the temperature proxy (δD or δ18O) measured in Antarctic ice cores is mainly from where the snow is formed, that is near Antarctica, where temperature changes are twice as fast than global…
Anyway, the current solubility of CO2 in the seawater surface changes with about 16 ppmv/K, by far not enough to explain the current 120 ppmv increase…
Ferdinand
As I remarked above, increasing temperatures impact more than just CO2 out-gassing from water.
Area of termite expansion would cause a LOT of extra CO2.
Also, warming would bring a lot of frozen organic matter towards decaying.
The Carbon Cycle gets invigorated and LIFE ON EARTH becomes more abundant.
Clyde and Fred, the whole biosphere (plant uptake and decay, bacteria, molds, insects, animals,…) currently is more sink than source for CO2.
The earth is greening (see the NASA chlorophyll measurements).
That is also proven by the oxygen balance: currently the whole biosphere is a source of O2, thus a sink for CO2, as these two are 100% linked with each other.
http://www.bowdoin.edu/~mbattle/papers_posters_and_talks/BenderGBC2005.pdf
Thus even if bacterial or insect life doubled and lots of permafrost melted over the past decades, the net result is that plant growth was way faster growing in CO2 uptake than the increased CO2 releases…
OT a bit but a good story lead: John Cook webinar using gamification –
https://us02web.zoom.us/webinar/register/WN_oBLeiQBJRVmLgVEAYpIVLg
Seems like a Billy Madison type of performance.
How to make people DUMBER !!
Did not the same pattern ‘happen’ millions of years ago – ie. temps increased and then some many centuries later atmospheric CO2 conc increased.
These are the questions that must be asked over and over again of these pseudo scientists that proport CO2 is toxic and nothing but pollution.
Thanks for another great post Willis. I have one question. You say that based on Milankovic we are overdue for another glaciation but I seem to recall others here have claimed we might have 5-10k more years of interglacial. Could you please elaborate on your comment about that?
The current interglacial has lasted far longer than the previous ones …
Regards,
w.
And THANK GOODNESS FOR THAT.
Let’s hope it stays slightly warm, like now.
This Modern Slightly Warm Period could do with a bit more warm..
Somewhat more worrying is also the fact that each ice age seems to be getting colder and longer…global warming is our friend!
Is the period from the start of an interglacial to the start of the next interglacial getting longer, or is it oscillating with the next period potentially being shorter? Some peaks are higher, some lower, there is not enough data to say if they are truly alternating, with the next one due to be warmer like the Eeemian? There does look to be a worrying trend in the depth of the glacial periods. Three in a row at least (better than one in a row, I guess). Significant? Not sure.
Thanks for the chart. It looks to me as though the period peak-to-peak is significantly variable. I guess I can see what you’re saying about the period of time that the Holocene has been near its peak, compared to the Eeemian and especially compared to two and three interglacials ago. On the other hand, four interglacials ago, it looks to be wider. You could add that to your list of rhetorical questions–why is it not marching along with a fixed beat of exactly 100,000 years, or exactly some number?
I’d be curious to see this chart overlaid with the various Milankovic cycles to see if that might give some insight about why the period is variable.
For what it’s worth (exceedingly little), Wikipedia would have us believe that “insolation will be dominated by changes in obliquity, and should not decline enough to permit a new glacial period in the next 50,000 years.”
https://en.wikipedia.org/wiki/Milankovitch_cycles
The present-day Holocene, also referred to MIS 1, is currently longer in duration than MIS 7e and several of the older interglacial periods. It is similar in duration to MIS 5e and 9e, but not as long as MIS 11, so far. Plot of the past interglacial warm period durations from Berger, PIGS dataset. https://agupubs.onlinelibrary.wiley.com/doi/full/10.1002/2015RG000482
NOT ONE CLIMATE SCIENTIST KNOWS THE ANSWERS TO THOSE QUESTIONS.
I’d add another question,
How do we know when this interglacial is ending?
A chart from “Climate Change in Prehistory” by Burroughs clearly shows that the recent Little Ice Age was the coldest period in the past 6,000 plus years. My observation is that another LIA will put us over the cliff.
Willis simply identifies the “why” of the motivation behind the paleo-climate fraudsters like Mann and the rest of the hockey team of fraudsters and charlatans in their efforts to hide unexplained by CO2 natural variability.
Let’s have some fun and do real science.
What causes the glacial/interglacial cycle? What cause cyclic abrupt climate change? What is cyclic abrupt climate change?
When was cyclic abrupt climate change discovered?
Is cyclic abrupt climate change important from a practical standpoint?
The Greenland Ice Sheet data GISP-2 is the most accurate temperature that shows abrupt cooling and warming in the Northern Hemisphere.
Willis’ idea of comparing actual temperature say the last 11,000 years to ‘climate theory’….And asking climate theory to explain the past…. Is a great idea.
Park worrying about CO2. What caused the past temperature changes? Anything to worry about? Besides abrupt temperature change.
This graph shows sudden drops and spikes in temperature. And this data has been smoothed because the climate community has no idea what is causing the past cyclic abrupt changes.
Northern Hemisphere, Greenland Ice sheet Project 2, temperatures, for the last 11,000 years.
http://www.climate4you.com/images/GISP2%20TemperatureSince10700%20BP%20with%20CO2%20from%20EPICA%20DomeC.gif
Greenland Ice sheet projects 1 (This core found the abrupt climate change)….
Climate Scientist did not believe it could be true.. Had zero explanation for what was observed.
The Greenland Ice sheet because of the much higher snowfalls than in the Antarctic, captures much higher resolution temperature changes.
The Greenland Ice Sheet 1 data showed weird unexplainable increases and decreases in temperature had happened, in the Northern Hemisphere.
And these weird abrupt…. Cyclic changes in temperature were not captured in the Antarctic Ice sheet data.
Because Climate Scientists…. did not and still do not have …..a physical understand/a concept that could explain the fact that there is cyclic super large abrupt climate change in the Paleo record.
The Younger Dryas for example. The 12,900 BP, abrupt cooling, from interglacial warm to glacial cold with 70% of the cooling occurring in less than a decade…. then the Northern Hemisphere 1200 year later quickly warming up to the warmest in this interglacial period.
The warming is again interrupted with 8,200 before present abrupt cooling period which had the same profile as the YD abrupt climate change except it has roughly half has sever and lasted for 400 years.
The past interglacial periods have all been less than 10,000 years. This interglacial period is almost over. And something will cause it to be over.
They did not show the abrupt climate change in analysis of the GISP1 data. Look at the last 10,000 year!
Interpretation of Greenland Ice Sheet Temperatures Last 100,000 years from the Greenland Ice 1 project ice core data.
http://pro.unibz.it/staff2/fzavatti/corso/dahl-jensen.pdf
Climate community decided to drill another Greenland Ice Core…… because the Climate Community did not believe the data and did not want to go public ….. As there is no explanation what happened in the past.
It looks like that CO2 record over the past 2,000 years has just turned up a hockey stick and this time it is a genuine one, unlike Mann;s notorious fabrication.
Willis wrote:
I can guarantee the tropical ocean was no warmer than 30C and the sea ice interface was no warmer than -2C. So the term “world” is used loosely.
None of the temperature data offered covers the southern oceans where the vast majority of the energy that drives the global climate gets stored and released.
I don’t have the faith in ice-core data that most do. It’s just too even. There may be an unknown process where co2 concentrations are equalized after a certain period of time.
But besides that, if the Milankovich cycles do not explain the temperature wave then there is only one thing left that can…..Sol., or at least other extra-planetary influences.
Ice-core V stomata..
Mike, sorry, the ice core data are direct measurements of CO2 in enclosed ancient air, be it a mix of ten to hundreds of years.
Stomata data are proxy’s with an inherent bias, as they grow over land where a lot of extra CO2 remains, depending of wind direction and what grows there.
If the proxy data differ from the ice core data over longer periods than the ice core resolution, the proxy data should be re-calibrated with the ice core data, not reverse…
The claim that:”not one climate scientist knows the answers” is highly misleading since many of them would probably dispute the validity of the questions. Take the first one for example, global reconstructions of past temperatures rather than just the northern hemisphere do not show a Roman warm period. Have a look at the 2019 Pages 2K reconstruction for example. So if there was no Roman warm period then there was no cooling afterwards and that question is moot.
Similarly Willis appears to have taken one of the more variable reconstructions to use as part of his straw man argument. Again if you look at the Pages 2k reconstruction there is significantly less variation to explain. And again if you read the Pages 2k Nature paper they state:
“Warm anomalies around 1320, 1420, 1560 and 1780 ce, cold anomalies around 1260, 1450 and 1820 ce and the periods of reduced variability during the overall cold seventeenth century and the relatively warm eleventh century are captured by both the reconstructions and simulations. These similarities between reconstructions and models suggest a dominant influence of external forcing on multidecadal GMST variability.
The data–model agreement is particularly strong between 1300 and 1800 ce. The weaker agreement before 1300 ce might be mostly explained by the reduced quality of volcanic forcing estimates used in CMIP5 during this period.”
So I suspect that many climate scientists would say that the following
1) The climate is noisey with natural variations of the order of +/- 0.3 degrees due to things like volcanoes and solar variability.
2) The better the understanding of past forcings the better the hindcasts of the global temperature is.
3) And while CO2 is not the only climate driver it is the only one we are significantly altering at the present time.
Pages2K is a mess, it relies on tree rings which are really bad temperature proxies.
The Pages 2K fabrication also does not match history
RWP existed, MWP existed.
No matter how much the AGW cultists try to get rid of them !
Fortunately, we live in a period just a little bit warmer than the coldest period in 10,000 years.
Let’s call it “The Modern Slightly Warm Period”
More warming.. a plus.
Slipping back down into another LIA.. a major bummer !!
.
And yet not one of the AGW shills here can present any actual scientific evidence of warming by atmospheric CO2..
Would you like to try ?
1… Do you have any empirical scientific evidence for warming by atmospheric CO2?
2… In what ways has the global climate changed in the last 50 years , that can be scientifically proven to be of human released CO2 causation?
I am curious. Can you describe a feasible experiment that would prove whether or not the earth is warming due to rising atmospheric CO2? There is no control planet where we can leave CO2 levels alone while increasing the ones here. And if we stop emitting CO2 and wait for levels to decrease we would have to wait several thousand years before seeing a result.
We know that CO2 is a greenhouse gas since that can be easily demonstrated in the lab. And we know that human activity is increasing atmospheric CO2 levels due to the burning of fossil fuels (isotope ratios of carbon demonstrate that). We also know that global temperatures are warming. You might want to claim that this is just coincidence but then you have a lot more work to do since you now need to explain why CO2 behaves differently in the lab than in the atmosphere and also you need to find an additional source of heat to explain global warming.
So you admit you have NO EVIDENCE.
That is a start !
Glass bottles in labs show CO2 is a RADIATIVE gas.
You have to explain why you think a glass bottle represents the atmosphere !!
Devoid of all mass air movement, conduction and all other aspects of a real atmosphere.
Greenhouse effect from CO2 has never been observed or measured anywhere on the planet.
Vague, short term correlations between CO2 and temperature are meaningless.
The small amount of warming is easily explained by several REAL things. eg solar, seismic, natural cycles.
No need for your ARGUMENT FROM IGNORANCE, which is what you were bound to put forward. (all you have)
Humans are responsible for some 15% of the HIGHLY BENEFICIAL RISE IN CO2 that supports ALL LIFE ON EARTH.
We should be CHEERING !
We should also be HIGHLY THANKFUL for the coincidental slight rise in temperature out of the COLDEST period in 10,000 years.
Now, instead of waffling mindlessly, how about you answer the questions !!!
Or NOT !
“We know that CO2 is a greenhouse gas since that can be easily demonstrated in the lab.”
Is the earth a greenhouse?
Derg,
Essentially it is. It is about 30 degrees warmer than it should be based on a simple radiative model using the Stefan Boltzmann law. You can call that a greenhouse effect since that is the commonly accepted term and is understood to mean that some atmospheric gases absorb infra-red light and re-radiate it in all directions warming the lower atmosphere.
NO EVIDENCE CO2 has anything to do with it.
The “common ” understanding is actually a LACK of understanding.
Thermalisation and bulk air movement immediately cancel any piddling, mythical so-called “back radiation”.
Only way you can even measure CO2 radiation is by creating a negative temperature gradient using super-cooled sensor.
Even then, the mean free path of CO2 radiation at one atmosphere pressure is only 10m or so.
CO2 is a TOTAL NON-EVENT
ATMOSPHERIC MASS retention of energy holds true or every planet with a substantial atmosphere…regardless of atmospheric content.
Izaak wrote:
The average surface temperature is simply the mean of the maximum ocean temperature of 30C and the minimum of -2C to arrive at 14C or 57F. Exactly as anyone with a basic understanding of temperature and energy would expect.
The surface temperature of earth is not the the result of some delicate radiation balance. It is controlled by two powerful thermostatic processes that limit the sea surface temperature to 30C in tropical warm pools across three tropical oceans and to a minimum of -2C at the sea ice interface at the polar oceans.
The “greenhouse effect” is just a fairy tale dreamt up by incompetents to fit their primitive world view.
Rubbish!
It essentially is?????
You are a lost cause.
.
Certainly its not a glass bottle !
With CO2 released in from a compressed tank. 😉
Clouds.
Seismic
Natural Cycles
None of that is evidence according to you since if I showed the a similar graph showing rises in both CO2 and temperatures you would say it was just a coincidence.
Poor izzy-unaware.
CO2 DOES NOT CORRELATE with real temperatures except over cherry-picked short periods.
Not in the Arctic, with 1940s temps similar to now.
Not anywhere in the NH for that matter, for the same reason
Not in Australia, where 1880-1910 temps were warmer than now,
CO2 was lower during the MUCH WARMER MWP and RWP
CO2 rose during the Holocene while temperatures FELL.
Not only that, but there is obvious CAUSATION between the correlations I have shown.
ie fewer clouds .. more sun, oceans heat basic observations back this up.
CO2 on the other hand, only has a scientifically unsubstantiated conjecture of any warming cause.,. never observed, never measured.
You and your AGW cronies have proven that time and time again.
As usual, you have nothing but mindless EMPTY non-science.
Further more, you obvious didn’t understand what I meant by your ARGUMENT FROM IGNORANCE.
And you still keep displaying it.
“Not in Australia, where 1880-1910 temps were warmer than now,”
Yes, the United States also shows a very warm period around 1880 which was just as warm as the 1930’s which would make it just as warm as today.
So the 1880’s seem to be a worldwide warm period, at least in Australia and North America (we have to include Canada in here!) 🙂
The AMO shows a very warm period in the 1880’s.
So we have a very warm 1880’s which cools down to a very cold 1910’s, and then the weather warms up through the 1930’s, reaching temperaures comparable to the 1880’s, then the temperatures cool from the 1940’s to the 1980’s, reaching the same level of cold as was reached in the 1910’s, and then the temperatures warmed from the 1980’s to the present reaching temperatures comparable to the 1930’s and the 1880’s.
So we have a cyclical climate movement that seems to operate within an upper and a lower limit, at least since the 1880’s.
The Hansen 1999 US chart shows this pretty well, although it cuts off the warm 1880s.
The AMO chart shows this pattern a little better:
It’s not any warmer now than in the recent past. This means CO2 is not a major factor in determining the Earth’s temperture because CO2 has increased over the decades, yet the temperatures are no warmer now than when CO2 was not a factor in the issue.
Izaak, you ask: “Can you describe a feasible experiment that would prove whether or not the earth is warming due to rising atmospheric CO2? “
I would respectfully submit that the onus is on Climate Alarmists, not Sceptics, to design the experiment, because they are the ones that are making the claim.
Furthermore, such an experiment should be capable of:
a) differentiating between man-made warming, and natural changes in the temperature of the planet.
b) identifying whether increased CO2 in the atmosphere is the cause or the effect of temperature changes.
As you rightly say, we are hampered by not having a duplicate planet on which to perform the experiment, but that inconvenient limitation has not stopped Climate Alarmists from making extravagant claims (that we are all doomed) based on poorly designed models and questionable historical data. The onus lies with the Alarmists to justify their position, not on the Sceptics to refute it.
What really worries me is your statement “…and if we stop emitting CO2 and wait for levels to decrease we would have to wait several thousand years before seeing a result.” Is that the “official” CMIP party line? ie de-industrializing the world will not decrease CO2 levels “for several thousand years” but we should do it anyway?
Speaking personally, I would prefer to ignore all concerns over global warming rather then send the population of the world back to the subsistence farming levels of the middle ages, because if man made global warming is a fantasy then we will have trashed civilization for no good purpose, and if it does exist then we are still likely top be no worse off than we would be under de-industrialization.
There have been experiments done.
And they all show CO2 has basically ZERO WARMING EFFECT. !
What experiments?
Walter, last I read was that human activities contributed about 3% of atmospheric CO2 content.
That’s not driver, that’s a putter.
We might be contributing 3% of the atmospheric CO2 content but that is still 100% of the annual rise. And 3% rise per annum over a hundred years amounts to a substantial increase.
WRONG,
Nearly all our contribution to atmospheric CO2 gets absorbed
I’m glad you think its 100% though, because with China, India, and many other places building coal fired power stations at a fast rate, there will continue to be a strong increase in CO2 emissions.
And there is absolutely nothing you and your heathen, anti-life AGW cult can do about it. 🙂
How do you know that ALL of the annual CO2 increase is from human activities?
Do you reckon outgassing from the oceans that are 70% of the global surface has taken a well-earned break?
That is relatively simple. Firstly the best estimates for human emissions say that we emit twice as much CO2 each year as ends up in the atmosphere. Secondly isotope analysis shows that the additional CO2 in the atmosphere is coming from fossil fuels. So if you want to claim otherwise you have to say where all the human emitted CO2 is going and why the outgassing from the oceans has the same isotope signature as fossil fuels.
Nature emits FAR MORE CO2 than humans do, and its increasing as the Carbon cycle invigorates.as the planet warms slightly.
The best estimates say about 15-25% of the HIGHLY BENEFICIAL increase is due to human released of sequestered carbon back into the shorter term Carbon Cycle that supports ALL LIFE ON EARTH.
Again, you have ABSOLUTELY NO SCIENCE to back up anything you say
There is NO EVIDENCE of warming by atmospheric CO2
I would STRONG suggest you learn some basic science before you post even more garbage. You are making yourself look like an ignorant fool.
Here is a start for you …
https://edberry.com/blog/climate/climate-physics/preprint3/
Fred, Berry is completely wrong, as he used the reverse residence time throughout his reasoning
You only may do that, if all fluxes are unidirectional (like a lake with river in, river out) but never if some fluxes reverse as is the case for the very large seasonal fluxes…
“Secondly isotope analysis shows that the additional CO2 in the atmosphere is coming from fossil fuels.”
Really? The δ13C of incremental atmospheric CO2 is -13 per mil. The δ13C of burning fossil fuels is -28 per mil.
Jim, about 2/3 of all original CO2 molecules from human fossil fuel use are distributed over other reservoirs and replaced by CO2 from the other reservoirs within a year and the part that goes into the deep oceans doesn’t return within hundreds if years…
Ferdinand,
I do not understand your point. Are my values correct or incorrect? I said nothing about what was going where. As you will probably recall, I can demonstrate that the incremental atmospheric CO2 has had an average net δ13C of -13 per mil throughout the period of observations for any time frame long enough to even out the effects of ENSO. If I remember correctly, you concluded that this must be a coincidence. Did I mention that the Law Dome data shows exactly the same value (based on a linear Keeling plot)? Is that a coincidence too?
Let’s test my “model” of a constant δ13C of -13 per mil for all incremental atmospheric CO2 and see how it performs against the “standard model run” of the very sophisticated (complex) model of Keeling et al (2017), available here: https://www.pnas.org/content/pnas/114/39/10361.full.pdf.
Reference is Figure 1A in the paper. Their model was initiated in 1765 using CO2 of 278 ppmv and δ13C of -6.4 per mil. They then used an average of the Scripps observations from Mauna Loa (MLO) and South Pole (SPO), with the seasonal cycle removed, so we need to do the same for selecting the appropriate CO2 values (though averaging two sets of observations is not something I would normally choose to do).
February 1980 was the first month for which both sites had CO2 and δ13C observations by Scripps:
MLO CO2 was 338.6 ppmv and δ13C was -7.56 per mil
SPO CO2 was 336.1 and δ13C was -7.48 per mil
Averages: 337 ppmv and -7.52 per mil
Keeling et al standard model run predicted a δ13C of about -7.75 per mil.
Constant δ13C model of -13 per mil since 1765 predicts a δ13C value of:
((278*-6.4) + ((337-278)*-13))/337 = -7.56 per mil.
December 2013 was the last month of Scripps observations used in their model:
MLO CO2 was 398.0 ppmv and δ13C was -8.42 per mil
SPO CO2 was 394.1 and δ13C was -8.30 per mil
Averages: 396 ppmv and -8.36 per mil
Keeling et al standard model run predicted a δ13C of about -8.78 per mil.
Constant δ13C model of -13 per mil since 1765 predicts a δ13C value of:
((278*-6.4) + ((396-278)*-13))/396 = -8.37 per mil.
Note that even after adding further complexity to their model, it still predicted too low a δ13C value in December 2013. Still a coincidence?
Here’s the data I’ve got …
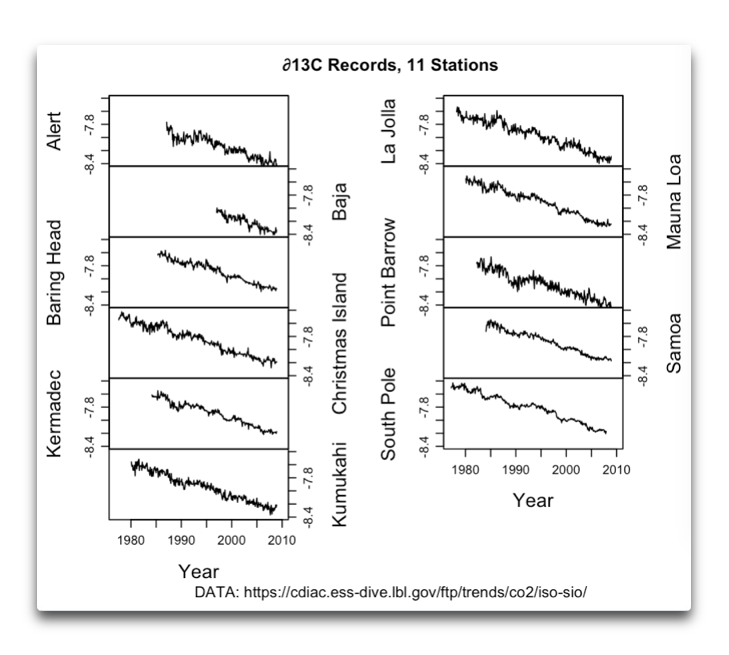
w.
If you also have the CO2 data to hand, also with the seasonal cycle removed, you can generate a so-called Keeling plot. You plot δ13C against 1/CO2. I can supply the mathematical basis and/or links to examples, such as the Law Dome data. If the source(s) of additional CO2 has/have a constant net δ13C content, it will plot as a straight line with an intercept equal to the δ13C value. Here is an example for the South Pole:
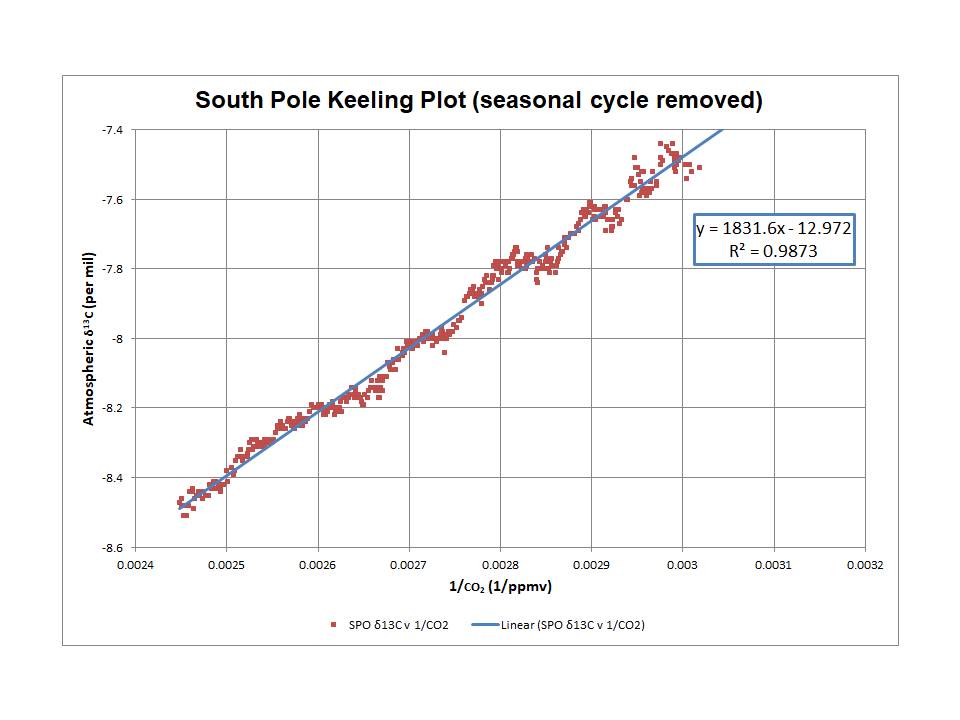
Jim, it is pure coincidence…
Let us start with the basics: humans emitted CO2 with an increasing amount per year. The increase is quite linear over the past 60 years of accurate data.
That makes that the emissions increased over time in a slightly quadratic way.
More…
As the CO2 pressure (pCO2) in the atmosphere increases, more CO2 is taken away by the oceans (and vegetation). That uptake is highly linear with the pressure difference between atmosphere and oceans, about 2% per year per ΔpCO2. For 100 μatm (~ppmv) above equilibrium some 2 ppmv/year is absorbed.
As the increase per year is linear, the sinks increase linear too and the net effect is that in the past 60 years the sinks remained around 50% of the emissions, with as net result that the increase in the atmosphere also is around 50% of human emissions…
It is pure coincidence that humans emitted CO2 in linear increasing quantities with as result a rather constant ratio between emissions and increase in the atmosphere.
If humans emitted a fixed quantity of CO2 at the current rate (~4.5 ppmv/year), the increase in the atmosphere would go on, but slower and slower as the sinks increase over time, until they are equal to the constant input, which is at 50 x 4.5 ppmv = 225 ppmv above the seawater pCO2 of around 290 μatm or in total 515 ppmv to reach a new equilibrium between emissions and sinks and thus zero increase in the atmosphere.
The same applies to the δ13C level. There are constant huge exchanges between the different reservoirs, where the deep oceans are the most important in this case: what goes into the deep is the isotopic composition of today, what comes out is the composition of ~1000 years ago (in both cases with some shift in composition at the air/water and water/air borders).
That makes, for the same reason as above, that a linear increasing amount of low-13C CO2 gives a linear decreasing δ13C level in the atmosphere with an apparently constant δ13C level of supply, which is a mix of the deep ocean cycle CO2 and human emissions.
If there was a constant human supply, the δ13C decrease would slow down, until a new equilibrium was established between emissions and deep ocean circulation δ13C.
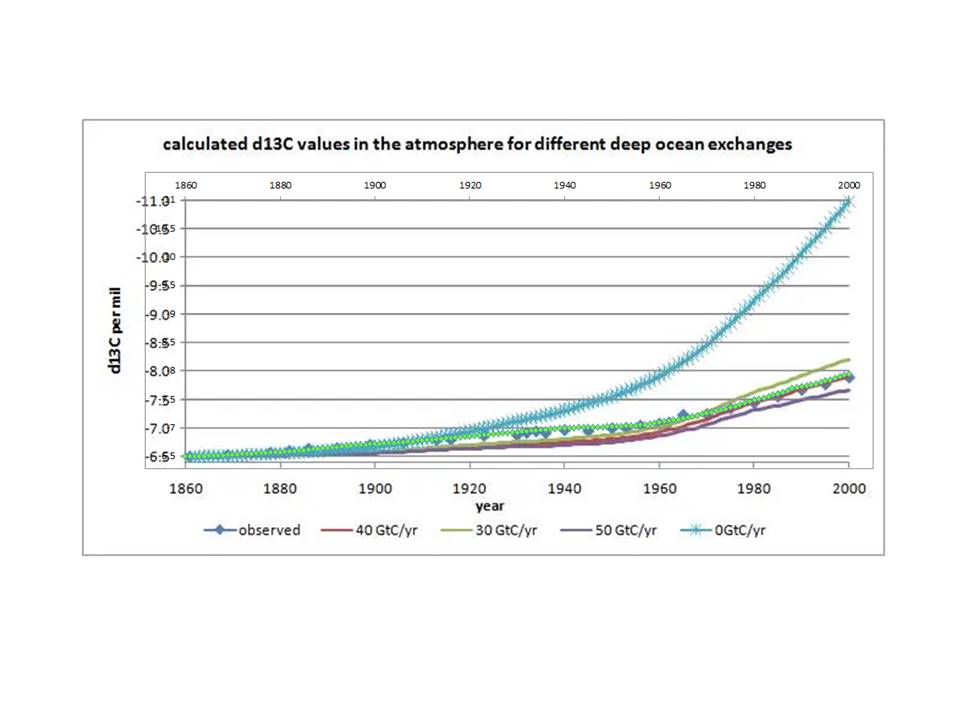
That fact can be used to reverse the equation and calculate how much CO2 per year is exchanged between atmosphere and deep oceans: that is around 40 GtC/year…
The discrepancy in the early years probably is from vegetation which was thought to be a small net source until the ’90s and an increasing sink thereafter.
Ferdinand,
So, you acknowledge that your model (the red line) has a “discrepancy in the early years”, which could also be phrased as “it’s not worth a damn from 1860 to 1970, but it’s pretty good after that”!
I showed you above how my simple model matched the observations far better than the model of Keeling et al (2017), prior their addition of yet more complexity in their model. According to you that was a “pure coincidence”. You failed to explain exactly which part of the process was the coincidence, but never mind.
Below, I demonstrate why my model (the bright green dots) is also much better than yours; perhaps that is a “pure coincidence” as well.
Jim Ross, the coincidence is that humans emit low-13C CO2 at a near linear increasing rate, all over the past 60 (or even 170) years.
The result of the constant increasing emissions (hardly influenced by the Covid pandemic) is a quite constant increasing CO2 increase in the atmosphere at a constant about 50% of human emissions and the rather constant drop of δ13C in the atmosphere.
If human emissions were constant at the current level, then after some years, the 50% ratio CO2 increase / emissions would drop to zero and the drop in δ13C would stop immediately, as that drop is a mix of the 40 GtC deep ocean water CO2 (at average -6.75 per mil, pre-industrial) and 9 GtC human emissions (at -24 per mil)…
Ferdinand,
I don’t see how we can have a rational scientific discussion while you keep diverting the discussion to your own (somewhat outdated, I’m afraid) hypotheses while ignoring the actual data. I would really like you to explain to me why my “model” provides a much better match to the observations than that of Keeling et al or your own model (I am looking for numbers, not unverified hypotheses). Simply saying that is it’s “pure coincidence” does not persuade me, nor does it facilitate rational scientific discussion, I’m afraid. I want to understand precisely why you object to a model that actually works in a predictive sense (and matches the observations).
Having said that, I am really pleased to see you still here, and still firing and on all cylinders.
The pCO2 of the oceans is increasing, so the oceans cannot possibly be the cause of the rise in atmospheric CO2.
CO2 concentration is rising and pH is falling. Our emissions are forcing the ocean into being a net sink, depite the fact it has warmed.

From here: https://www.epa.gov/climate-indicators/climate-change-indicators-ocean-acidity
Arguing that humans are not responsible for the increase in atmospheric CO2 level is Olympic standard denialism.
Mr., that is one of the few points where the “consensus” (I hate that word…) is right: humans are fully responsible for the current increase of about 40% CO2 in the atmosphere.
We are responsible for about 4% of the input, but 0% of the output Nature is 96% of the input and 98% of the output, 2% per year remains in the atmosphere or about half our input (as mass, not the original molecules!).
That is the mass balance and nothing can change that fact…
Also proven by every type of measurement:
http://www.ferdinand-engelbeen.be/klimaat/co2_origin.html
While we are responsible for the increase, the discussion is about the impact of the increase on temperature, which is a complete different discussion…
In my opinion, the impact is very low and most of the current increase in temperature is natural…
Denying reality!
No 8’clock curfew on WUWT ??
Might want to watch the traffic 🙂
Clams don’t like the CURRENT COLD SEA TEMPERATURES either
MUCH cooler seas than in MOST of the last 10,000 years
And the calms don’t like it.
https://notrickszone.com/2021/03/22/new-study-finds-clams-are-worse-off-in-todays-colder-waters-and-lower-sea-levels/
Interestingly, papers trying to reconstruct CO2 concentrations from plant stomata disagree with ice core data but fit temperature proxies with a lag phase – less stomata followed increase in temperature as increase in CO2 follows temperature.
Is all the data from ice cores just an equilibrium of how much CO2 will be maximally trapped over hundreds to thousands of years in ice loosing all excess above this concentration – how much that ever might have been – and the peak at the end have just not reached this equilibrium yet?
Like a function of temperature, pressure and solubility of CO2 in water/ice down in the glaciers?
Wonder how one could exclude this possibility. That those air bubbles represent unchanged air from millennia ago is just an assumption, isn’t it?
Oh, just saw that Mike brought that up already. Nevermind.
This old graph shows Vostok and Sargasso Sea temperatures with CO2. It corroborates the conclusion that CO2 does NOT cause significant climate change.
Those temps in red look like GISS or HadCrud.
So pretty much meaningless anyway.
1940s peak in NH , basically ZERO data for SH at that time..
Peak all gone. !
The red trace is not relevant to the purpose of this graph in this context.
True.
Not relevant to anything really ! 🙂
Has anyone proven that ice under heavy pressure can hold more than 280ppm of CO2? What if under the extreme pressure on low temperatures under the ice the CO2 is forced out? Are the concentrations of O2 and N2 measured as well, for comparison sake?
PCman999,
Where should that CO2 then go? Even if levels were the same as today (over 400 ppmv) during warm periods, that was redistributed over the cold ice ages, that would mean that the original levels with cold temperatures were below 170 ppmv and several plant species wouldn’t have survived with such low CO2 levels. And for each 110.000 years period back in time, the “peak” CO2 level with temperature should go down further, which is not the case…
One has deduced the theoretical migration of CO2 in ice cores by looking at melt layers, where any extra CO2 would accumulate in adjacent ice. The result: that would give a broader resolution of 22 years i.s.o. 20 years at middle depth and a doubling to 40 years at full depth. No big deal.
http://catalogue.nla.gov.au/Record/3773250
EVERY aspect of Climate Change from the Ice Ages to circa 1850 is related to SO2 aerosols from volcanic eruptions .After 1850, industrial SO2 has been added to the mix, and, after rising, current Clean Air efforts decreases are largely responsible for the rise in temperatures since then.
Volcanic eruptions produce both CO2 and SO2, with, as another blogger stated, the CO2 going along for the ride (and confusing everyone). .
.All of the above is so easily proven that I am continually amazed that no one,has seriously considered the role of SO2.in the atmosphere.. .
.,
Henry,
There is hardly any effect from volcanic SO2 on temperature. Even one of the largest events of the previous century, the 1991 Pinatubo eruption, did give a one-year dent of ~0.6 K and the effect disappeared completely in 3 years time. Most volcanic eruptions didn’t even reach the stratosphere and SO2 rains out in about 6 days, both for volcanoes and human emissions…
There is no evidence that human-derived SO2 is doing anything to the Earth’s temperatures, just like there is no evidence that CO2 is doing anything to Earth’s temperatures.
There *is* evidence that a *huge* volcanic eruption can affect the Earth’s temperatures for a short time before bouncing back to “normal” but human-derived SO2 is not in the same league with a huge volcanic eruption. Not even close.
You showed me your “proof” not long ago. That consisted of you correlating different volcanic eruptions with the temperature record. The only problem is you used the bogus, bastardized Hockey Stick temperature record for your matches. Your matches were made to a temperature record that is a distortion of reality. That’s makes your conclusions unrealitistic,imo.
People have been arguing that human-derived SO2 changes the Earth’s temperatures since the temperatures started declining from the 1940’s to the 1970’s, with some climate scientists voicing concerns that the Earth was about to enter another ice age in the 1970’s.
Human-derived SO2 was all the rage back then but there was never anything definitive ever produced confirming any of the claims. And then it warmed up, and climate scientists started demonizing CO2 as the cause. Claims are not evidence.
There is no evidence for Human-caused Global Cooling.
There is no evidence for Human-caused Global Warming.
That is the state of affairs as of today.
Most of the warming proposed is due to water vapor positive feedback. The self-styled “climate consensus” believe that warming induced by more CO2 is amplified because a warmer atmosphere will retain more water vapor = atmospheric humidity increases. The more humid atmosphere causes twice as much warming. So 67% of the warming is due to this amplification.
So.
Q: Do we have evidence for this positive feedback?
A: No we don’t. We have evidence for the opposite. Over the last 4 decades, in the Indo-Ganges plain more irrigation led to a 2% rise in relative humidity. This is associated with a 0.8C fall in average temperatures.
The greenhouse gas effect is like a villain in an old Western. It made hay while there were plenty of banks (grants) to rob but now it’s shot to pieces.
Willis,
Nice essay, thank you.
Couple of points.
Willis,
Another compelling post.
On ENSO, Dr.John Abbott and Jennifer Marohassy wrote a paper,”Forecasting Rain” in which they said,in discussing a ‘Test for the existence of Natural Climate Cycles’-
“While essentially ignoring the likely extra-terrestrial origin of the phenomena,the mainstream climate science community does take a keen interest in sea surface temperature anomalies particularly in the Pacific and in particular ENSO.
Recognising the global impact of this southern oscillation, but not the moon as a driver,the government funded scientists have been attempting to simulate ENSO using GCMs.
Despite a concerted effort and thousands of peer reviewed publications on the subject, the skill of the GCMs at forecasting ENSO remains poor; comparable to what could be achieved using the simple statistical models popular 30 years ago.
(H.Halide and P.Ridd,”Complicated ENSO models do not significantly outperform very simple ENSO models,” International Journal of Climatology,Vol.28,No.2 (2008) 219-233).
Arguably, the best forecasts of ENSO come not from GCMs or simple statistical models but from artificial neural networks(ANNs).
ANNs are massive ,parallel-distributed information processing systems with characteristics resembling the biological neural networks of the human brain.
They are a form of artificial intelligence and represent state of the art statistical modelling.
In contrast to GCMs that attempt to simulate and understand climate from first principles ANNs simply mine historical data for patterns.
Many leaders within the mainstream climate community are dismissive of ANNs and their application, claiming that because the climate is on a new trajectory statistical models, including ANNs are no longer applicable.
But if through mining historical records,ANNs can produce better ENSO and also rainfall forecasts,this in itself is evidence that natural climate cycles are still operating and are not on a radically new trajectory.”
(A.Wu.W.W.Hsieh and B.Tang,” Neural network forecasts of the tropical Pacific sea surface temperatures”,Neural Networks, Vol.19,No.2,(2006) 145-154).
https://wattsupwiththat.com/2021/03/21/sea-level-and-the-jersey-shore/
WITH REGULATIONS AND ENFORCEMENTS, WITHOUT A DOLLAR WE CAN CORRECT CLIMATE. During COVID19 PANDEMIC, #UNFCCC announced that they need $600 TRILLION to CORRECT CLIMATE.
http://www.airconditioningthemotherearth.com
AIR CONDITIONING THE MOTHER EARTH (Climate Change Third Group by Raveendran Narayanan)
3°C Reduction is possible by capturing DE-ICERS from Desalination SYSTEMS.
#IPCC_WMO
#NOAA #UNEP #UNFCCC
#EarthShotPrize2020
#UNEP2021PRIZE
#UNGLOBALCOMPACT
#raveendrannarayanan #HUMANRIGHTACTIVIST #airconditioningthemotherearth #WorldWaterResearcher
A fair amount of the CO2 content of the air bubbles in the ice cores, gets dissolved into the ice.
https://www.cambridge.org/core/services/aop-cambridge-core/content/view/16C2FF52DC79BA7A58AF069168183F1D/S0022143000033487a.pdf/co2_in_natural_ice.pdf
The modern process for determining ice core CO2 involves sublimating the ice. This liberates all of the CO2, that in bubbles in the ice and that which has gotten dissolved in the ice.
w.
“A sublimation technique has been developed to extract air samples from polar ice cores for subsequent simultaneous measurement of several trace gases by frequency‐modulated tunable diode laser absorption spectroscopy. This extraction and analysis technique is shown to be suitable as an extraction method for the determination of concentrations of the greenhouse gases CO2, CH4, and N2O in air samples of ∼1–5 cm3 recovered from ice samples of 10–50 g. Air samples from the Siple ice core have been analyzed covering the period between 1772 and 1973. In addition, a few samples from two different ice cores from Vostok station have been analyzed. Our results are in a good agreement with results obtained by other researchers using melting and crushing extraction techniques.”
https://agupubs.onlinelibrary.wiley.com/doi/abs/10.1029/98JD00686
So why no difference?
The more dramatic changes between atmospheric and bubble ice CO2 occurs during the firn densification process. Gases mix via diffusion prior to being trapped in bubbles. Pore spaces containing gases decrease from 40% volume to less than 10% volume. Clearly, atmospheric firn gases undergo expulsion and compaction changes prior to being trapped in bubbles.
Renee, Etheridge e.a., 1992, did measure CO2 top down from the surface to bubble closing depth in the pores and in the ice from closing depth further down in a Law Dome summit core. The CO2 levels in the remaining open pores at closing depth (LIZ, lock-in-zone) and the already closed bubbles were equal within the accuracy of the measurements (1.2 ppmv – 1 sigma).
Later analyses did show a fractionation of the smallest atoms and molecules like Ne and O2 (not CO2) just before bubble closing:
http://www.bowdoin.edu/~mbattle/papers_posters_and_talks/Closeoff_fractionation_EPSL.pdf
See table 1 for the relative fractionation compared to O2.
That does not rule out mechanisms happening over hundreds to thousands of years limiting the CO2 content deep down in the glacier.
If it warms it’s CO2
From volcanoes; and people
If it cools it’s aerosols
From other volcanoes
The end.
Of climate science
There’s no evidence that either human-derived SO2 or human-derived CO2 are having any effect on the Earth’s temperature.
It’s all pure speculation by those who promote such things. They have been speculating about these things for multiple decades and still there is no evidence. The evidence must be pretty hard to find, don’t you think? 🙂