Projects that forecast dire effects from the current warming receive Government funds, but no funds for answers about the causes of previous warming cycles that occurred before the Industrial Revolution 1760 – 1840.
By Ronald Stein
Ambassador for Energy & Infrastructure, Irvine, California
While the chart below suggests substantial warming since the 1600’s, humans cannot be blamed for any significant amount of warming until after about 1950, which is when atmospheric CO2 concentrations began to increase markedly.
So, how is it that the warming from about 1700 to 1950 was natural, but the warming before 1700 is not?
Discovery of the “whys” for previous warming cycles, like what occurred during the Roman and Medieval Warm Periods are unlikely to qualify for government funded research, so the easier route to funding is to enhance the seriousness of the need to prevent the ‘current’ warming cycle and its potential threat to humanity, the same humanity that endured previous warming cycles.

Almost all climate-change research is funded by government. That means you the taxpayer. Government has been on the global warming bandwagon from the beginning. If young climate researchers today want to build their careers, their chances of getting government funding for their proposals is directly proportional to how seriously they portray the threat of global warming. If their research project themes are skeptical of human-caused climate change, their chance of getting funded are great reduced.
In his 1961 Farewell Address to the nation, President Eisenhower warned us of the dangers of the trend toward Government-sponsored science. When politicians have the ultimate say over who gets money for what reason, you can suspect that political motivations and desired policy outcomes will inevitably result in biased research. Additionally, Eisenhower pointed out that scientists eager to keep the funds flowing might take control of public policy to benefit their own careers.
Unfortunately, very little of research funding goes toward understanding natural causes of climate change, like what occurred in the Roman and Medieval Warm Periods, and the warming from about 1700 to 1950 all of which occurred before the Industrial Revolution. Interestingly, that warming was natural during those periods, but warming since 1950 is not?
Why don’t more papers tackle the thorny issue of determining how much warming is natural versus anthropogenic? In contrast to the CO2-based theory natural climate change is largely not understood, unpredictable, and so researchers do not look there for causes of warming which may be the driving force for government funds to research solution for the doomsday forecasting.
Global Warming is the ultimate cash cow for climate researchers. The bigger the perceived problem, the more money agencies like NASA, NOAA, DOE, EPA, and NSF can get.
The modern-day blaming of weather events on human-caused climate change in the news reports, at a minimum, intellectually lazy, and is probably mor aptly described as journalistic malpractice and fearmongering. Admittedly, some in the science community have enabled this feeding frenzy.
The Press will not report on DATA or FACTS that counter the emotions as they are deemed as deniers of that emotion driving the public.
The news media are only interested in covering predictions of doom, which further amplifies the emotional bias. How could thinking people NOT be skeptical when it comes to the outlandish claims, we receive from the news media? Why then, does it seem to so many like our weather is getting worse? It is partly because alarmism pervades the news on an almost daily basis.
Poverty kills and forcing people to use more expensive energy will worsen poverty. Poverty, not global warming, remains biggest challenge.
Yes, fossil fuels are probably a finite source. But as they become scarcer, their price will rise, and other sources of energy will become economically competitive. Innovation will lead to new energy technologies. Because everything humans due requires energy, energy demand WILL lead to an energy supply.
Interestingly, regarding energy literacy on renewables and fossil fuels, it is not that we are stupid, we are too emotional. One of the principles of branding is that people do not buy WHAT you do, they buy WHY you do it. We make most of our decisions based on feelings and emotions, NOT data and facts.
The WHY in this equation is simple, as it equates to getting off fossil fuels to reduce emissions at any cost. Emotions takes it from there, and any data or facts to the contrary are categorized as deniers to the emotional decisions in play. Elected and appointed officials, and special interest groups, feed off the WHY for government funding, to reduce emissions at any cost, for votes and money.
Nothing seems to have changed since Former President Eisenhower pointed out 60 years ago that scientists eager to keep the government funds flowing might take control of public policy to benefit their own careers.
Ronald Stein, P.E.
Ambassador for Energy & Infrastructure
http://www.energyliteracy.net/
Plus or minus 0.1K temperature uncertainties since Roman times?
Please mark me down as skeptical of this claim.
Error bars range +/- for the RWP peaks is 0.4K, ie ~+/-0.2K.
Year 1, they go from -0.2K up to +1.8K, which is +/-0.2K (I misinterpreted the tick marks).
Even at 0.2K, I would remain skeptical.
Some proxies are capable of high resolution, but the tight MoEs largely result from averaging anomalies.
Such averaging does not reduce uncertainty, as is commonly (and wrongly) believed.
True. But a graph with every proxy and its error bars would be so busy and messy as to be hard to read.
Mann’s spaghetti HS tree ring graph was thus able to hide the decline.
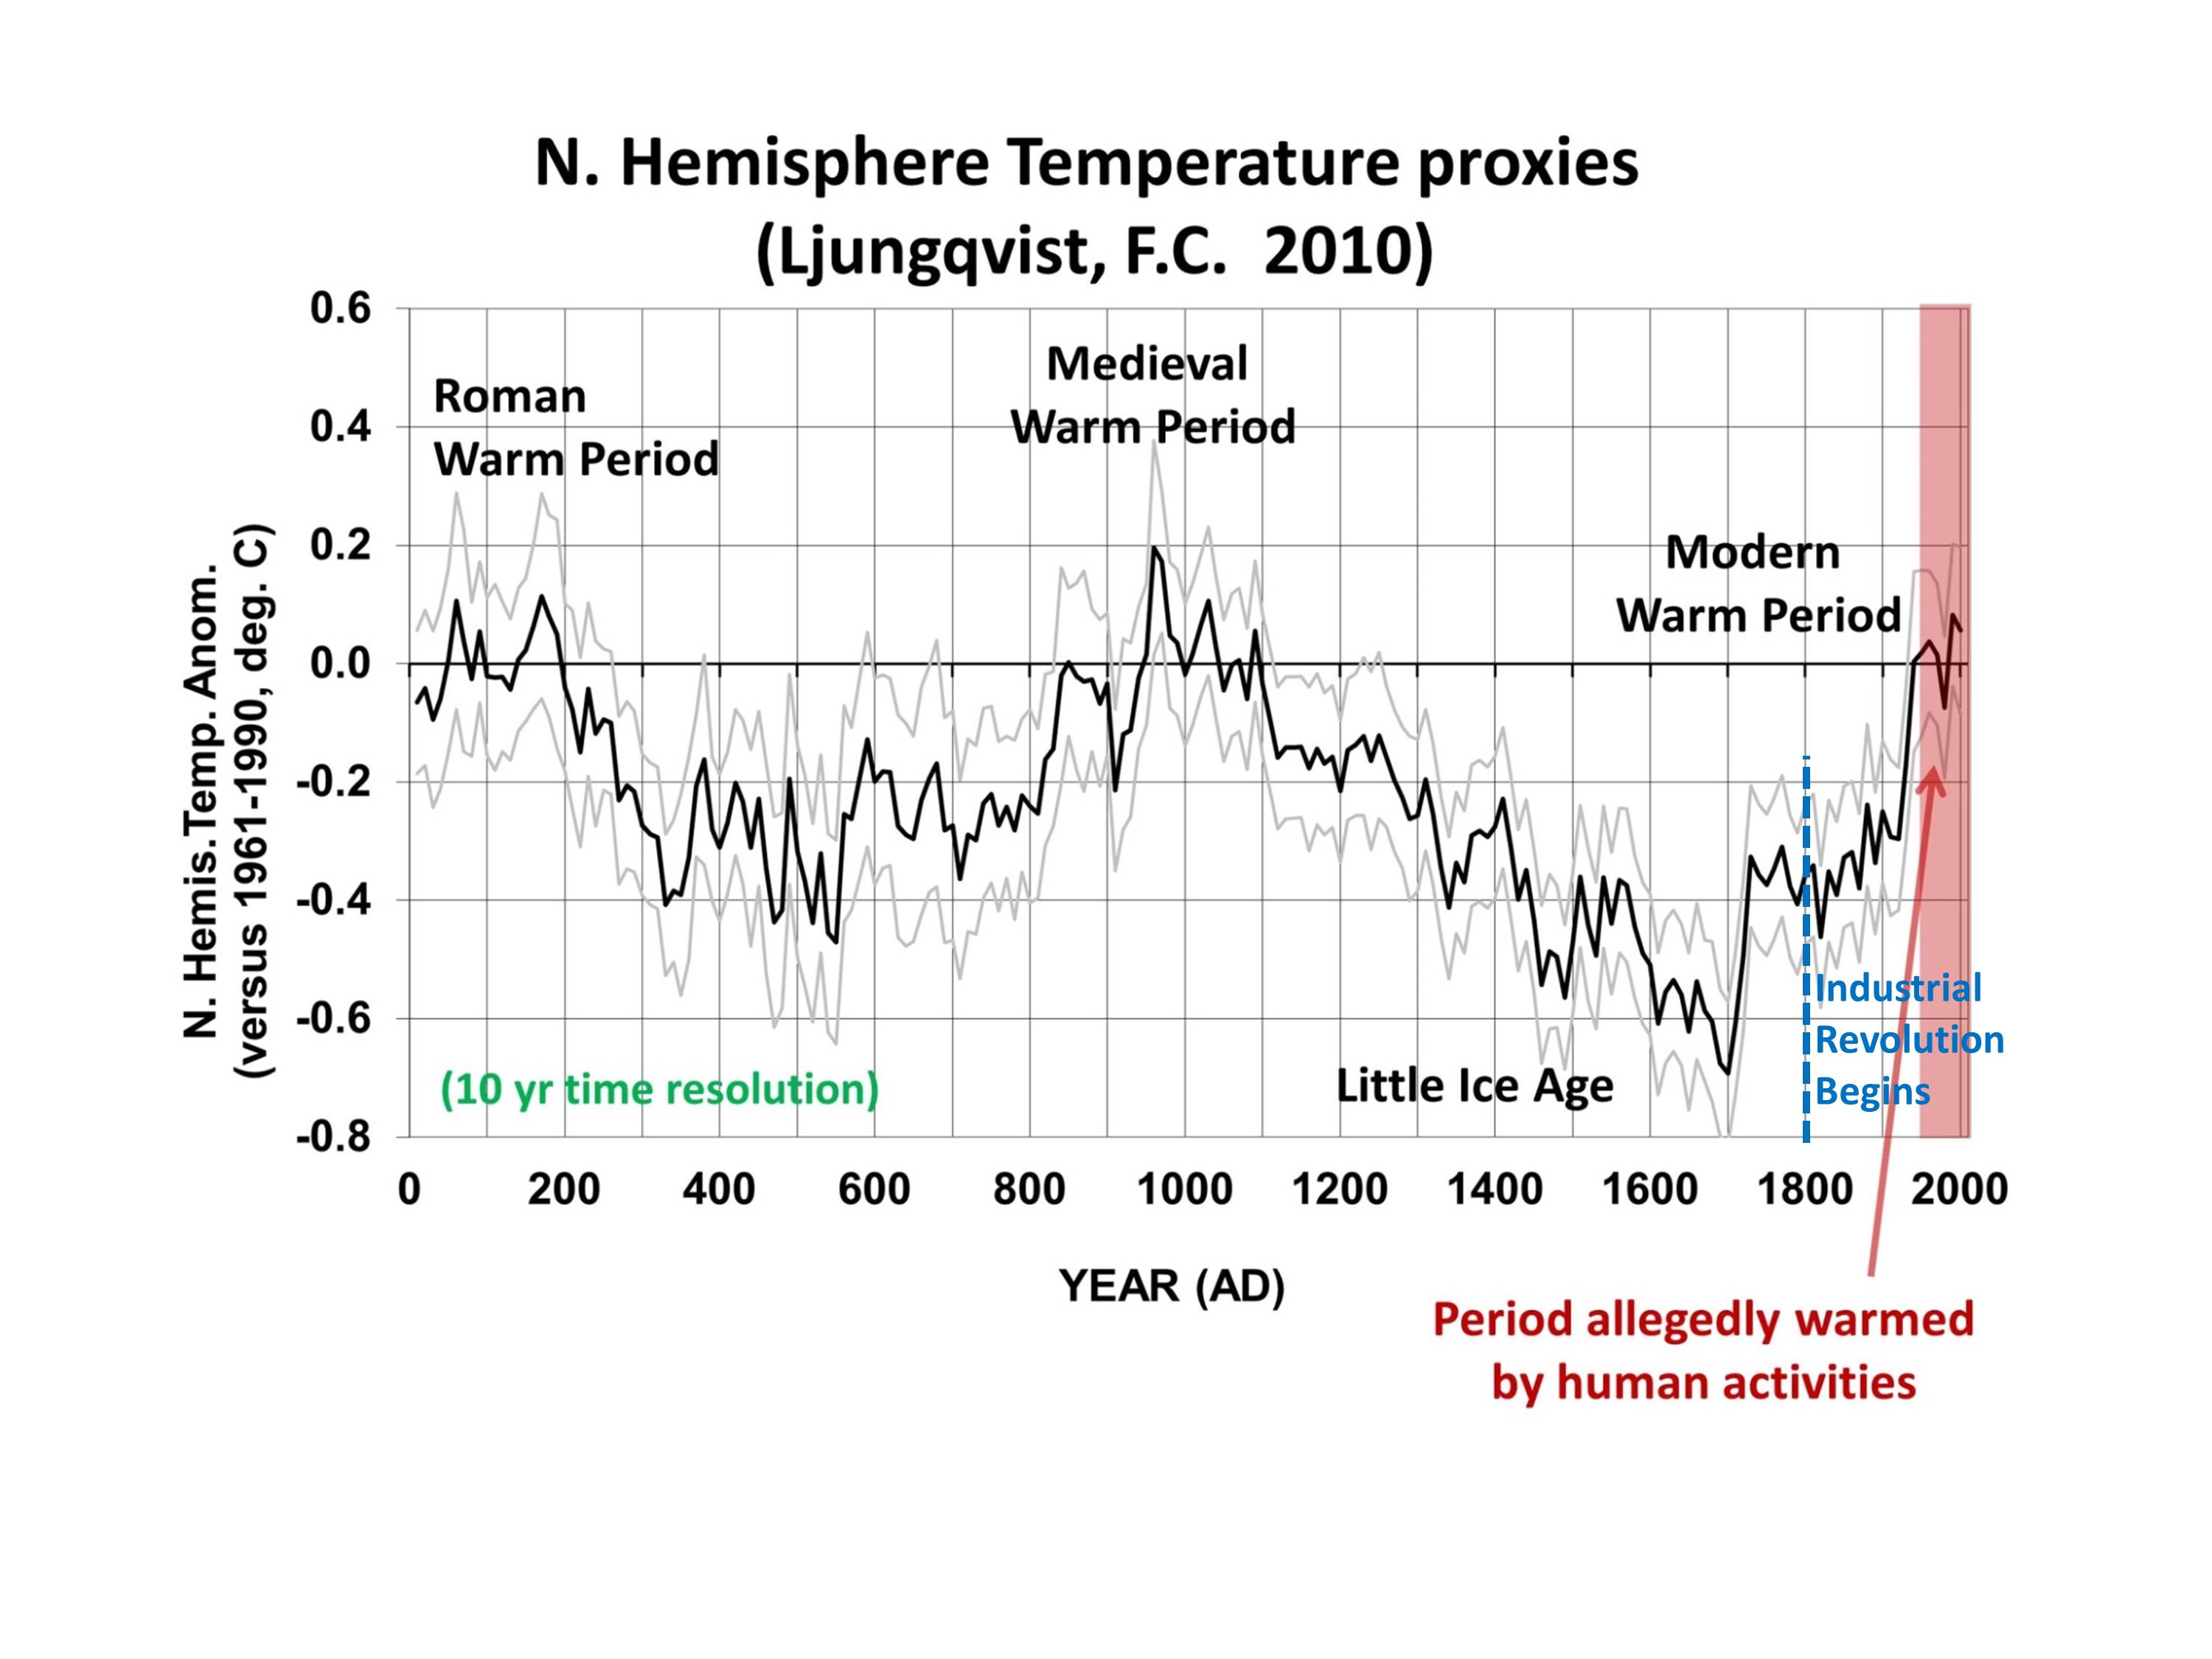
Speaking of hiding things, I’m surprised neither you nor Monte commented on the “Modern warm period” on that graph or the “Period allegedly warmed by human activities”. You made several comments about uncertainty but ignore the elephant. Whoever annotated that graph is ‘hiding the climb’.
This what Lindqvist said about his graph: “Since AD 1990, though, average temperatures in the extra-tropical Northern Hemisphere exceed those of any other warm decades the last two millennia, even the peak of the Medieval Warm Period”
So here is the rest of it:

Of course that chart has been shown to be a total fabrication. But what the heck, saving the world justifies lying.
Do you think the pink section at the end, annotated with “Period allegedly warmed by human activities”, showing about a 0.08°C rise accurately portrays the observations?
“has been shown…”
So don’t just claim it, show it.
Only the most ignorant anti-maths CRETIN puts instrumental measurements with proxy measurments.
Shows just little he/she/it comprehends
That’s loy-dodo. !
Loydo never had any intention of arguing honestly, because he knows that he can’t win that way.
What exactly are you claiming Fred? That it is impossible to compare past temperatures because they were recorded differently? If you want to claim that it was warmer in the past then you have to be able to compare proxy measurements with instrumental measures and if you can compare them then you can put them on the same graph.
Keep on displaying you ABJECT MATHEMATICAL IGNORANCE Izzy-dumb-or-what !!
It is highly unethical to post two sets of data with differing resolutions on the same chart. Most proxies have resolutions ranging from decades to centuries. The modern thermometer record wouldn’t even show up on many proxies because the time period is too short.
Of course those who have no intention of arguing honestly don’t find this issue to be a problem.
You put up a many times refuted chart, and you demand that others refute it again.
How typical.
Hadcrud is TOTAL NONSENSE
It is no warmer now than during the MWP, probably COOLER
And FAR COOLER than for most of the last 10,000 years
Explain trees under glaciers that didn’t even exist until the LIA.
YOU ARE A LIAR , loy-dodo. !!
Tacking phoney, fabricated “station data” onto paleoproxy data should be an obvious idiocy even to you, a scientific ignoramus and paid liar, Griffoydo.
But its ok for the auther to explicity suggest, via his graph, there has been neglible warming since 1950?
And since the author thought Lindqvist’s data was credible enough to use he may want to respond to Lindqvist’s (suddenly a “paid liar” presumably) statement: “Since AD 1990, though, average temperatures in the extra-tropical Northern Hemisphere exceed those of any other warm decades the last two millennia, even the peak of the Medieval Warm Period”.
Manifestly WRONG,
Trees under glaciers etc
REALITY alludes poor DELUSIONAL loy-dodo. !
“Since AD 1990, though, average temperatures in the extra-tropical Northern Hemisphere exceed those of any other warm decades the last two millennia, even the peak of the Medieval Warm Period”.
Nonsense! … but even if it was, so what? It’s an entirely gratuitous statement devoid of meaning and intended to impress scientific illiterates only. There is no way to prove such an extravagant claim.
The point regarding the resolution of proxies has been explained to Loydo and the other trolls many times. They ignore it, because it refutes what they are paid to push.
as measured by the proxies used for the MWP with a sampling rate of years, decades or centuries.
You cannot compare an automated sensor reporting every 10 seconds at Heathrow with isotope content of tree rings from woodlands in Nottingham with at best annual precision.
Sorry, but THERE HAS BEEN NO WARMING in the NH since 1940
That is what REAL DATA tells us. PERIOD.
None of your mindless evidence free baseless innyourendosshow that data is not correct
Yet another ignorant FAIL from loy-dodo. !!
The models didn’t predict trees under glaciers, therefore trees under glaciers are not physically possible.
Fred250 wrote—“Sorry, but THERE HAS BEEN NO WARMING in the NH since 1940
That is what REAL DATA tells us. PERIOD.”
Please provide evidence of this so that I can add it to my web site DebunkingClimate dot com
Plenty down below. !
fred250–“plenty down below”
Please don’t make me search for what you consider to be evidence. I am looking for credible data that I can use in arguments with Al Gore’s fools, not just someone saying something.
Thank
You
There are a whole heap of graphs of DATA.
Go find them !
They start here
https://wattsupwiththat.com/2021/03/17/humanity-survived-previous-warming-cycles/#comment-3208830
He’s completely correct and his graph illustrates it. Mann’s graph only shows his incompetence being at odds with well established historical evidence and scientific protocol.
BTW … use a spell checker. You have three errors in a single sentence.
Ljungqvist might be right about the extra tropical NH, but only because there is so much more heat island effect there in 2021 than in 1021. Rural areas with the same vegetation cover now as then are probably still cooler today. Medieval Greenland Norse dairy farms are still under tundra.
SST was warmer then, based upon sea ice extent.
A few tenths of a degree is neglible.
Trees don’t make very good thermometers. MBH98 has not only been thoroughly falsified. It has been universally excoriated for its lack of scientific merit, statistical farce and improper protocol. In fact, in scientific terms it has no merit at all, due to its lack of data and method available to all.
You’re embarrassed yourself by even offering it in serious debate.
Trees aren’t thermometers, period.
Trees measure the quality of the growing season, and have nothing to say about what the dormant season was like.
There are many things that impact the quality of a growing season, temperature is only one of those.
Beyond that, trees have an optimal temperature at which they grow best. Going above or below that temperature will result in less growth. If you held everything else constant and changed the temperature, there is no way to tell after the fact, whether the change in growth came from temperatures below optimal were increasing, or temperatures above optimal were decreasing.
I agree completely. Furthermore, the trees Mann chose are bristle-cone pines, a species living in a unique mountainous area. Apart from their extreme longevity, one couldn’t find a LESS useful subject. He used those, combined with Kieth Briffa’s small grove of ‘Yamal’ larch as proxies for the entire Northern Hemisphere … and he claims that the evidence shows that the Medieval Warm Period and Roman Warm Periods were “local phenomena”. The guy is delusional.
My uptick was a mistake, getting used to new phone, sensitive screen.
Nick,
You are allowed to go back and change your input.
…graph is especially accurate before thermometers were invented in 1714……./s
Thermometers weren’t invented until 1714, and weren’t very accurate until around 1850 when glass that didn’t slowly dissolve was formulated. The proxies used before thermometers were invented are actually “approxies” of +/- 2 C dependent on rainfall, human logging, forest fires, and in the case of pond pollen, wind direction for a week of the summer.
Apt term.
Given the inherent stability on something like atmospheric temperature over a relatively short time span with no major global events occurring in that time, +/- 0.2 K is probably about right.
What is the uncertainty of the transfer function from ice cores to temperature?
Most of the problems seem to be based on correct calendar matches.
You can see the annual snows. But how do you link those to a calendar date in the past. If there is a historical event, like fire, volcanic eruption, then that may leave a marker (e,g, layer of ash) that allows the matching of ice core annual markers to calendar years. As the layers do not compress to be clear until below the fern a lot can be applied guesswork.
After this winter is over, people especially in the Northern Hemisphere are really going to wish the modern warm period will continue. The grand finale is about to descend into Europe and it isn’t over in the US until the fat lady takes off her parka. The real test will be next winter. If it comes early, we all might want to start buying the survival provisions to stay fed.
Just hope we don’t get a big volcano or two to go off. They seem to be stirring back to life.
April 2020, there was an unusual deep freeze/snow storm in Colorado that killed just about all fruit tree blossoms statewide, especially the Grand Valley peach trees on the western slope. There was no fruit harvest in 2020.
Humans not only survived prior warming intervals, but thrived. OTOH, we struggled to survive dark age collapses of civilization during the cooling periods. Then rode the four apocalyptic horsemen of plague, famine, war and societal breakdown.
With apologies to John of Patmos.
Humans have been altering the climate by making fires (burning biomass) for ~2,000,000 years. That is, if you call Homo erectus “human” and there is no reason not to. H.e. traveled from Africa to Spain, China, Java, and elsewhere, hunted game, dug roots, cooked food, talked in complex symbols, etc.
My main point is that Humanity survived the entire Pleistocene, all the glaciations, all the interstadials, all the volcanoes, all the hurricanes, etc. It hasn’t been easy, but we’re still here, so there you go. Interesting to note: all the plant and animal species currently in existence also survived the Pleistocene.
The Catastrophic Apocalyptic Doomster mindset that wrote the headline above must be joking. As if surviving the Holocene was a surprising accomplishment, as if a teensy weensy bit of warming will spell extinction to anything — or cooling for that matter.
The Death Cult paranoia freak out spasmodic gibbering Alarmism that so dominates the Chattering Classes today is a little out of touch with reality. Take a chill pill, sports fans. The End of Life As We Know It is not imminent. Put down your Doom Sign and get a job.
Control of fire 2 Ma would be controversial, but 1 Ma not.
While a phylosgenetic lumper might consider H. erectus and H. antecessor the same archaic Homo species, there was considerable physical evolution between c. 2 Ma and 1.2 Ma, plus cultural development.
JT, please allow me to refer you to
Catching Fire: How Cooking Made Us Human by Richard Wrangham
The first Homo sp. had large brains, small jaws, short intestines and other physical features that could only have arisen/evolved from eating cooked foods. Cooking means control of fire. Other human social and cultural behaviors also likely arose around a communal hearth.
The oldest dated hearths found so far are in Swartkrans Cave (1.5 mya) and Wonderwerk Cave (1.1 mya), both in South Africa. Of interest is the first is associated with Australopithecus robustus. Also of interest is the dating method known as post-depositional detrital remanent magnetization which uses known geomagnetic reversals to establish the timescale.
Wrangham dates the use of cooking to 1.8 mya based on physiological characteristics of Homo sp. but other anthropologists extend that back to 2.0 mya based on evolutionary antecedents.
The origin of the use of fire is speculative, but evidence suggests it is closer to 2 mya than 1 mya.
H. habilis, the first member of genus Homo, had a brain between chimp and modern human in size, but closer to chimp’s. Its mandible and teeth were large, capable of a strong bite. It did eat a higher proportion of meat and animal fat than chimps.
The oldest known definite hearth dates from 300 Ka, found in an Israeli cave. At Swartkrans, there is evidence of burned bone, but not of a hearth.
Homo erectus had more common sense than your average millennial so I’d definitely consider them human.
All of these humans were different to modern people and only the strongest survived. Once civilisation came about, the unfit were no longer left by the wayside. Civilisation now allows us the luxury of factories that churn out wooden legs, spectacles, hearing aids, wheelchairs, TV sets and mobile phones for those of us who would have not been supported in the wild.
With the advent of civilization, the skills needed for breeding success started to switch away from brawn, and more towards brain.
We barely thaw up out of the little Ice Age, the coldest era of the past 8,000 years. More warming and CO2 is better for the life of the planet.
I’ll continue to pray you are wrong, although I think it likely you soon will be right!
The current crop of criminals running the US government are barely able to deal with crises they imagine or create themselves! A real emergency that required swift action and decision making would be completely beyond their limited capabilities!
They have well thought contingency plans and are prepared – to save themselves.
Shouldn’t that be “adipose tissue challenged lady?”
“adipose tissue enhanced”, you farkin’ fattist!
Ah, but that’s because of climate change!
https://www.npr.org/sections/thetwo-way/2017/12/22/572795936/climate-change-likely-to-increase-volcanic-eruptions-scientists-say
A warming planet due to human-induced climate change is likely to contribute to an increase in volcanic activity, according to a recent study in the journal Geology.
While a relationship between climate and volcanism might seem counterintuitive, it turns out that pressure exerted by thick glaciers on the Earth’s crust — what geologists call “surface loading” — has an impact on the flow of magma below the surface.
The correlation affects “magma flow and the voids and gaps in the Earth where magma flows to the surface as well as how much magma the crust can actually hold,” study lead author Graeme T. Swindles, an associate professor of Earth system dynamics at the University of Leeds, wrote in an email to Scientific American.
Professor Swindles?
Green Swindles??
Does any up tic in volcanic activity show up with the melting of the Laurentian Ice Sheet? That should be a perfect case study.
l have utterly lost trust in the current global mean temp numbers and they always seem to be adjusted and fiddled with. So to try and see what’s really going on in the Northern Hemisphere l look at the snow cover extent data at Rutger’s snow lab. This is what they suggest what has been happening with temps across the NH between 1967-2020.
Winter (temps mostly tracking sideways with maybe very slight cooling)
Spring (certainly been getting warmer across the NH)
Summer (no data)
Fall (a cooling trend across the NH with N America been the most effected)
“global mean temp numbers”
It’s a physically meaningless concept in the first place.
Yup, looks to me like globull warming is already in resistance territory and cooling will soon take hold. The recent rash of ‘anthropogenic climate change caused my AMO to shutdown and cool the planet’ papers is a sign that even the cult is beginning to hedge their bets.
Volcanoes are muchly over-hyped as to their effects on climate. Take the 3 eruptions off the graph and then ask someone to put them back on, knowing that eruptions cause cooling. They will be lucky to get one correct. Believing in the extreme effects of volcano aerosols, allows one to believe in equally extreme effects of man-made aerosols, the effects of which are used to show the models are more accurate than they really are, due to aerosol cooling.
Agree, except for one point. Aerosols are very short-lived, on the order of days to weeks, so even after large eruptions like Pinatubo the solar shielding affect has completely washed out in a few months. Humans activities result in a constant supply continually replenishing the ‘shield’. The extent of the effect is another matter, I have seen numbers from 0.2 – 1.0C of cooling from human aerosols.
2 points.
First nobody knows exactly how much aerosols were being put into the atmosphere in past decades.
Second, since the 1970’s, we’ve been reducing the number of aerosols being put into the atmosphere. If the aerosols are as powerful as you believe, then most of the warming since the 70’s would be from the reduction of aerosols.
I never mentioned how “powerful” or otherwise aerosols are. And how about you stop just making things up in a knee-jerk way! You could have spent 20 seconds googling that, but no…and while you’re at it, stop claiming I don’t post evidence. I do, you never do.
Stott et al. (2006a).
Poor loy-dodo,
In your ignorance , you just showed that aerosols were not responsible for the COOLING from 1940-1980.
You really are cognitively deranged, aren’t you.
Propaganda is not evidence.
Secondly, Loydo didn’t even attempt to respond to what I actually wrote.
Secondly, any fool can come up with a chart. It’s easy when you don’t have to worry about finding any actual data.
The idea that we know with the kind of precision that the charlatan’s claim, the exact amount, type and distribution of aerosols over the last 70 years, is something so udicrous that only a professional liar could come up with it.
…where refuting with data is not responding, its propaganda.
You HAVEN’T refuted.
You have shown that aerosols CANNOT be responsible for cooling from 1940-1970
Delude yourself, but everyone else knows you are a fool. !!
Even worse, Loydo has painted himself into a corner. If aerosols are responsible for the 1940-1970 cooling, then the cleaning up of aerosols must be responsible for 1980-2020 warming.
Soo, I did refute something? and I’m a deluded fool, for posting a graph. You exemplify WUWT.
And loy-dodo exemplifies the lowest form of rodent.
Poor loy-dodo, yes, you ARE a deluded fool, you have proven that on MANY occasions
And poor loy-dodo, your “evidence” proves that aerosols don’t do much.
Didn’t cause the COOLING from 1940-1980,
….. didn’t cause the slight warming from 1980 – 2015
You remain an EVIDENCE-FREE ZONE, loy-dodo. !
You exemplify climate trolls. Repeating anything, no matter how poorly founded that supports what you want to believe.
In your mind, being able to make a chart actually proves that the chart maker had perfect data from which to work.
As I suspected, Loydo doesn’t know what the difference between propaganda and data is.
Uh, huh. Showing data is propaganda but saying there is no data, well, that’s data. Keep digging.
…says loy-dodo from the bottom of his scientific ABYSS which is purely of his own making.
Your slop-stick comedy is reaching new lows for incompetence.
Data can be propaganda, when it is based on a lie.
In “climate science” ™ fake “data” are propaganda.
You do KNOW that human CO2 has absolutley NO EFFECT on global temperatures, don’t you loy-dodo.
If you think it does, then produce the evidence.
Or remain as you always are, a scientifically empty nonce. !
You have seen “numbers”…. whoopy-doo!
you are no better than a low-level clown !
Any sentient, rational person who spends a modicum of time looking at the “settled science” purporting to underlie the “Catastrophic/dangerous, CO2-driven anthropogenic global warming/climate change” CONJECTURE realizes that there are at least two (2) major unknowns:
(1) climate sensitivity and
(2) attribution.
There are other serious flaws in the conjecture. One is that the historic temperature record is unreliable.
A second serious flaw in the conjecture is that the current temperature record is unreliable (and fraudulent in many cases).
To me the biggest flaw is that while we live in an ice age, briefly enjoying an interglacial period, if CO2 was so warming, why do we reglaciate when it is at its highest level? Again and again.
It’s the classic confusion of cause and effect. “Correlation is not causation”.
From the article: “So, how is it that the warming from about 1700 to 1950 was natural, but the warming before 1700 is not?”
I don’t think anyone is saying that.
Perhaps the author meant something else.
Well, I read a little farther and I see that the above statement was just put incorrectly by the author.
Here’s what he meant to say above:
“Unfortunately, very little of research funding goes toward understanding natural causes of climate change, like what occurred in the Roman and Medieval Warm Periods, and the warming from about 1700 to 1950 all of which occurred before the Industrial Revolution. Interestingly, that warming was natural during those periods, but warming since 1950 is not?”
That’s more like it. 🙂
IMO he meant after 1950.
When and if honest paleoclimatologists ever are free to explore the causes of natural fluctuations, they could do worse than starting with solar output variability, oceanic oscillations and clouds. GCMs can’t model the latter, and rely on TSI rather than considering the much more variable high energy UV end of solar irradiance, which makes and breaks O3 and penetrates water more profoundly than visible and IR light.
Even in the brief 11,400 Holocene, Milankovitch cycles likely have an influence as well.
Warm periods enjoy more solar maxima and cool periods suffer more, deeper and prolonged minima. Between the solar minima rapid counter-trend warming cycles occur, as in the early 18th century, higher in amplitude than the late 20th century pro-trend cycle during the Modern Warming period.
“and rely on TSI rather than considering the much more variable high energy UV end of solar irradiance, which makes and breaks O3 and penetrates water more profoundly than visible and IR light.”
Thank you for pointing that out. While TSI remains “fairly” constant, the energy levels of the photons hitting the Earth are not as the Sun cycles. Additionally the number of cosmic rays coming into our atmosphere ebb and flow, which also have profound effects.
paleoclimastrologists
“UV end of solar irradiance, which makes and breaks O3 and penetrates water more profoundly than visible and IR light.”
Visible light penetrates several hundred feet, in contrast to IR, which is strongly absorbed. I’m pretty sure that water strongly absorbs UV, despite transmitting blue light well. Beached cetaceans often get severely sunburned. Because they have to break the surface frequently to breath, if water didn’t strongly absorb UV-A and UV-B, they would be susceptible to sun burn while swimming freely. Sailors have to be concerned about getting sunburned while on deck because of the strong UV reflected from the surface, which implies very little actually penetrates.
Note absorption of near UV, ie that which gets through the air. Also, seawater absorption differs from fresh.
We apparently are both in agreement that IR is strongly absorbed in water. If you look at the graph I provided from Wiki’, the slope of the lines are nearly identical for the section from 500nm (blue-green) to 3,000nm (red & IR) as from 500nm to 200nm (UV-A & UV-B); it then steepens significantly for UV-C and beyond. If you are going to claim that IR is strongly absorbed, I don’t see how you can than claim that UV isn’t.
My suspicion is that sea water will absorb even more strongly than fresh water.
The abstract that you provided expresses concern for ozone depletion affecting planktonic organisms. Considering the slope of the absorption curve for UV-C in water, and the fact that even in the absence of ozone in the stratosphere one can expect ozone to be produced at lower altitudes and attenuating the UV-C, I’m of the opinion that the authors of your linked abstract are ‘grant-seeking.’ The give away is “could lead to differences.”
Penetration of ultraviolet radiation in the marine environment. A review
https://pubmed.ncbi.nlm.nih.gov/16613490/
Abstract
UV radiation (UVR) is a significant ecological factor in the marine environment that can have important effects on planktonic organisms and dissolved organic matter (DOM). The penetration of UVR into the water column is likely to change in the near future due to interactions between global warming and ozone depletion. In this study we report underwater instruments employed for the measurement of UVR and we review data dealing with the depth of UVR penetration in different oceanic areas including the open ocean, Antarctic waters and coastal waters. We provide the 10% irradiance depth (Z10%) for UV-A and UV-B as well as for DNA damage effective dose (DNA), which we calculated from the values of diffuse attenuation coefficients or vertical profiles reported in the literature. We observe a clear distinction between open ocean (high Z10%, no variation in the ratio UV-B/UV-A), Antarctic waters (increase in the ratio UV-B/UV-A during ozone hole conditions) and coastal waters (low Z10%, no variation in the ratio UV-B/UV-A). These variations in the penetration of UVR could lead to differences in the relative importance of photobiological/photochemical processes. We also compare in this study the penetration of UV-B (unweighted and weighted by the Setlow action spectrum) and DNA damage effective dose.
https://manoa.hawaii.edu/exploringourfluidearth/media_colorbox/2717/media_original/en
Comparison of UV penetration with visible wavelengths in Lake Superior. Light penetrates less deeply in coastal seawater and better in open ocean.
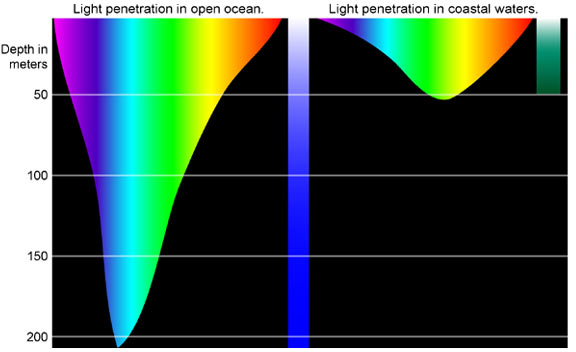
Longer wavelengths are absorbed first.
These illustrations are for visible light only. Both violet and red curves steepen at the boundaries with UV and IR, respectively. One has to go to the graph I provided to see what UV and IR are actually doing.
Does anyone know the energy transfer effect of the Earth’s magnetic field passing through the Sun’s magnetic field? What about solar wind and coronal mass ejections when progressing toward Earth? Something has to be going on there, When the Sun is quiet isn’t the magnetic field weaker, lower solar wind, fewer CME, etc.?
How much of a difference in these forces would create an energy imbalance either increasing or lowering the “Global average temperature anomaly”?
So isn’t TSI just part of the question? Do the climate models have any variable for other than TSI?
Does the variance in magnetic coupling/solar wind cause more volcanos?
A quick search shows that there is literature on all the above Ex: Solar minimum, more volcanos, volcanic cooling? Solar minimum, less solar wind, more cosmic rays, more clouds?
Has anyone written comprehensive article on this here at WUWT.
Vuc, you out there?
GIGO computer gamers aren’t interested in exploring possible influences of climate besides the supposed “control knob” CO2. To do so would break their rice bowls. Besides which, many aren’t even scientists, but programmers. Gavin, for instance is a third rate math grad, who couldn’t get a job in his field, so came to the US as a “computer scientist” to “work” at GISS. He’s so not a climatologist or any other kind of real scientist that he’s an anti-scientist. Yet, naturally promoted to run the criminal conspiracy GISS after its former capo de tutti capi “Venus Express” Jim retired to pursue his activism full time.
People can cook proxy data. The poster child for that would be self-admitted fraud Dr. Michael Mann.
It’s much harder to cook written history.
There is this wonderful article, Warmer is Richer. The written record clearly demonstrates that mankind prospers when it is warmer.
Some folks have tried to argue that the Medieval Warm Period wasn’t global. Even if they were right, which they aren’t, it doesn’t matter. Mankind prospers when it’s warmer. Even if different parts of the globe have been warm at different times, the evidence still stands. Mankind has prospered in warm conditions and unambiguously suffered when it got cold.
Michael “Piltdown” Mann truly is A Disgrace To The Profession.
Anyone who hasn’t already bought a copy could help finance Mark Steyn’s legal case by doing so. link
Just bought five copies of Steyn’s book and requested he autograph them. Think I will send one to AOC… 🙂
When was the last time the Bronx Bimbo reaed a book?
The gooole map has a Climate reconstructions of the ‘Medieval Warm Period’ 1000-1200 AD. Legend: MWP was warm (red), cold (blue), dry (yellow), wet. Each marker references and summarises a paper
https://www.google.com/maps/d/u/0/viewer?mid=1akI_yGSUlO_qEvrmrIYv9kHknq4&ll=-3.81666561775622e-14%2C118.89756200000005&z=1
That thing has been debunked a thousand times. Go and read some of the links and see if what the authors say matches what the red pins are supposed to mean.
Actually it hasn’t, but don’t let reality get in the way of what you are paid to believe.
“paid to believe”? You really are away with the fairies.
So you make a fool of yourself for free?
You are even dumber than I thought.
Ouch! That must have hurt Loydo’s feelings!
You are the one “believing” in fairy-tales, loy-dodo.
NO SCIENCE AT ALL behind any of your yabbering.
What to try , just once ???
1… Do you have any empirical scientific evidence for warming by atmospheric CO2?
2… In what ways has the global climate changed in the last 50 years , that can be scientifically proven to be of human released CO2 causation?
Never debunked by any actual real SCIENCE.
And certainly NEVER by anything you have produced, because you are an EVIDENCE-FREE ZONE
MWP was GLOBAL, and warmer than now.
Get over it, loy-dodo. !!
I looked at several of the links at random. I don’t see anything that “debunks” a pin on a map.
History, as well as common sense tells us that we not only survive, but actually thrive during warmer periods. But they have changed the narrative to “climate change” and then the “climate crisis” as evidenced by “extreme weather”, realizing that the warming even when exaggerated wasn’t scary enough. They have created the perfect bogeyman.
Bruce,
Haven’t we moved into the global weirding stage now? That is the question we must ask alarmists! “Do you accept global weirding?” “Are you a weirder?”
I foresee much hilarity to go along with the idiocy of GangGreen!
climate emergency
Wikipedia says: “Holocene Climate Optimum (HCO) was a warm period during roughly the interval 9,000 to 5,000 years BP”
In line with their usual warmunist politics the article poo-poos and minimizes the event. But I have also seen sources that indicate it was quite a bit warmer than the contemporary world.
It was, and so were the Egyptian, Minoan, Roman and Medieval WPs, at about millennial intervals.
The balmy HCO was interrupted by the Dryas-like 8.2 Ka event, a cold snap caused by the last major ice sheet meltwater surge.
Unfortunately, the trend in WP peaks and CP troughs is down. If AGW can reverse that trend, good on us!
Yes unfortunately, we are at the cold end of the Holocene. The next departure from normal is likely to be cold and with luck will not move the ‘system’ to the cold glacial attractor – if it does then carbon capture and storage will not be a growth industry. On the other hand no moving parts wind generation https://vortexbladeless.com/ will become a growth area as it works even in really cold temperatures and snow.
From the article: “The modern-day blaming of weather events on human-caused climate change in the news reports, at a minimum, intellectually lazy, and is probably mor aptly described as journalistic malpractice and fearmongering. Admittedly, some in the science community have enabled this feeding frenzy.”
I think the Leftwing Press and the alarmist science community are equal partners in spreading this Human-caused climate change scam. They point to extreme weather because they have nothing else to point to as an example of Human-caused climate change. They ignore the fact that similar extreme weather took place before human-derived CO2 became an issue.
This is a good article from Ronald Stein. Us geologists look at time periods even longer than the Roman Warm Period, and see sea level 50 meters higher and 150 meters lower, which is climate cycles writ large. Still, there is any not anomaly signal detectable against he background of natural variation. No funding for me.
Be it as it may, a degree C is only about 0.366% in total enthalpy. The TSI varies by 0.1% in the normal 11 year solar magnetic cycle. We live around a slightly variable star, not the perfect Aristotelian orb in the sky. The physics of stars guarantees that they are almost all going to be somewhat variable. In any event, ours is. As usual, people are anchoring on the wrong thing.
“The TSI varies by 0.1% in the normal 11 year solar magnetic cycle.”
Yes, but as Tillman pointed out, the spectral distribution varies significantly, with the UV increasing about 10% during high sunspot activity.
The amount of ionizing radiation reaching the earth from both cosmic and solar sources, varies by a lot more than 0.1% as well.
It also varies by about +/-3% over the course of a year as the orbital distance changes (the Earth radius vector).
Historical data sets of whatever ever size only reveal potential correlations but in no way explain the underlying science relating to cause and effect which drive the system. That requires other and deep considerations and non biased honest research. Currently sadly lacking I think with a strong obsession with Co2 in the scientific group mindset.
Pretty sure that when I looked around 10 years ago most studies put the Roman Warm Period as warmer than the Medieval Warm Period.
Most do, for instance Greenland ice cores.
Yes, with the HCO as the warmest and successive WPs slightly cooler. It would be nice if they were all equally balmy….
Once you become immersed in the world of grant making and funding, the above becomes blatantly crystal clear.
I have been involved in projects, where we were researching (for a decade’s time) specific chemical mechanisms that cause invasive species to proliferate and were making good progress… but when we applied for funding, we were outmaneuvered by another group who attributed proliferation to climate change (with no data, only a statistical correlation). Of course the funding went to the climate change group(s).
And as a result of that, the field is in complete disarray, as no group has been able to conclusively link the phenomenon to Climate Change. (The results are now all over the board and the theory is filled with “exceptions”.)
As a result, when the field went in that direction, I got out of it (for lack of funding). But now, reading the literature is hilarious, as millions of dollars have been spent and an internecine war has developed between the various groups… it is like watching greyhounds chase a mechanical rabbit around a track. (facepalm)
So, while being poorer for it, the peace of mind of not having to be involved in the “fiasco” is compensation enough.
Been there, done that, got t-shirt – in another field of science.
They are not “fossil” fuels. They are abiotic production in the earth crust. They are not going to become scarce.
Coal is biotic. At least the vast majority of petroleum is as well. Probably gas, too.
Even Gold concentrated mainly on hydrocarbons from a deep, hot biosphere, the existence of which microbial habitats has since been confirmed, if not gas or petroleum definitively originating therefrom. It’s at least plausible, however.
The deep, hot biosphere: Twenty-five years of retrospection
https://www.pnas.org/content/114/27/6895
Gold did however also speculate that some natural gas (CH4) could be formed abiotically yet more deeply. For this conjecture, evidence remains elusive, but it can’t be ruled out.
But you’d be hard pressed to find a reputable scientist who imagines tha coal is abiotic.
There isn’t a shred of evidence to support the abiotic theory of coal, oil and gas production.
In fact all of the evidence that does exist, supports the biotic origin theory.
Since all coal, oil and gas is of biological origin it was all originally in the ecosystem. Somehow it got buried, probably by catastrophes, since some of it is miles underground.
The environmentally responsible thing to do would be to dig it up and burn it and return it to the ecosystem.
Think about it! Mankind has the ability to return the earth to its natural state of global warmth! We have a start but much more work must be done.
100’s of millions of years of soil deposition is sufficient to explain how oil, gas and coal can be found deep under ground.
No need to invent non-existent catastrophe’s.
Catastrophe is amply proven beyond argumentation. Years of deposition can happen as well.
????? That sounds like nonsense.
I remember watching a video in which someone tried to prove catastrophism. They were examining folded layers in some rock formation. They claimed that these folds were created when mud was being laid down by turbulent waters during the Great Flood.
Two huge problems.
1) The idea that mud can turn into rock in just 5000 years is ludicrous.
2) Turbulent water doesn’t lay down mud. The mud/dirt don’t settle out of water until the water becomes quiet.
Catastrophe has been proven? Where?
There is a huge psychological barrier to accepting any indication that the earth is undependable and dangerous. After major earthquakes mental health crises follow due to the insecurity caused by sudden disruption when people realize they cannot depend on mother earth. I am free to accept things as they are.
I would no sooner argue with anyone on this thread than try to prove to someone that Italy exists. I’ve been there.
Earthquakes happen, therefor catastrophes that move 10’s of thousands of feet of dirt in an instant also happen.
Really?
Well, there’s the Storegga slide, Channaled Scablands, the sudden draining of Lake Agassiz, Mt St Helens slide, all the earthquake & volcanic booms… and countless landslide videos of massive sections of mountains poofing out such one here (out of hundreds and hundreds, all last 15 years):
A few hundred feet, not thousands of feet. Beyond that, the places where fossil fuels are found, are typically not areas where massive land slides are possible.
I never said that nature wasn’t dangerous, I said that the existence of fossil fuels can’t be explained by catastrophism.
“humans cannot be blamed for any significant amount of warming until after about 1950”

…
Not true.
…
..
Coal and oil consumption took off well before 1900
..
and this is the underlying reason:
Because GLOBAL warming, versus US warming, is the concern, your graph for US consumption is inappropriate. You need to show a graph for world consumption to make your case.
https://ourworldindata.org/exports/global-fossil-fuel-consumption_v4_850x600.svg
The chart given, proves Clyde’s point, not yours.
D’OH the graph “takes-off” at around 1950
You have PROVEN YOURSELF WRONG.
Well done ! 🙂
What’s the connection?
The US was an economically advanced country with a very rapidly growing population.
In other words you can’t show anything about world levels by only looking at the US.
See link/graph in response to Mr. Clyde Spencer above.
See my response to your response.
I agree with Mark. The global change seems to occur about 1950, disproving your claim.
You must actually provide an argument to make a point.
Real world data show Ronald Stein doesn’t know what he is talking about.
WRONG !
You have just shown you don’t know what you are talking about.
Very little CO2 increase by 1950, 1940 was the warmest period in the NH
Anyway, CO2 has NOTHING to do with it.
“1940 was the warmest period in the NH”
.
.
Nope
.
https://woodfortrees.org/plot/hadcrut4nh/plot/hadcrut4nh/trend
HadCrud is MEANINGLESS, a hodge-podge of homogenisation and data mal-adjustment
Basically ALL REAL UNADJUSTED TEMPERATURE DATA shows that 1940 warmer or as warm in the 1940s in the NH
fred250–“HadCrud is MEANINGLESS, a hodge-podge of homogenisation and data mal-adjustment”
Of course it is. BUT the problem is how to prove that to one of Al Gore’s fools.
Their standard answer is that you have shown only a few cherry picked locations and Hadrut is global.
One of your graphs is labeled : OAS: World, 10 regions
433 Worldwide Valley/Ocean Air Sheltered Thermometer Stations
Lansner-and-Pepke-Pederson-2018
It does appear to be world wide – I’ll read the apparent source http://notrickszone.com/2018/03/23/uncertainty-mounts-global-temperature-data-presentation-flat-wrong-new-danish-findings-show/#sthash.xRX744lI.Elqxi6SO.dpbs
Thanks for your work.
Thanks Jim, sorry I got narky up above.
It takes time to post this many charts 🙂
Fred250–“I got narky up above”
No worries. I frequently get vague references when asking for actual evidence that man’s CO2 is causing serious global warming. I then ask for an actual link. When forthcoming, it is usually unusual weather events, a NASA page, or something along the lines of “just look around you!”
What I really want is a few highly credible (to the alarm industry) historical global climate sources that are as accurate as possible from the 1930s up to the start of the satellite era. I have not been able to find radiosonde back that far (I think I found it starting the late 1950s.)
YEP !! HadCrud is a LIE,, for the gullible AGW cultist
ONLY the most MORONICALLY IGNORANT brain-washed cretins believe HadCrud once they see REAL DATA.
Even South Africa was warmer in the 1940’s
Fred–“ONLY the most MORONICALLY IGNORANT brain-washed cretins believe HadCrud once they see REAL DATA.”
Unfortunately there are lots of those Cretins in positions of power and in the media. http://www.debunkingClimate.com
I doubt that many of the people you list actually believe in CAGW. It’s just that it’s a useful ploy to get them the power and money they crave.
Texas
Greenland , from IPCC
Arctic temps again
second graph wrong link.. IPCC Greenland….
South America
Ireland
Global
USA
HadCrud is a FAKE for the AGW agenda,
Even Hansen says so
As does Jones
Cooling in Central Asia since 1950
Arctic sea ice extent much less during MWP
Thanks for those graphs, fred.
The real temperature profiles of the world show we have nothing to fear from CO2.
You have once again provided data to prove that your claim is wrong! Thank you.
You still haven’t provided an argument. Ad hominem is not an argument. Showing charts of energy consumption is meaningless. Even it it was accurate, what do you imagine it means?
If you’re going to make assertions please at least learn how to make an argument first.
I have not made an ad hominem argument.
You haven’t made an argument either, what is the point of being evasive in your replies?
You said:
That is ad hominem. Clearly you have no idea what an argument is, ad hominem or otherwise. Data is 100% neutral and doesn’t “show” anything without context. You are attacking the man, not his arguments.
You appear to have no serious intent to communicate, so why are you posting here?
There’ll be no charge for this lesson.
That’s not an ad hominem and I’m tired of people applying it incorrectly all the time.
http://nizkor.com/features/fallacies/ad-hominem.html
You’re wrong. You must spend much of your time fatigued.
I disagree. The statement implies that Stein is ignorant and therefore anything he says should be ignored. The argument is not being dealt with. Instead, the man making the claim is being attacked.
Aren’t they a bunch of absolute gentleman Roger.
….”PILE ON!!!”
And you are just a “pile”.. of s**t
Again, with another ZERO-CONTENT post.
You SO CAN’T COPE when being ALWAYS proven WRONG, can you little child. !!
All he needed to do was accept the consensus of this thread. He could have been enlightened.
It is again noted that Loy-dodo has NO COUNTER to the facts .
No wonder dodos are extinct. !
Once again Loydo makes a post that has nothing to do with the subject, but probably makes him feel better about himself.
I’m waiting for this real world data. What you have provided so far fails.
Not correct.
1) You used U.S. data, not world data.
2) You showed components of fossil fuel use, not total. That’s misleading.
3) CO2 concentration is cumulative. The increase in the 70 years from 1880 to 1950 was very small, about 20ppm (with some uncertainty as it comes from ice core data). The increase from 1950 to 2020 was 100ppm.
1940 is probably a better dividing point, but 1950 is ok.
https://ourworldindata.org/grapher/global-fossil-fuel-consumption
GISS is NOT representative of “Global Average Temperature”
It is a fabricated AGW cult fabrication.
I agree that GISS has tortured the data but that wasn’t the point of the plot. The point was to show the CO2 curve. Since the Keeling curve only goes back to 1958, it wouldn’t make the point that CO2 rose only slightly from 1880 to 1950, as compared to 1950 – present. I needed a plot that spliced ice-core CO2 to Mauna Loa measured CO2.
However, even with the tortured data, you can see that the temperature rose fast at low CO2 from 1910 to 1940, *FELL* as CO2 was steadily rising from 1940 to 1970, and then rose again at about the same rate it was rising at low CO2. It’s inescapable that CO2, by itself, could not possibly cause this behavior.
“It’s inescapable that CO2, by itself, could not possibly cause this behavior.”
And the discrepancy is even worse when real regional temperature profiles are used.
In the case of the United States, the temperatures rose even more from 1910 to 1940 than GISS shows; the decline from 1940 to 1980 is more pronounced; and current-day temperatures are no warmer than they were in 1940. They are actually cooler, in fact.
My favorite chart, the U.S. surface temperature chart (Hansen 1999) shows the temperature profile perfectly.
Remember: Any global temperature chart that shows the Early Twentieth Century to be cooler than today is a bogus, bastardized, instrument-era Hockey Stick chart, but as meab shows, even the bogus Hockey Stick blows up the CO2 theory.
I don’t understand why the Bai Den Regime hasn’t appointed an Inuit or Eskimo to help John Kerry; climate czar!?
This deputy could just declare that humans are not actually a tropical species, and that the wearing of various animal hides is mandatory. That should stifle any dissent against cooling temps being more beneficial!
On a more serious note, James Hansen’s 2008 graph of the global temperature anomaly puts the lie to fears of warming. A much warmer planet is where all life came from. I am in complete agreement with Dr. Moore that Hansen’s alarmism after completing that work is incomprehensible!
Ja
https://breadonthewater.co.za/2021/03/04/the-1000-year-eddy-cycle/
I told you about it, first.
If we believe the Ljungqvist graph, at least 2/3 of the warming between 1890 and 2000 occurred before 1940 (50 years), while most of the increase in CO2 concentrations occurred after 1940 (60 years to 2000), so how can any serious scientist “blame” the smaller recent warming on CO2?
If we go further back, the Ljungqvist proxy increased from about -0.7 C in 1690 (the worst of the Little Ice Age) to about +0.1 C in 2000, but about half of the increase occurred between 1690 and 1720, when there were no cars or planes or electric lights or appliances of any kind. This means that half the warming since 1690 occurred in the first 30 years, and the other half took 280 years, so the more recent warming (including the Industrial Revolution) was about 9 times slower than the initial recovery from the Little Ice Age. This demonstrates that most of the warming since the Little Ice Age was due to natural processes only.
There are many paintings dating from the 1600’s showing people having “winter festivals” on the frozen Thames River, although the river rarely freezes in modern times. If the Northern Hemisphere on average was only about 0.8 C (1.44 F) colder then than now, most of the warming must have occurred in winter, so that it would have been cold enough to freeze the Thames during the Little Ice Age, but not now.
Humanity is less viable in cold cycles, and performs poorly in carbon-deprived cycles.
“So, how is it that the warming from about 1700 to 1950 was natural, but the warming before 1700 is not?” That’s a great question. Also note the graph at the following link:
http://www.euanmearns.com/wp-content/uploads/2017/06/vostok_T_CO2.png
There have been 4 previous warm periods in the last 450,000 years. All of them were as warm or warmer than anything in the current era. And all of those warm periods happened hundreds of thousands of years ago. Mankind could not possibly have caused those. They had to be natural. So how is it that the small amount of warming in recent years can only be due to mankind?
The previous interglacial, the Eemian (MIS 5), was warmer and lasted longer than the Holocene has so far. The one before that (MIS 7) however wasn’t as balmy as the Holocene, and was split into two pulses. The prior two (MISs 9 & 11) however were at least as warm as our present interglacial.
The Hoxnian Interglacial (so called in the UK), 424 to 374 Ka, (MIS 11) was the longest and hottest such interval of the past 500 Kyr. It shows the highest-amplitude deglacial warming in the last 5 Myr, and possibly lasted twice other interglacial stages. Some consider it a Milankovitch model for the Holocene, in which case the Southern Dome of the Greenland Ice Sheet might melt under totally natural global warming.
MIS-11 duration key to disappearance of the Greenland ice sheet
https://www.nature.com/articles/ncomms16008
H. heidelbergensis-style people, ancestral to both Neanderthals and Moderns, flourished in Europe during the Hoxnian.
http://www.karstenhaustein.com/reanalysis/gfs0p5/GFS_bias168_timeseries_global.png
(Why are some png visible and others not ?)
As one alarmist told me. They have no idea what caused the previous warming cycles. However they know for a fact that the current warming is caused by CO2, not whatever caused the previous warmings.
How do they know this? The models have proven it.
I think you laid out the alarmists’ fuzzy thinking perfectly, MarkW.
Tom Abbott–“I think you laid out the alarmists’ fuzzy thinking perfectly,”
Here is how I usually frame it:
3000 years ago, there was the Minoan Warm period. Man did not emit CO2, but it was warmer than now.
Then 1000 years later, there was the Roman warm period. Man did not emit CO2, but it was warmer than now.
Then 1000 years later, there was the Medieval warm period. Man did not emit CO2, but it was warmer than now.
Then 1000 years later, came our current warm period. Are saying that whatever caused warm periods in the past has quit, so that man’s CO2 could take over the job? EXACTLY on schedule? Not very believable.
The entire climate scam crumbles on this one observation because it shows that there is nothing unusual about today’s temperature and ALL claims of unusual climate are based on claims of excess warmth caused by man’s CO2.
JimK, I’ve had plenty of alarmists make exactly that claim. They don’t know what caused the previous warm periods, but it doesn’t matter. Because the models have proven that the current warm period is caused by CO2.
I don’t know why some graphics work and others don’t appear but just show a link.
I noticed that if I posted the UAH chart, it would only post the link, unless I added an “s” to the http address. When I add the “s”, the chart shows up as a graphic.
I tried this technique the other day when I noticed someone post a .png file and it only posted as a link. So I copied the link and reposted it while adding an “s” to the address but it still only posted as a link, not a graphic.
That’s about as much as I know.
But this one is more rapid and the increase will be greater… this one comes when the food supply has to provide for billions… this one comes when many of our major cities are by the rising ocean.
The house is on fire.
WRONG
You have ABSOLUTELY NO EVIDENCE of warming by human released atmospheric CO2.
You are DELIBERATELY LYING.
And EVERYBODY IS LAUGHING at your rancid brain-hosed ignorance.
Warming and enhanced atmospheric CO2 will INCREASE world food supplies.
Sea level rise of between 1.5mm and 2mm per year is insignificant.
After all … “97% of scientists agree…”
Altogether now …
No, the house is a few tenths of a degree too warm. Too little for anyone to notice. But some children with disabilities are scared and screaming that we’re all going to die. Some of the other folk living here think that in a hundred years it might be a few degrees too warm, but their answers (removing the insulation, blocking out the sun) are nonsensical.
We have plenty of time to install air conditioning (adapt) if we need to.
If you think a house is on fire because it might get a few degrees warmer in a hundred years, you need mental health treatment.
chicken-little-griff
…our major cities are by the rising ocean. – The house is on fire.
As there will be a flood, you will not have a fire problem in your house, be happy 😀
Do you know the difference between a proxy and a thermometer ?
Seems not – else you would know that you can’t compare these timescales.
The food supply already “provides” for “billions” and humans have never been as well fed and with less famine and more surplus (thanks in part to fossil fuels and capitalism).
The oceans have been rising at virtually a constant rate for thousands of years and we’ve managed to mitigate any effect easily. How is that any sort of threat?
What “house is on fire”? You need to learn how to be more clear with your assertions.
All the real world evidence shows that “this one” is still more mild and hasn’t lasted as long as the previous warm periods.
More CO2 and more warmth means more food.
At the current rate of warming, those cities have 300 to 400 years to figure out how they need to move back by a few hundred feet.
The only thing on fire around here is your reputation.
Griff can’t get his head around more CO2 equals more food
Most buildings, especially modern ones won’t last much more than 100 years. All we need to do is wait for the buildings closest to the beach to wear out, then when we replace them, we just rebuild a few feet further back from the beach. Easy peasy.
you are funny!
“ludicrous”, “assinine” “farcical”, “loony”, “deluded” , would all be better words
“Deluded loony” works for me
“The house is on fire.”
Take a deep breath, Griff. You’re going to scare the children.
At the start of the article it says “So, how is it that the warming from about 1700 to 1950 was natural, but the warming before 1700 is not?”
Uhm, I think this is a mistake. Correct me if I’m wrong, but should it not ask, “how is it that the warming from about 1700 to 1950 was natural, but the warming after 1950 is not?” That’s what is says farther into the article.
I agree, very badly worded.
I hope they correct it. !
(moderators, someone want to check?)
There’s a reason our current warming is consistent with previous warming periods.
Radiating gases, especially CO2, provide the energy for life. This is the missing link. The frequency band for CO2 sits right next to the open window band where energy radiates directly to space from the surface. While the main bands of CO2 are saturated, increases in concentration will expand the CO2 band into this open window and start absorbing additional energy. It is this energy that drives climate science warming claims.
What has been missed is there is an equal loss of energy also due to CO2. As CO2 increases, life expands. Biology requires energy. The energy climate science has been using to claim future warming is already being used to fuel the expansion of life. When you think about it, this is a great design. As CO2 increases, the biosphere is provided all the essential requirements for growth.
That 3.7 w/m2 of energy from the expansion into the radiation window is no longer available to create warming or any feedback and climate sensitivity ends up being very close to zero.
Not a design.