From Yahoo News, via the Christian Science Monitor
A new team tries a new approach to Climate Modeling using AI and machine learning. Time will tell if a positive effort or extremely complicated exercise in curve fitting. Their goal is regional scale predictive models useful for planning. Few admit publicly that these do not exist today despite thousands of “studies” using downscaled GCM’s.
“There are some things where there are very robust results and other things where those results are not so robust,” says Gavin Schmidt, who heads NASA’s respected climate modeling program at the Goddard Institute for Space Studies. But the variances push skeptics to dismiss the whole field.
“There’s enough stuff out there that people can sort of cherry-pick to support their preconceptions,” says Dr. Hausfather. “Climate skeptics … were arguing that climate models always predict too much warming.” After studying models done in the past 50 years, Dr. Hausfather says, “it turns out they did remarkably well.”
But climate modelers acknowledge accuracy must improve in order to plot a way through the climate crisis. Now, a team of climatologists, oceanographers, and computer scientists on the East and West U.S. coasts have launched a bold race to do just that.
They have gathered some of the brightest experts from around the world to start to build a new, modern climate model. They hope to corral the vast flow of data from sensors in space, on land, and in the ocean, and enlist “machine learning,” a kind of artificial intelligence, to bring their model alive and provide new insight into what many believe is the most pressing threat facing the planet.
Their goal is accurate climate predictions that can tell local policymakers, builders, and planners what changes to expect by when, with the kind of numerical likelihood that weather forecasters now use to describe, say, a 70% chance of rain.
Tapio Schneider, a German-born climatologist at the California Institute of Technology and Jet Propulsion Laboratory in Pasadena, California, leads the effort.
“We don’t have good information for planning,” Dr. Schneider told a gathering of scientists in 2019. Models cannot tell New York City how high to build sea walls, or California how much to spend to protect its vast water infrastructure.
They simply vary too much. For example, in 2015 in Paris, 196 countries agreed there will be alarming consequences if the planet warms by 2 degrees Celsius, measured from the industrial age. But when will we get there? Of 29 leading climate models, the answer ranges from 20 to 40 more years – almost the difference of a human generation – under current levels of emissions. That range is too wide to set timetables for action, which will require sweeping new infrastructure, everything from replacing fossil fuels to switching to electric vehicles to elevating homes.
“It’s important to come up with better predictions, and come up with them fast,” Dr. Schneider says.
This is funny
And it threatens to ruffle feathers in the climate science world, especially at the established modeling centers, like Dr. Schmidt’s NASA group at Goddard. “I think they have oversold what they can do,” Dr. Schmidt says. Is a new model needed? “They would say yes. I would probably say no.”
Apparently a quite modest group.
The other distinguishing feature, Dr. Marshall notes, is those working on it. “The model is actually less important than the team of scientists that you have around it,” he contends. In fact, the 60 to 70 researchers and programmers in the CliMA group represent a veritable United Nations.
Somebody put a map on the wall at the CliMA house, a converted provost’s home at Caltech, and asked everyone to pinpoint their homes. “There were a lot of needles,” Dr. Schneider says.
Here’s the AI part
A climate model that “learns”
CliMA decided on an innovative approach, to harness machine learning. Satellite and sensor information is freely available – much of it for weather forecasters. Dr. Schneider envisions “training” their model with the last three decades of data, and then routinely feeding it the latest updates. The model itself could “learn” from the data and calibrate its performance with formulas refined by AI, even as the climate changes.
Other issues discussed are the reasons for choosing to program in Julia. To read the rest go to the full article here.
HT/Clyde Spencer
“is a new model needed?” of course not, since 1988 the models have been perfectly accurate and no updates or improvements have ever been needed — or indeed possible
we don’t even need to measure temperature anymore, we just look at the predictions from 1988 to see what it is now
this is why GISS was disbanded for lack of anything to do
First he claims that the existing models have done very well.
Then he states that the existing models need to be replaced by a completely new model.
climate itself is hard but fairly certain any team of half-stoned undergrads can engineer a model that will accurately predict what the next batch of climate models will say
Sounds like Orwell is describing Marxism, which praises contradictions (they call it ‘dialectic logic).
Yes, the Democrats are trying to send us down that rabbit hole with their brainwashing.
It’s like Biden spouting about “American values” today when what he really means is “Socialist values”. Whenever you hear a Democrat say “American” values, just substitute “socialist” values and you will have the real meaning correct.
The Left always assumes everyone sees the world the way they do, and the few that don’t are irrational in some way. This is called arrogance.
Many would call that hubris…
I debated myself on whether to use arrogance or hubris. 🙂
Why stop there? Arrogance, hubris, grifting, careerism, psychological terrorism, …
Tall in stature small in mind.
A village somewhere is missing its idiot. All we know is he answers to the name of Bill.
I admire your perseverence, reading this. I got so far as “Gavin Schmidt” and switched off.
I tried to end when you did, paranoid goy. But then I noticed the next quote was from Zeke Hausfather, who now goes by Dr., and that ended it for me.
Regards,
Bob
Zeke deserves that title, no one has been more fervent in their belief or evangelism. He’s done extensive missionary work among the heretics, doubtless saving many from a future as defendants in tedious but sadly necessary climate Nuremberg trials.
How true that is
Schmidt, Horsefather.. all they need is Mickey Mann…
… and you have a climate non-science equivalent of the Three Stooges.
A trifecta.
The lunatics have taken over the asylum! This is not going to end well.
smut, horse feathers and mickey mouse.
There’s a thought picture! I guess Michael Mann will be Moe.
“Gavin Schmidt who heads NASA’s respected climate modeling program”. There you have it. We need to pay attention.
Maybe they decided to adopt Einstein’s enduring scientific advice advice –
(or was that Mark Twain or Benjamin Franklin?)
Models all the way down. Ho hum……
Not one mention of how the “new” model will be validated. Wonder why?
It will be validated in the new way science is validated: by a carefully planned media campaign.
Very well-said Savage! That is nowadays a new way of validating anything!!
Join in that group, promote that idea via planned media campaign, TV news (including public funded BBC) etc. That group thinkers will get enough funding, power and promotion.
Who will be there to say against or raise any issue? Those will be ending with no job or funding. They will be cornered and bright minds will be destroyed. Who will dare to follow that path?
I can’t grasp why anyone with an education would want to spend their entire lives like that, given that you only get one.
Are they all Reincarnationists ?? …. I’ll do better next time, even if I’m reincarnated as a slug.
Why do people become climate “scientists”? Not to discover truth, not to understand what is happening! No!, they are climate scientists because they want to “save the world”! This is their live mission: to further the narrative and educate the unwashed.
That’s exactly how they validated the “election”. (And yes, I’m using the term loosely.)
Tim
What troubles me more is that, as I read it, they will rely on only modern data. If we are in a cyclical upturn, then the new model will simply end up extrapolating a current, short-term trend, and miss the bigger picture.
It’s why I find using a 2nd degree polynomial on temperature data to be far more instructive than linear trends. It clues you in far better if there are cycles in the data. But you are correct, the data needs to be over a long enough period to identify the cycle. Fundamental Fourier analysis.
You’re right, Tim. I did exactly such an analysis in 2010, in a post called “Future Perfect” at Jeffid’s the Air Vent blog.
It turned out the GISS and UKMet air temperature records can be well-fit with a cosine function. Remove the cosine and you’ve got a linear trend with zero sign of acceleration.
The cosine phase comes from PDO and AMO temperature oscillations with a period of about 60 years. It’s in both the land temps and the SSTs.
The linear warming trend that’s left looks like the slow rising phase of a much lower frequency, higher intensity thermal oscillation.
But zero sign of any dependence on CO2_atm.
“The linear warming trend that’s left looks like the slow rising phase of a much lower frequency, higher intensity thermal oscillation.”
Exactly. One possibility is salinity changes in the mixed layer as shown in Thirumalai et al 2018.
Perhaps that’s by design… they can’t meet their narrative with long-term data, so just keep announcing new models based upon short-term uptrends so that they can keep bleating that Things Are Far Worse Than We’d Even Dared To Think! Panic! PANIC! (oh, and give us your money).
Won’t the new model be validated by the old models and vice versa?
(Part of me thinks what I’ve just said will come to pass)
See my reply to Clyde Spencer.
The way AI’s learn is by feeding inputs into it along with expected results. It then learns how to manipulate the next set of inputs to get the expected result.
Since the expected results will be what the current models output, Voila! – immediate verification!
Is that AI as in Artificial Intelligence or as in AI Gore? Or are they one and the same thing?
But it will use AI. They will feed it three decades of historical data, so it can learn. It’s OK. (Will that be real historical data, or harmonized.)
And how can they say that the models have done really well over the last 50 years?
Or they feed in the results of the previous models as data (as, apparently, they did very well) and the AI just consolidates them into one ‘prediction’ – I really wouldn’t put this past them actually!
Tim G & Retired Engineer:
The medical world is very excited about AI/machine learning (to scour very large data sets). In a recent review they mentioned that the “training (data) set” that the AI learns from can NOT be the same data set upon which you want to use it on. Thus, you can not use any part of the training set to validate your algorithm. So, it seems that the climate modelers’ AI will likely just reproduce the same biases the GCMs produce. GIGO?
Bill,
You nailed it. Think about what they do with the medical AI’s. Take a group of patients diagnosed with the flu, make a weighted list of symptoms (i.e. how often they occur), and then input the symptom list to the AI along with a weighted list of probabilities for diagnosis (e.g. flu, cold, etc).
Then do the same for a group of patients diagnosed with the common cold. And diagnosed with bacterial pnuemonia. And with kidney failure, and on and on …..
The neural network can then build a set of links, weighted links, that it can apply against a set of symptoms that are input. A new patient has a high fever, nausea, and a high white blood cell count. The AI can then output a set of weighted possible diagnoses. Eventually it can even recommend tests to further tie the diagnosis down.
This is totally different from what they are apparently building this climate AI to do. They are going to train it to be the same as a dog with one trick.
If they *really* wanted to do this right they would feed the AI a detailed map of daily measurements for each sensor location – 1 minute temperature readings, specific humidity, altitude, precipitation, wind, etc. The AI could then establish all kinds of relationships such as when the pressure is going up at Station A and down at Station B then such and such will happen with wind, precip, and temperature at Station B.
Oops! I think I just described the weather models being used to forecast weather! And we know those forecasts aren’t accurate over weeks let alone decades. So how will the climate AI be any more accurate?
Contrary to Zeke Hausfather’s disinformation, which @CSMonitor shamefully disseminated, the climate models have a record of spectacular failure:
https://sealevel.info/hansen1988_retrospective.html
Hansen et al (1988) made many grotesque errors, and their projections were wildly inaccurate. But the mistake which affected their results the most was that they did not anticipate the large but slow CO2 feedbacks, which remove CO2 from the atmosphere at an accelerating rate, as CO2 levels rise.
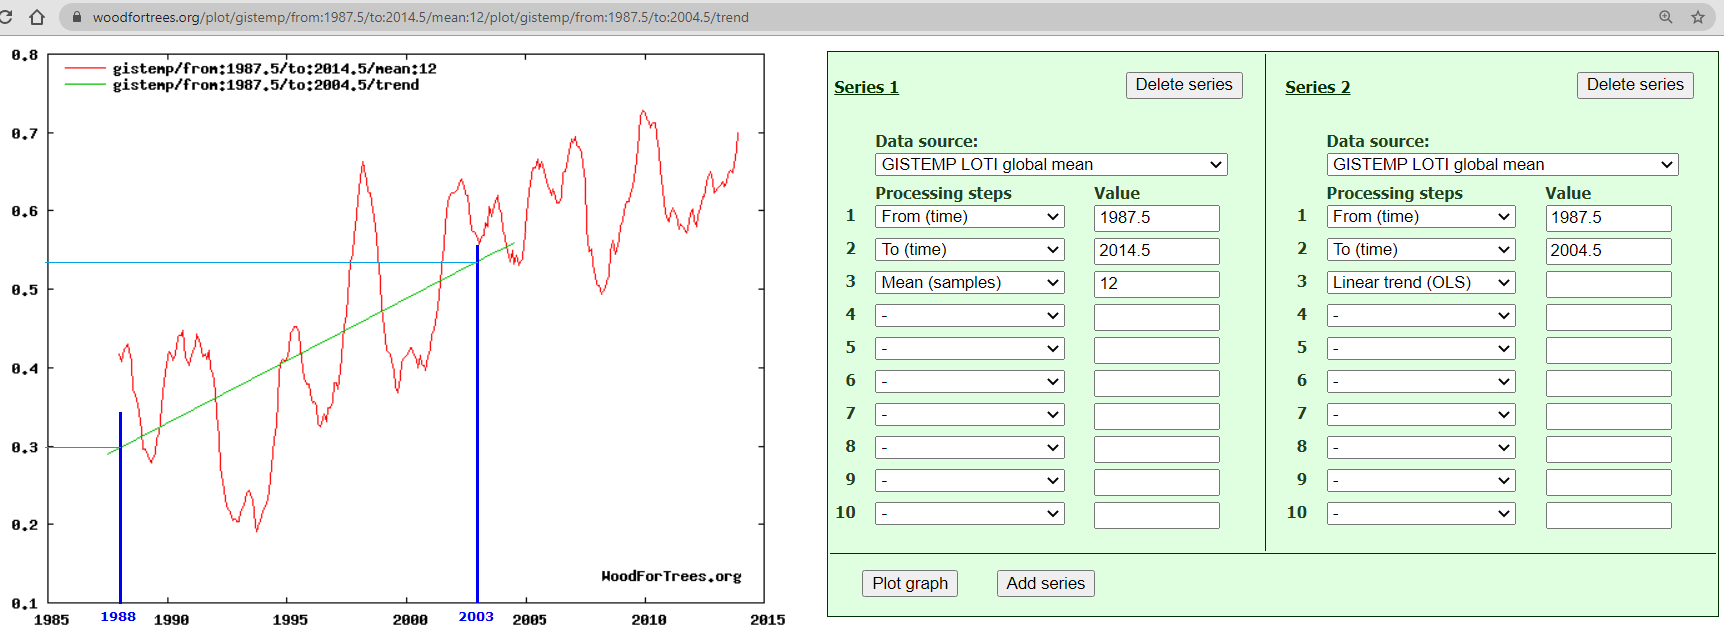
Hansen & his team predicted +0.5°C/decade from “business as usual,” with +1.5%/year increases in CO2 emissions. We actually got at most about 1/3 that much warming, despite greater (+1.97%/year) increases in CO2 emissions.
Even economists are embarrassed by errors that large.
Of course, recent models “hindcast” the past pretty well, but:
Highly recommend clicking on David Burton’s name to see his very astute site.
it’s interesting there is still so much debate about the CO2 sinks, agreed with all your points here https://sealevel.info/Salby_CO2_lecture_critique.html
do suspect that while human emissions dominate CO2 trends at the moment, as fossils fuels run out a more complicated long-term relationship is unfolding than we currently have our collective hands around — CO2 levels and temperatures may begin falling much sooner than most have anticipated, due to obliquity eroding the warmth of the interglacial and the exponentiating biological response to rapidly rising CO2 levels
we likely won’t live long enough to worry about the coming CO2 shortage but our grandkids might
“CO2 levels and temperatures may begin falling much sooner than most have anticipated”
Then when it gets TOO cold- the alarmists will be demanding that we burn far more fossil fuels- and they’ll be blowing up wind and solar “farms”.
maybe, but the Fallen Angel scenario seems more likely at this point https://en.wikipedia.org/wiki/Fallen_Angels_(Niven,_Pournelle,_and_Flynn_novel)
Musk needs to hurry up so that we can start to build SPS’s!
LMAO. That (from your link) sums it up perfectly!
Hansen (1988) used a model with a Climate Sensitivity of 4.2C “for doubled CO2” (first sentence in his section 6.1). If Hansen’s results have any use whatsoever, it would be the0 conclusion that Climate Sensitivity is less than 4.2C.
Zeke is engaging a classic propaganda technique by accusing skeptics of cherry picking. He got his remarkable results by ending the model comparison in 2007 after which the spread between models and observations widened. The study was done in 2019 so the data was easily available to be included. Deception primarily happens through omission.
If the existing models perform “remarkably well”, why replace them?
Only to “ADJUSTED” data…
.. adjusted so it better fits the models.
If it hindcasts to GISS.. IT IS WRONG…. …. !!
“Hansen & his team predicted +0.5°C/decade from…”
He didn’t predict that. From your quote
“A warming of 0.5°C per decade implies typically a poleward shift of
isotherms by 50 to 75 km per decade”
That is just setting out a physical relation. It isn’t a prediction that such a change will occur. His predictions are given in the graphs.
“But the mistake which affected their results the most was that they did not anticipate the large but slow CO2 feedbacks,”
No, they did not make such a mistake. All Hansen’s calculations are made in terms of actual CO2 concentrations in the atmosphere. He did not have measures of actual source emissions (amount burnt); when he speaks of emissions, his measure is the observed change in CO2. So he did not make any prediction, right or wrong, about the response of CO2 in the air to CO2 burned.
He defined his projections relative to the increases in GHG concentrations, which he did not predict, but adopted scenarios for calculation. This is required, because scientists cannot be expected to predict how much GHG we will choose to emit in the future. To evaluate the projections, you must track the GHG concentrations and decide which scenario did evolve. Hansen’s projections have been followed very well.
His predictions have NOT been followed very well. His predications did not project long periods of stagnation in the temperature while CO2 was rising. From Hansen on the models have projected a linear rise in temperature based on an increase in CO2. Nowhere was a stagnation predicted.
Besides which, the models “predict” nothing, they project past data into the future. Like most projections made on past data, actual results may vary – and with the climate that is so obviously true!
Hansen’s model did not incorporate ENSO effects – it used a slab ocean model. It predicted the trend after ENSO effects were removed, and very well.
No GCM is a projection of past results into the future; in fact they don’t use past results. They calculate the response of the modelled earth to applied forcings.
Nick,
You *really* need to stop trying to foist this BS on us. You’ve tried it before and it didn’t work.
Temperatures *have* to be some kind of input to the GCM, even if only initial conditions or boundary conditions.
GCMs work from an initial state, usually well back in the past, which provides the initial condition. That includes initial temperature, but there is no use as boundary condition.
If you think otherwise, several codes are public and readily available. You only need to show us where you think observed temperatures are used.
You have now claimed that the CGM’s don’t depend on temperature – as if they can calculate a future temperature based solely on CO2 and some magical programming of supposed physical processes you call “forcings”. And you have just claimed as well that the CGM’s *do* depend on temperature.
You can’t even keep your argument consistent!
BTW, I said “initial conditions OR boundary conditions”. Not initial conditions AND boundary conditions. You confirmed my statement, you didn’t refute it!
Nick writes “GCMs work from an initial state”
I doubt Hansen’s mid nineties model worked like that. Computing at that time was a tiny fraction of what we have today. Hansen’s projection wasn’t based on physics at all. Even if it “modelled physics” it will have been so simplified and course as to be unrecognizable from reality.
And yet it was “close” to what scientists believe today.
Feynman had something to say about that in his description of Milikan’s oil drop experiment to determining the charge on an electron.
We’re going to be stuck with sensitivity estimations for a long time to come with no sensible way to actually determine them.
And they are provable WRONG
Show me a model that has the 1940’s peak in the Arctic
And yet El Nino is responsible for the ONLY warming in the satellite era.
How DUMB is that !!!
Can’t do the main warming factor, and PRETEND that CO2 is a forcing. DOH !!
No wonder they can’t get even in the ball park !!
Hansen’s “model” for ZERO CO2 growth is the only scenario that comes close to REAL temperatures (no not GISS et all, they are AGW fabrication based on adjustments and garbage data.)
This proves CONCLUSIVELY that CO2 IS NOT a climate forcing.
We thank Hansen for his EVIDENCE
How can GCMs be tuned to past data, which includes the ENSO cycle, when the models themselves don’t handle the ENSO cycle?
Magic
And how did they arrive at the relationship between forcings and response?
They picked what they needed in order to be able to suck at the government teat!
Yes Nick..
Real temperatures are following Hanson’s scenario C very closely
….. and updated by hand to 2020.
Problem about that , is that CO2 growth has not slowed at all so we should be on Scenario A
You are being “disingenuous” as always, Nick
LYING to support “the cause” doesn’t help your floundering reputation.
Your hand update is way off. Here is GISS:

Right on Scenario B. In fact GHGs have been following a trajectory between B and C.
https://moyhu.blogspot.com/2018/07/hansens-1988-prediction-scenarios.html
Nick,
Huh? Hansen’s Scenario B showed +1.3C by today. GISS shows about 0.75C, approaching half of S B. GISS is *NOT* right on Scenario B!
Don’t pee on my leg and tell me it’s raining!
“Huh? Hansen’s Scenario B showed +1.3C by today.”
It did not. I have posted the actual image from Hansen’s paper, with the actual GISS superimposed. Scenario B rose from about 0.3 to just over 1.
Nick,
Huh? Hansen’s original 1988 paper showed that by 2021 the temperature anomaly for Scenario B would be 1.3C (that’s the best I can interpolate from my copy). I don’t know where your graph came from.
Tim,
The graph I posted is Fig 3(a) from Hansen’s 1988 paper:
http://www.klimaskeptiker.info/download/1988_Hansen_etal.pdf
Mine is read from Figure 2!
Fig 2 is not predicted temperature. The y-axis is ΔT₀, the equilibrium temperature that would correspond to that level of GHGs. ie the temperature that would be eventually reached if GHGs were held at that level indefinitely.
For Pete’s sake Nick!!!!
Did you read what you posted?
“Fig 2 is not predicted temperature”
“the temperature that would be eventually reached”
Wow! Talk about cognitive dissonance!
And you say it is ΔT₀ — A TEMPERATURE!
How much more BS are you going to sling before you figure out none of it is sticking on the wall?
You don’t seem to have bothered to read the caption, which starts
“Fig 2. Greenhouse forcing for trace gas scenarios A, B and C.”
The text stays
” The net greenhouse forcing, ΔT₀, for these scenarios is illustrated in Figure 2; ΔT₀ is the computed temperature change at equilibrium (t → ∞) for the given change in trace gas abundances, with no climate feedbacks included [paper 2].”
Forcing has been converted to temperature units, but that does not make it Hansen’s prediction of the actual temperature reached at that date.
Hansen has a perfectly explicit graph of his predictions (3a), which have been much quoted. Why do people keep trying to find contradictory predictions elsewhere in the paper, without bothering to read what is actually being described?
Nick,
Forcing what? TEMPERATURE!
You are *still* trying to claim that ΔT₀ is something other than *TEMPERATURE*.
Do you truly understand just how idiotic you are looking in doing this?
Now you are trying to claim that anomalies are not actual temperatures?
Again, ROFL!!!
Anomalies come from actual temperatures, be it specific temperatures at a specific station or be it from the difference calculated from something like an “average” global temperature.
The whole point of Hansen’s paper is that if we don’t do something the entire earth is going to burn up from higher and higher temperatures.
From the caption of B1: “Here ΔT₀ is the TEMPERATURE CHANGE AT EQUILIBRIUM”
From the summary: “Our model results suggest that global greenhouse warming will soon rise above the level of natural climate variability. The single best place to search for the greenhouse effect appears to be the global mean surface air temperature.”
You can talk all you want about forcings and CO2 concentrations, the truth is that you are doing nothing but throwing up a smokescreen.
This is actually where the idiocy of a “global mean surface air temperature” gained significance. 1. A mean can’t tell you whether minimum temperatures are going up or whether maximum temps are going up. 2. The uncertainty of that global mean is at least 20C. Meaning no one knows if it is going up or down!
What Hansen did was put in everyone’s mind that it is max temps that are growing and it will cause the earth to turn into a cinder. That idiocy has never been able to be scuttled since the MSM and the Democrats won’t allow it to penetrate the public perception. They use the fear of the earth burning up to gain political power.
Nick is being “disingenuous/deceitful” yet again
HAS to use the El Nino spikes in a corrupted data set to try to make a FAKE point.
2015 El Nino transient was only a fraction a small degree warmer than the 1998 El Nino.
And to put that grey shading in, when the Eemian and Holocene optimum were at least a few degrees warmer than now, really is the height of DELIBERATE MISINFORMATION.
Nobody is interested in non-data fabricated to meet the models
Stop being so disingenuous.
And Mo-WHO ? He was one of the 3 stooges wasn’t he.
A worthless CON site if ever there was one.
A suppository of anti-information.
WRONG
It is as close to UAH overlay as I could draw it
Here is UAH yearly graph.
…so EVERYONE can see just how disingenuous and deceitful you are being
You really have dropped to the lowest form of AGW sympathiser.
“It is as close to UAH overlay as I could draw it”
Your first graph correctly showed GISS and Hadcrut, measures of the surface temperature that Hansen was calculating. Then you switched to UAH (tropospheric) without telling us? And called that an update? Why?
Again, Hansen was predicting surface temperature, not lower troposphere.
GISS and Hadcrut are NOT measured surface temperatures
You KNOW that.. so STOP LYING.
GISS et al are “once-was-data” heavily affected by urban warming, infilling, homogenisation and general data corruption.
They as FAKE as you are.
UAH is the only reliable temperature data that hasn’t been massively tampered with by your scamster mates in their vain attempt to make them match the FAKE models.
Your attempts to use FAKE DATA to try and support your LIES, is hereby noted by everyone.
“Your attempts to use FAKE DATA”
It was your comment that showed GISS and HADCRUT. Then you switched to UAH and claimed it was an “update” (without telling us of the switch).
In any case, whatever the merits of UAH, it is not a measure of what Hansen was predicting, which is surface temperature.
GISS et al are FAKE DATA.
Sooner you realise that, the better for your little brain-washed mind to grasp REALITY.
So Nick thinks surface trends and lower troposphere trends should be wildly divergent. Would love to hear that explanation 😉
He is trying to misinform that surface warms faster than the troposphere….yet the CO2 is in the atmosphere, NOT on the surface.
The surface data is taken from sites which are sparsely located, constantly changing, many of which are so heavily contaminated by urbanisation effects as to be TOTALLY WORTHLESS for the purpose of estimating temperature changes over time
These are fudged and mangled together with all sorts of smearing and infilling and homogenisation and other data corruption procedures.. to give just what they want it to give….
… and end up representing a whole heap of urban warming that is really only a small part of the globe and is totally unrepresentative of real global temperatures.
TOTALLY UNFIT for use as “climate” anything !!
“So Nick thinks surface trends and lower troposphere trends should be wildly divergent.”
I don’t have an opinion about whether they should be. The point is that Hansen was predicting surface temperatures, and he got that right. The lower trop is something else.
But what are wildly divergent are UAH V5.6 and V6
https://moyhu.blogspot.com/2015/12/big-uah-adjustments.html
And also UAH V6 and RSS V4. In fact, while UAH trends more slowly than surface, RSS rises faster. It seems just a lot harder to get a consistent measure of lower trop than of surfare (even for UAH between versions).
NO, HE DIDN’T , not remotely. !
GISS is NOT representative of real surface temperatures.
You KNOW that, that is why you continue to use it.
—
That old “correction” for a know satellite issues farce, hey Nick. And by small decimal degrees at that.
Compare to the MASSIVE and WHOLESALE and CONTINUAL adjustments to “raw data by GISS et all
You can do better than that…… or can you.
—
GISS is wildly divergent from UAH and from REALITY.
RSS is now “adjusted ” using climate models
Thus has become meaningless.
DON’T PRETEND you don’t know these facts
—-
Lapse rate has not changed, trends should be the same
So SAD that your basic comprehension is SO WARPED by your manic need for human CO2 cause warming to actually be real, that you are forced to such great lengths of DISINFORMATION.
And again, that GARBAGE Mo-WHO site.
WHY link to such blatant propaganda ?
So you have just admitted that you are more than willing to accept FAKE DATA
But we have known that for quite a long time, haven’t we.
“And also UAH V6 and RSS V4. In fact, while UAH trends more slowly than surface, RSS rises faster. It seems just a lot harder to get a consistent measure of lower trop than of surfare (even for UAH between versions).”
Which is exactly the same phenomenon as the direct measurement of surface temperature! The various satellite constructions are different because of different methods for interpreting the actual satellite data – which is *not* a direct temperature measurement. The surface temp constructions differ because of different methods used to smear, homogenize, and infill the temperature data.
I’ll ask again, since Nick has avoided the question
Which of the climate models is validated by showing a peak in the 1940s in the Arctic region, followed by a 2ºC drop to the 1960s?
WAITING !!
Still WAITING !!
You will wait forever.
yes, that’s the usual dodge
but it’s fatuous… Hansen’s Senate presentation predicted temperatures based on emissions scenarios
emissions are clearly A “business as usual”, not B “frozen emissions” or C “draconian cuts”
temperatures are either C or B, depending on how hard you squint
Hansen was wrong, misled Congress, and either lied about the appropriate confidence level of his estimates or was grossly incompetent
in either case he was then showered with official approbation and millions of dollars in completely unethical environmental “prizes” for his “science”
Feynman would slap you all silly
the funniest part of this is that if you want, you can actually cherrypick a starting point in 1988 in UAH that is WARMER than December 2020 (anomaly .27 vs .4)
making the trend NEGATIVE
sure, that’s exactly what Hansen predicted
lol it’s just amazing these people can talk with a straight face
Hilarious Nick. Compare trends.
Nick quoted me writing, “Hansen & his team predicted +0.5°C/decade from…”
and then Nick responded, “He didn’t predict that.”
Come on, Nick. Please don’t fragment my sentences to change the meaning.
Hansen & his team predicted that that would be the result of a +1.5% annual increase in GHG emissions.
Hausfather, Nuccitelli, etc. pretend that the reason temperatures increased so much slower than the predictions of Hansen’s “Scenario A” is that emissions increased much slower than in Scenario A. But for CO2 that is a blatant lie, because CO2 emissions actually increased even faster than that: by an average of 1.97% per year, totaling 66% in 26 years.
Nick wrote, “It isn’t a prediction that such a change will occur. His predictions are given in the graphs.”
Here’s the quote, from their paper:
Are you suggesting that was not intended to convey the impression that “computed temperature changes” were “0.5°C per decade”?
Come on, be serious. You know that was their intended meaning.
If they did not truly think that +0.5°C/decade was the likely result of continuing what Hansen told Congress were “business as usual” emissions (Scenario A), then they were deliberately lying. If they did think that was likely, then they were just wrong.
“Just wrong” is the charitable assumption.
That said, in my article I did point out that their text and graphs were somewhat inconsistent:
(Of course, even 0.37°C/decade is still wildly inaccurate.)
Nick quoted me writing, “But the mistake which affected their results the most was that they did not anticipate the large but slow CO2 feedbacks,”
and Nick responded, “No, they did not make such a mistake.”
Oh yes, they did. Throughout the paper, including in the quote above, Hansen et al referred to changes in “emissions” and changes in atmospheric GHG levels interchangeably. That obviously means that did not anticipate that natural CO2 removal rates would accelerate.
Nick wrote, “All Hansen’s calculations are made in terms of actual CO2 concentrations in the atmosphere.”
Exactly! That’s what proves that they didn’t anticipate that negative CO2 feedbacks would remove CO2 from the atmosphere at an accelerating rate: they repeatedly referred to changes in atmospheric concentration as changes in “emissions.”
Do you think that Hansen and his seven co-authors didn’t know what “emissions” are?
Nick wrote, “He did not have measures of actual source emissions (amount burnt);”
That’s absurd. The main part of that data (fossil fuel production/use) has long been available, to Hansen, and to everyone else. The economic bean counters are very good at keeping track of fossil fuel production and use, and those data got lots of attention during the 1970s Energy Crisis.
Where do you think this data came from? World annual production of crude oil can be found on p.148 of the 1987 World Almanac and Book of Facts.
Hansen and his co-authors referred to changes in CO2 concentration as changes in “emissions” because they didn’t understand that they aren’t the same thing, because they did not anticipate that rising CO2 levels would cause a dramatic acceleration in natural CO2 removal processes.
Nick wrote, “when he speaks of emissions, his measure is the observed change in CO2.”
Exactly! That’s how you can tell that they were clueless about the upcoming acceleration of the natural processes that remove CO2.
Nick wrote, “So he did not make any prediction, right or wrong, about the response of CO2 in the air to CO2 burned.”
I assume that by “CO2 burned” you really mean “CO2 produced from burning fossil fuels and making concrete.” (Because CO2 doesn’t burn.)
That is the definition of anthropogenic CO2 emissions.†
Every one of those eight authors surely knew what the word “emissions” means. (“CO2 and other trace gas emissions” is what their paper said.)
Here’s another prediction they made in that paper:
That obviously didn’t happen, not even using GISS’s data. GISTEMP shows only about 0.2°C of warming from 1988 to 2003 (and the rate slowed after that).
Nick wrote, “He defined his projections relative to the increases in GHG concentrations, which he did not predict, but adopted scenarios for calculation.”
The word they used, over and over, was “emissions.” They knew what that word means.
Nick wrote, “This is required, because scientists cannot be expected to predict how much GHG we will choose to emit in the future.”
That’s why they described three different emission scenarios. Hansen called “Scenario A” the “business as usual” scenario, with respect to GHG emissions, and wrote that “Scenario C assumes a rapid curtailment of trace gas emissions such that the net climate forcing ceases to increase after the year 2000.”
I would never trust the future work of a computer programmer who wouldn’t admit to the bugs in his previous work. So when the climate modelers try to pretend-away the massive failures of their past models, they just add to my distrust of their future models.
That’s in addition to the two more fundamental problems with GCMs (climate models):
● One problem is that they’re modeling poorly understood systems. (The widely varying assumptions in the GCMs about parameters like radiative forcing and climate sensitivity proves that the Earth’s climate systems are poorly understood.)
● The other problem is that their predictions are for so far into the future that they cannot be properly tested.
Computer modeling is used for many different things, and it is often very useful. But the utility and skillfulness of computer models depends on two or three criteria, depending on how you count:
1(a). how well the processes which they model are understood,
1(b). how faithfully those processes are simulated in the computer code, and
2. whether the models’ predictions can be repeatedly tested so that the models can be refined.
The best case is modeling of well-understood systems, with models which are repeatedly verified by testing their predictions against reality. Those models are typically very trustworthy.
When such testing isn’t possible, a model can still be useful, if you have high confidence that the models’ programmers thoroughly understood the physical process(es), and faithfully simulated them. That might be the case when modeling reasonably simple and well-understood processes, like PGR. Such models pass criterion #1(a), and hopefully criterion #1(b).
If the processes being modeled are poorly understood, then creating a skillful model is even more challenging. But it still might be possible, with sustained effort, if successive versions of the model can be repeatedly tested and refined.
Weather forecasting models are an example. The processes they model are very complex and poorly understood, but the weather models are nevertheless improving, because their predictions are continuously being tested, allowing the models to be refined. They fail criterion #1, but at least they pass criterion #2.
Computer models of poorly-understood systems are unlikely to ever be fit-for-purpose, unless they can be repeatedly tested against reality and, corrected, over and over. Even then it is challenging.
But what about models which meet none of these criteria?
I’m talking about GCMs, of course. They try to simulate the combined effects of many poorly-understood processes, over time periods much too long to allow repeated testing and refinement.
Even though weather models’ predictions are constantly being tested against reality, and improved, weather forecasts are still often very wrong. But imagine how bad they would be if they could <i>NOT</i> be tested against reality. Imagine how bad they would be if their predictions were for so far into the future that testing was impossible.
Unfortunately, GCMs are exactly like that. They model processes which are as poorly understood as weather processes, but GCMs’ predictions are for so far into the future that they are simply untestable within the code’s lifetime. So trusting GCMs becomes an act of Faith, not science.
(† modulo minor factors, like land use changes)
Dave: “That said, in my article I did point out that their text and graphs were somewhat inconsistent:”
The reason is that the text didn’t make a prediction, and your reading from the graph is wrong as well. I posted the actual graph above:
with the subsequent GISS history superimposed.
We have been through your confusion of Hansen’s scenario definitions before. They were quite precise, and in terms of gas concentration only. He did not cite or use any information about tons of CO2 emitted. His 1.5% was a rate of increase in the annual increment of ppm in the atmosphere. Steve McIntyre actually looked at the formulae he specified, and calculated the scenarios and related them to observed CO2 ppm here
https://climateaudit.org/2008/01/17/hansen-ghg-concentration-projections/. His graph is here
CO2 was tracking below scenario B, and that continued. But also significant were the other GHGs, particularly CFC’s. At that stage the Montreal agreement was not completed, and Hansen assumed that CFC increase would continue.
“Exactly! That’s what proves that they didn’t anticipate that negative CO2 feedbacks would remove CO2 from the atmosphere at an accelerating rate:”
Their calculation did not, and could not, anticipate that. It relates ppm to emission tonnage, and they had no numbers on tonnage. So they only deal with CO2 ppm observed, regardles of how it got there.
“Do you think that Hansen and his seven co-authors didn’t know what “emissions” are?”
They worked with the best information they had, observed ppm. Just as we still do with methane. It took concerted government action following the UNFCC to get good global numbers on CO2 tonnage emitted.
There is a simple challeneg for you there – if you think they meant emissions in tons, find a single place where they cite such a number, or even a source. They don’t. maybe you think they should have, but they didn’t. They calculated the scenarios in future ppm, as McIntyre graphed above, and that is the only way they can be evaluated.
GISS is NOT representative of surface temperatures
It diverges WILDLY from REALITY
Your reliance on FAKE DATA says everything that needs to be said
A DELIBERATE stream of anti-information.
Real temperatures track Hansen’s “C” scenario.
Hence showing there is no difference for having increased atmospheric CO2
GET OVER IT and stop trying to flog a dead horse.
Nick wrote, “The reason is that the text didn’t make a prediction…”
Good grief, Nick, repeating that won’t make it any more true.
The predictions made by Hansen et al (1988) were for what temperatures would do in the event of several emission scenarios. For example, they wrote:
That was a low-end prediction, because scenario C was for impossibly extreme emission cuts, which could not and did not happen. But, even with those impossible emission cuts, according to Hansen et al we were going to get 0.5°C of warming “within the next 15 years” (i.e., by 2003).
Even using GISS’s data, we actually got nowhere near that much warming. GISTEMP shows only 0.23°C of warming from 1988 to 2003 (and the rate slowed after that).
Nick wrote, “and your reading from the graph is wrong as well.”
My reading of the graph is not wrong. I also linked Hansen’s actual graph, but I didn’t included a standalone link, so it didn’t get in-lined in my comment. So here it is:
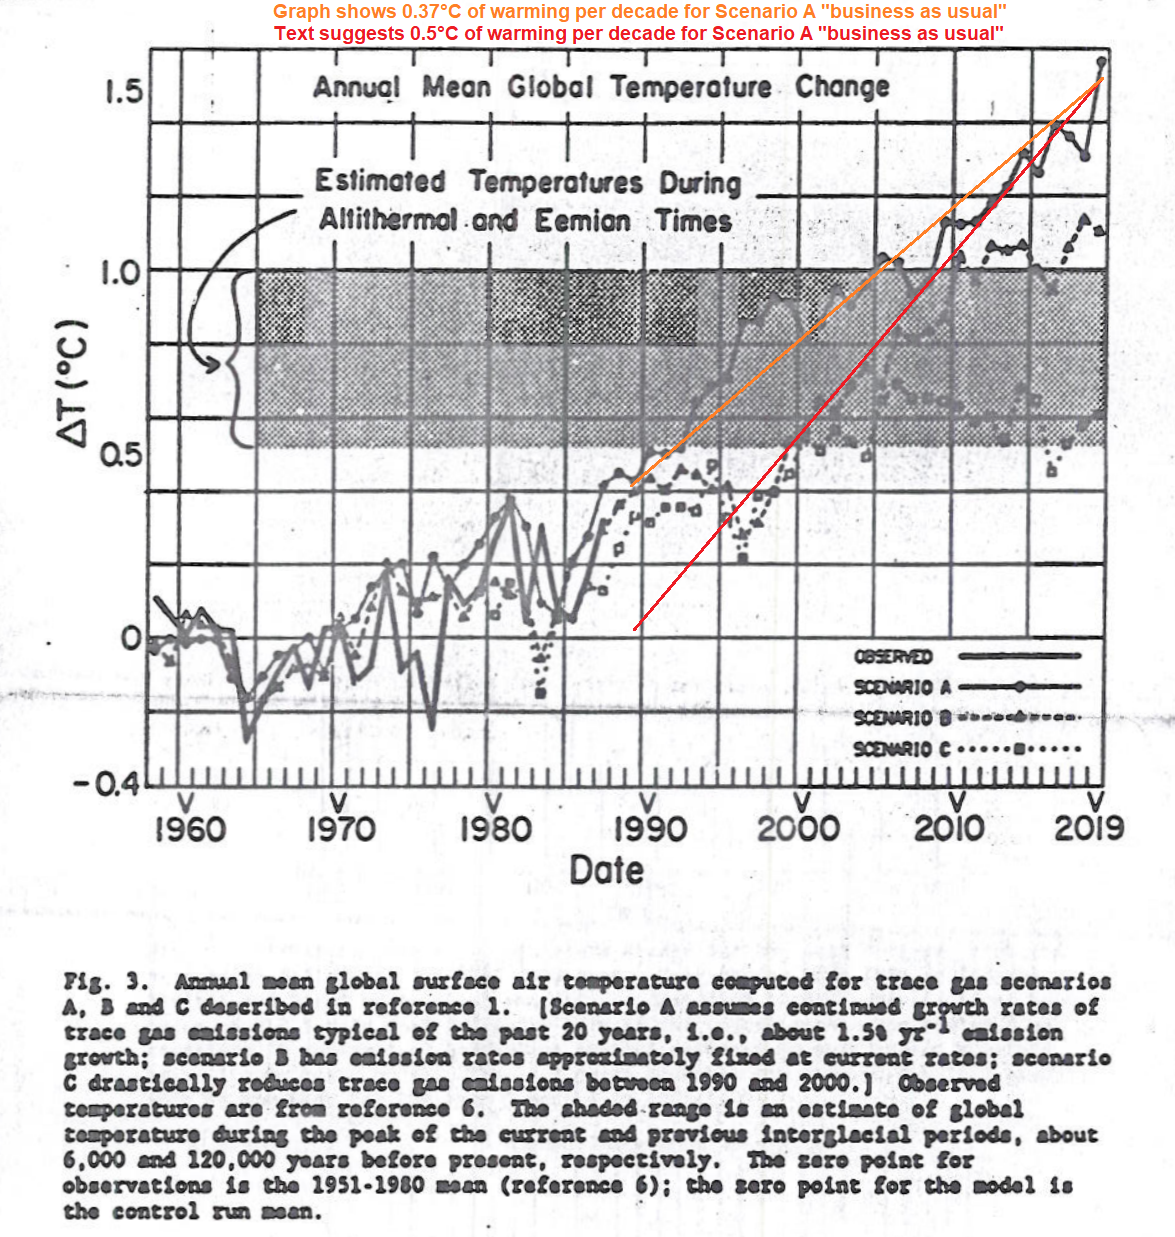
As you can see, the graph shows about 0.37°C/decade of warming for Scenario A “business as usual,” though the text implied 0.5°C/decade.
Reality, of course, was far less than either number.
Nick wrote, “We have been through your confusion of Hansen’s scenario definitions before. They were quite precise, and in terms of gas concentration only.”
Nick, we’ve been through your obfuscation of Hansen’s blunders, before. How on earth can you pretend that Hansen’s scenario definitions were “in terms of gas concentration only,” when I just finished quoting the paper’s definition of scenario A in terms of emissions (not gas concentration)?
Here’s the quote, again:
The fact that the paper uses the term “emissions” interchangeably with changes in atmospheric concentration doesn’t mean they were using a new, secret definition for the word “emissions,” which they didn’t bother to mention, and which isn’t to be found in any dictionary. It just means that they wrongly assumed that whatever additional GHGs were emitted into the atmosphere would stay there. Only under that assumption could concentration changes and emission changes be identical.
In other words, they had no inkling that powerful negative CO2 feedbacks would remove CO2 from the atmosphere at an accelerating rate.
Nick wrote, “He did not cite or use any information about tons of CO2 emitted. His 1.5% was a rate of increase in the annual increment of ppm in the atmosphere.”
That’s because they wrongly assumed the emissions and the concentration change would be identical.
In fact, in many places in the paper they didn’t even bother to distinguish between emissions and concentration changes. For instance, consider this longer version of the above excerpt, in which they defined scenarios A and B. For scenario A they referred to “growth rates of trace gas emissions” but for scenario B they just said “trace gas growth rates,” which could refer to either emissions or concentrations. They didn’t bother to distinguish between the two interpretations because they wrongly assumed that they were equivalent.
Of course, the mistake which jumps out and screams at us is their absurd claim that an annual 1.5% (i.e., exponential) increase in GHGs emissions & concentration would cause an exponential “net greenhouse forcing” increase.
That was a truly astonishing blunder. Even in 1988 it was common knowledge that CO2 (the most important of the GHGs they discussed) has a logarithmically diminishing forcing effect on temperature. So an exponential increase in CO2 level causes a less-than-exponential increase in forcing, asymptotically approaching linear — not exponential.
Yet, apparently none of those eight illustrious authors recognized that that claim was wrong. I cannot imagine how such an obvious goof got through the AGU’s peer review process.
But do not overlook their other error, which was their assumption that an exponential increase in CO2 emissions would cause an exponential increase in CO2 concentration. That was based on their wrong assumption that an increase in emissions would cause an equal magnitude increase in concentration. They obviously had no idea that rising CO2 levels would cause negative (stabilizing) CO2 feedbacks to remove CO2 from the atmosphere at an accelerating rate.
Nick wrote, “They worked with the best information they had, observed ppm. Just as we still do with methane.”
Bunk. The CO2 emission data from fossil fuels and cement mfg was and is readily available. They didn’t ignore it because it was unavailable, they just didn’t bother with it. They assumed they didn’t need it because they wrongly assumed that changes in emissions equal changes in concentrations, because they were completely clueless about CO2 feedbacks.
Dave
” For example, they wrote:...”
You keep trying to twist stray bits of language you find into a prediction, and then claim a contradiction with the explicit actual predictions made in the graph. The meaning of that excerpt is clear if you look at that graph. Scenario C does indeed reach 0.5C on the graph in 2003. But it didn’t start from 0 in 1988, but from about 0.2. Hansen, in these statements, is not throwing out new and contradictory results; he is describing the results he has clearly set out in the graph.
“As you can see, the graph shows about 0.37°C/decade of warming…”
Well, that is indeed an eyeball estimate. But it is based on joining up the Scen A part around 2020 with the Scen C part in 1988.
“How on earth can you pretend that Hansen’s scenario definitions were “in terms of gas concentration only,” when I just finished quoting the paper’s definition of scenario A in terms of emissions (not gas concentration)?”
Because you are again relying on forcing words into your interpretation, rather than looking at what is quantified, and how. It is natural now to think of emissions in terms of measured tonnage. But Hansen didn’t have those numbers, so he expressed emissions in terms of ppm increment. Again, there is that test – can you find anywhere where he has used or cited any tonnage data. If he speaks of quantified emissions, and has only ppm data, he must be speaking of a ppm increment.
Steve McIntyre understood that:
“One idiosyncrasy that you have to watch in Hansen’s descriptions is that he typically talks about growth rates for the increment , rather than growth rates expressed in terms of the quantity. Thus a 1.5% growth rate in the CO2 increment yields a much lower growth rate than a 1.5% growth rate (as an unwary reader might interpret).”
“That was a truly astonishing blunder. Even in 1988 it was common knowledge… ”
Again, you just don’t read properly. The logarithmic relation you mention is between forcing and temperature. An exponential rise in forcing would cause a linear rise in temperature. Hansen did not say there would be an exponential rise in temperature. He said correctly there would be an exponential rise in forcing.
“We have been through your confusion of Hansen’s scenario definitions before. They were quite precise, and in terms of gas concentration only.”
Nick, you deserve some sort of award for repeating something you must know is a lie so often and shamelessly…perhaps given Biden’s fondness for Goebbels they can award you a medal with his likeness
as you well know, Hansen’s presentation to policymakers was part of a Senate hearing on the topic of regulating emissions (with the air conditioners turned off for dramatic effect) and included three emissions scenarios, quite clearly labelled as such
not three randomly chosen levels of CO2 concentration with no policy relevance
and in fact of course he joined the panel in strongly urging Congress to limit emissions before returning to his busy schedule of receiving awards from environmental groups and being arrested at coal plants
From NYT:
If the current pace of the buildup of these gases continues, the effect is likely to be a warming of 3 to 9 degrees Fahrenheit from the year 2025 to 2050, according to these projections. This rise in temperature is not expected to be uniform around the globe but to be greater in the higher latitudes, reaching as much as 20 degrees, and lower at the Equator.
…
Dr. Woodwell, and other members of the panel, said that planning must begin now for a sharp reduction in the burning of coal, oil and other fossil fuels that release carbon dioxide.
…
Several Senators on the Committee joined witnesses in calling for action now on a broad national and international program to slow the pace of global warming.
or the transcript:
The other curves in this figure are the results of global climate model calculations for three scenarios of atmospheric trace gas growth. We have considered several scenarios because there are uncertainties in the exact trace gas growth in the past and especially in the future. We have considered cases ranging from business as usual, which is scenario A, to draconian emission cuts, scenario C, which would totally eliminate net trace gas growth by the year 2000.
he also predicted increased drought in the Midwest (there was a drought in 1988, so naturally Hansen, ever the propagandist, tried to shoehorn in that bogeyman too), which of course did not happen either
https://www.drought.gov/dews/midwest
Nick wrote, “The logarithmic relation you mention is between forcing and temperature. An exponential rise in forcing would cause a linear rise in temperature. Hansen did not say there would be an exponential rise in temperature. He said correctly there would be an exponential rise in forcing.”
You’ve got that backwards, Nick. I am surprised that you are confused about it.
The logarithmic relation is between CO2 level and radiative forcing, not between radiative forcing and temperature.
The relation between radiative forcing and temperature is approximately linear.
Well, almost linear. Radiative emissions from a warm body are proportional to the 4th power of the body’s absolute temperature (temperature in Kelvin), so cooling does accelerate more rapidly than temperature as temperatures rise. (That’s a negative/stabilizing feedback, which helps regulate the Earth’s temperatures.) But the temperature changes we’re talking about are so small relative to the absolute temperature that the relation is almost linear. The radiative forcing required to cause 1°C of global warming is variously estimated to be 3.2 to 3.7 W/m².
A linear rate of increase in CO2 level causes a logarithmically diminishing rate of increase in radiative forcing. (Note that I’m just talking about CO2; it’s not true of other trace GHGs.)
There is no dispute about this fact. The only argument is about the coefficient which relates radiative forcing change to logarithm of CO2 level change. For a few good references see:
https://sealevel.info/learnmore.html#physics
The formula for estimating radiative forcing (RF) from a change in CO2 concentration is usually given as:
ΔF = 𝞪·ln(C/C₀) W/m²
where:
C/C₀ is the ratio of new to old CO2 concentrations
Often it specified as the radiative forcing per doubling of CO2, i.e., ln(2)·𝞪. That’s what is shown in the first two columns of AR5 Table 9.5. As you can see there’s a great deal of variation in the estimates of that coefficient, between the various models.
Myhre 1998 & the IPCC (TAR & later) estimate:
𝞪 = 5.35 ±0.58 (which is 3.7 ±0.4 W/m² per doubling of CO2)
Happer 2013 reports calculating, based on corrected modeling of CO2 lineshapes, that that’s ≈40% too high, which makes:
𝞪 ≈ 3.8 ±0.5 (which is 2.6 ±0.5 W/m² per doubling)
Myhre’s estimate is about 15% lower than the previous IPCC estimate of:
𝞪 = 6.3 (which is 4.4 W/m² per doubling; see SAR §6.3.2, p.320)
AR5 reports that RF estimates for a doubling of CO2 assumed in 23 CMIP5 GCMs varies from 2.6 to 4.3 W/m² per doubling, so:
𝞪 ≈ 3.7 to 6.2
Prof. Joshua Halpern reports:
𝞪 = 4.35
Feldman et al 2015 measured downwelling longwave IR “back radiation” from CO2, at ground level, under clear sky conditions, for a decade. They reported that a 22 ppmv (+5.953%) increase in atmospheric CO2 level resulted in a 0.2 ±0.06 W/m² increase in downwelling LW IR from CO2, which is +2.40 ±0.72 W/m² per doubling of CO2.
However, ≈22.6% of incoming solar radiation is reflected back into space, without either reaching the surface or being absorbed in the atmosphere. So, adjusting for having measured at the surface, rather than TOA, gives ≈1.29 × (2.40 ±0.72) per doubling at TOA, and dividing by ln(2), yields:
𝞪 ≈ 4.47 ±1.34 (which is 3.10 ±0.93 W/m² per doubling)
That’s very close to Halpern’s “4.35”, and closer to Happer’s “3.8” than to Myhre’s “5.35,” but the uncertainty interval is wide enough to encompass all three estimates. It does preclude the SAR’s “6.3” figure.
Rentsch 2020 (draft), analyzed AIRS satellite spectroscopy, and found that under nighttime, cloud-clear conditions, a 37 ppmv CO2 increase caused +0.358 ±0.067 W/m² radiative forcing increase at TOA, which is:
𝞪 = 3.79 ±0.71 (which is 2.62 ±0.49 W/m² per doubling)
That’s about 70% of Myhre 1998, and very close to Happer’s result.
Note that, although there’s a wide range of estimates for the coefficient, 𝞪, all sources agree that the relationship between CO2 level and radiative forcing is logarithmic.
I am astonished that Hanen et al (1988) contained such an obvious blunder. It is just amazing to me, not only that Hansen got it wrong, but also that none of the other seven authors, and none of the AGU’s peer reviewers spotted the error.
Nick, are you there?
“They were quite precise, and in terms of gas concentration only. He did not cite or use any information about tons of CO2 emitted. “
ROFL!!!
Gas concentrations don’t depend directly on the tons of CO2 emitted? And the CO2 concentration per time doesn’t depend on CO2 emitted over time?
You are using an argumentative fallacy known as Equivocation – trying to change the definition of an issue in order to obfuscate reality.
While I agree with your assessment of eke Hausfather’s disinformation, your September screed on Dr Atlas and COVID couldn’t have been more wrong. We don’t quarantine healthy people. We quarantine infected –that is, Proven infected. Destroying people’s lives economically is going to far more deadly in the long run than this cold virus.
Joel,
Really, we don’t quarantine healthy people? Then what have all the stay-at-home orders been except quarantines of healthy people?
I think Joel was speaking rhetorically.
He meant that it is stupid to quarantine healthy people.
Joel is assuming the “we” that is not idiotic or power hungry.
Well, thank you for reading it, anyhow. If anyone else wants to read my WND “September screed,” or my Washington Times December screed, or my other Covid-related resources, click the links.
Historically, quarantines have isolated people & animals who are sick from a contagious disease, AND also those who are feared to have been exposed to a contagious disease, AND also those who are suspected of being carriers, even if they are not sick, themselves.
During the 1918 flu epidemic, quarantines were typically by household: if anyone in your household had flu-like symptoms, the entire household was assumed to have been exposed, and was quarantined, for the safety of the community. In April I spoke with an elderly lady whose mother had told her about living through the 1918 flu pandemic, which killed an estimated 2% of the entire world’s population. Her mother had told her that in 1918 she’d been confined to a household which consisted of a woman and several children. Her mother told her that they’d not been allowed to leave, and that a truck came through the neighborhood periodically, to pick up the bodies. Her mother told her that they would have frozen to death, but for the kindness of a neighbor (whom she’d previously thought of as their meanest neighbor!), who left piles of firewood on their porch for them.
Likewise, even though Typhoid Mary never had symptomatic typhoid fever, she was quarantined for nearly thirty years, for the safety of the community.
Most of the Covid-19 cases that I’m personally aware of have been contracted from people who did not have proven illness: they were presymptomatic/asymptomatic, or else their symptoms were so mild that they could be mistaken for allergies.
That shouldn’t be surprising, because most people try to be responsible. Once they suspect that they have the disease, most people will self-isolate, to protect other people.
The efficient use of quarantines is how some countries, like South Korea and Taiwan, have kept Covid-19 largely under control: by working diligently to identify everyone with the disease, and everyone exposed to it, and quarantining them. The result is that South Korea’s per capita Covid-19 death rate is 2% of the U.S. per capita Covid-19 death rate.
Unfortunately, most places are incompetently run, and so they didn’t do that. That includes the United States as a whole, and all fifty individual states. The result is that (pre-vaccine) the only way to reduce the spread of the disease was to impose massively obtrusive lockdowns, mask, social distancing rules, etc.
“The snow intrigued him. As a student, Tapio Schneider was a triathlete and competitive cross-country skier in the mountains of northern Germany.”
Northern Germany has ski-race mountains ? 😀
It has downhill slopes:
https://www.skiresort.info/ski-resorts/northern-germany/
And cross-country can occur along undeveloped ridge tops or on trails which in summer draw hikers.
Actually might be referring to the Eiffels~~a low mountain range on the German/Belgium border.
Yes, the Harz Gebirge.
https://www.skiresort.info/ski-resorts/harz/
Winterberg is a well known North German ski resort for the Dutch.
To replace an actual living, breathing climate climate scientist the AI will have to be optimized to effectively write grant applications.
And the paper. And the contribution to the next IPCC report.
Already done! Do an online search for “corp speak generator” for a little titillation.
And there you have it — the most important part of any scientific endeavour these days is the amount of “diversity.”
But have they got a proper representation of all the genders and the trans?
“The other distinguishing feature, Dr. Marshall notes, is those working on it. “The model is actually less important than the team of scientists that you have around it,” he contends. In fact, the 60 to 70 researchers and programmers in the CliMA group represent a veritable United Nations.
Somebody put a map on the wall at the CliMA house, a converted provost’s home at Caltech, and asked everyone to pinpoint their homes. “There were a lot of needles,” Dr. Schneider says.”
You beat me to it … ‘DIVERSITY’ is the most important thing to these guys.
As per “… there were a lot of needles in the map ….” comment. Yes, I am guessing that there were 60 to 70 of them.
Dr. Marshall gets a HUA award.
” Meet the new boss, same as the old boss” – The Who.
The old pig broke the bank. The new pig is disguised with lipstick so they can hog a greater share of your money.
This statement blows me away for two reasons.
First, does he actually believe that who’s working on the team is more important than what the team is working on? In that case why bother producing any output at all, just spend all your money perfecting the team?
Second, is his belief that having a diverse group guarantees an excellent group.
In the real world where things must be designed, built, run, and maintained, a focus on diversity often compromises excellence.
“A camel is a horse built by a committee”
Diversity of thought and approach is desirable. Ethic and geographic diversity is worthless.
Colour, sex, race, sexual preferences etc are totally irrelevant if that person has the ability to do a job and do it well.
I had one young socialist assure me that there was no such thing as better and best when it came to workers.
Everyone was either qualified or not qualified.
Once you determined the pool of qualified candidates was, it made no difference from a business perspective which candidate you chose.
That’s why, according to him, it was impossible for racial and sexual quotas to have a negative impact on job performance.
“That’s why, according to him, it was impossible for racial and sexual quotas to have a negative impact on job performance.”
Said a socialist that never ran a competitive business!
That bit of propaganda is an Argument from Authority logic error.
Yet another example of Pournelles Iron Law of Beauracracy
It would probably suffice to replace the linear dependence of CO2 forcing (see Pat Frank) of the current models with a logarithmic one. Unfortunately, the results would probably show (Happer & Wijngarden) a very small practically negligible effect = there is no climate emergency. This would be exactly what the IPCC doesn’t want… The AI is there so that the machine learns by itself to run too hot… “i.e. the elefant designs its own wiggling trunk…)
Do current models have linear CO2 forcing. They could not be that naive surely but does anyone out there know what the model dependence on CO2 is actually assumed to be ? It looks linear.
Kudos for mentioning Pat Frank’s work. Pat is correct.
Thanks, folks. Here’s the paper.
And yes, Alistair. Climate models linearly extrapolate forcing to project air temperature.
If the AI is allowed to use the 1910-1940 warming period with the 300 ppm CO2 as a learning input, it’ll go become unstable and spew out random results.
particularly if it has to reproduce the NH COOLING from 1940-1970. 🙂
Machine learning trained on the last 30 years of bad data – I wonder what the (pre-determined) result will be? /sarc
Now a real machine-learning AI model trained on eons of astronomical cycles and long-term data like ice cores might be useful for really-long-term predictions. But nothing they will do can solve the problem of predicting anything in the next 100 years since they don’t intend to model the natural processes involved.
GIGO.
There is no “climate crisis.” So once again, they’re attempting to find a solution for a problem that is nonexistent.
Ah, that “consensus” thing again. Which “consensus” presupposes many things that are simply wrong – like human CO2 emissions “driving” the atmospheric CO2 levels, like atmospheric CO2 levels “driving” the Earth’s temperature, like a climate warmer than the Little Ice Age being one with worse, as opposed to better, weather, and like the Little Ice Age climate being some kind of “ideal” from which any departure is “bad.”
The quote should read more like “in 2015 in Paris, 190 countries agreed that the 6 countries who had developed significant wealth and prosperity from the use of fossil fuels should transfer some of that wealth to them, because [insert imaginary bad things here] will happen otherwise.”
It doesn’t matter – because there is nothing special about the pulled-out-of-their-rectum amount of temperature difference compared with a period that was catastrophically cold that anybody should be worried about. It is a cooling climate, not a warming climate, that is of concern for humans and any other life on Earth.
And they are STILL assuming two things: that atmospheric CO2 levels are driven by human fossil fuel use AND that atmospheric CO2 levels are the “driver” of the climate, neither of which is empirically supported. Both of these assumptions will ensure that their super duper new “model” will be just as useless as all the others.
Since sea levels have been rising at an average of 3mm per year for hundreds of years, a simple calculator will do; no need for a pointless “model” costing $millions. Nor does a seawall have to be built all at once. I think given modern construction equipment and techniques, they can build a sea wall faster than 3mm high per year, even throwing in the footings needed to kick off the construction.
No need for a “model” here, either. Simply examine historical droughts and floods, and prepare for (“spend” enough to accommodate) the consequences of either extreme. Stop assuming that “average” rainfall is the “normal” or “expected” amount and acting like any departure from that “average” is some kind of “crisis.” “Averages” are nothing more than a midpoint of extremes.
As for the “Artificial Intelligence” part, computers are very stupid machines – they do exactly what you tell them to. Since they are kicking this thing off with all the wrong assumptions and are not even talking about natural forces (you know, the ones that actually drive the Earth’s climate), this is another stillborn “GIGO” exercise to liberate taxpayer money from someone else’s pocket so they can paint themselves as the world’s “saviors.”
There is no “climate crisis.” So once again, they’re attempting to find a solution for a problem that is nonexistent.
And with their new model they will realize it finally 😀
We can hope but we’re more than likely going to be disappointed with this shocking waste of money.
I see a bigger plan here. The 29 current state-of-the-art models have produced spaghetti graphs for decades. The values projected range from “hot” (Canadian models) to little change (Russian models), and the climate sensitivity has remained between 1.5 and 4.5 degrees. This new group will be the UN group. The new models will be lauded as “robust”, and replace all the “national models”. The variations in projections will disappear, and the UN accepted model will define all mitigation and adaptation strategies. It is all part of NWO.
Let’s see the validation comparing the results with the reality.
AGW
You said, “… computers … do exactly what you tell them to.”
That is true for conventional programming. However, one of the criticisms of AI is that approaches such as ‘neural nets’ are essentially ‘black boxes’ where it is very difficult to understand what has been done and why. One has to trust the results and be pragmatic — does it work?
See especially the section on “Criticism” in the following:
https://en.wikipedia.org/wiki/Artificial_neural_network
How do you program in the “We have to decide, as individuals, how (dis)honest we need to be in order to get our message out & accepted by the public.”
Or does the AI figure this part out on their own.
I think they mean AI and his cronies will figure it out 😉
As a serious answer, the way to bias a neural net is by selecting what data sets are fed to it. The garbage out is only as good as the garbage in.
The most interesting part of your linked sites is not the “Criticism” section but the training section:
“Neural networks learn (or are trained) by processing examples, each of which contains a known “input” and “result,” forming probability-weighted associations between the two, which are stored within the data structure of the net itself. The training of a neural network from a given example is usually conducted by determining the difference between the processed output of the network (often a prediction) and a target output. This is the error. The network then adjusts its weighted associations according to a learning rule and using this error value. Successive adjustments will cause the neural network to produce output which is increasingly similar to the target output.” (bolding mine, tpg)
In other words, these AI “learning” systems learn how to give the desired (target) output! It’s not any different than the current models that are programmed to give a desired output.
Tim
See my response to DonM above. Yes, AI can be manipulated, but it is a little more difficult than typical deterministic programming where one has to explicitly choose the parameterizations, values for branching logic tests, and ignore uncertainty ranges in the data and intermediate calculations.
You actually just framed the issue with CGM’s quite well. The earth represents a chaotic system, i.e. the state of the future climate is not always deterministic from an initial condition, e.g. a global mid-range temperature calculated today. There are far too many unknown physical interactions in the thermodynamic system we know of as the earth that will screw up any deterministic conclusion.
When you train the AI with input sets that *all* give the same output then you are creating a deterministic programming set n the AI. It may not be a human programmed set of logic choices but you will create a fixed set of “neuron” links in the AI, all leading to the same conclusion every time. It’s inevitable. If the only word the AI knows how to say is “one” then that is what it will say.
In other words, if the problem was given to an average, well educated human, along with reliable data, he’s likely to say, “naw, pull the other one.” Computers have no sense of humour, no judgement and no ability to tell right from wrong. Much of the input and output of GCMs can be assessed in minutes by a relatively knowledgeable person as utter rubbish … the Emperor’s new clothes.
How similar is this machine intelligence to simply consulting an oracle in a temple or cave?
Oh Oracle’s are far better!
Same problems, even if they give the right answer you have no idea why. Major problem with machine learning is that the software give you answers but it doesn’t tell you why it got those answers.
A major difference is that the “machine intelligence” does not require any intoxicants.
When they say “using AI and machine learning”, it is an admission that they have no idea what drives climate variability.
“using AI and machine learning” = “we don’t know”
It can also mean: “we’re now able to take even greater liberties with whatever the hell results we got from playing with these toys and all this “input stuff” (imagined data).”
Of course Nostradamus predicted this would happen – it’s all there in his book! sarc
More religion. I am not a scientist here, but is it not true that the natural drivers of climate are largely not understood and are still unpredictable? And they want me to believe they can model the future behavior of these drivers?
Did they see the 18-year hiatus in the satellite temperature record coming? These guys are not so much scientists any more as they are some type of high priests. I guess that makes me a religious heretic. I should consider myself fortunate that they don’t burn heretics at the stake anymore.
Tomas de Torquemada, where are you when the climate modelers need you?
There are so many outrageous, laughable statements contained in the above article’s quoted comments from the “climate modelers”.
Here are my two favorites:
1) From Dr. Hausfather: “Climate skeptics … were arguing that climate models always predict too much warming.” After studying models done in the past 50 years, Dr. Hausfather says, “it turns out they did remarkably well.”
—The second quote is just false. Just examine the graph from John Christy’s 2016 testimony to the House Committee on Science, Space and Technology where he compares, for global mid-tropospheric temperature variations, the 5-year running averages outputs of 26 different climate models over the span of 1979-2015 (CMIP5) against the measured data from 4 weather ballon datasets and 3 satellite datasets. As of 2015, only one model, the Russian model “INM-CM4” (Volodin, et al., 2010), was close to matching the observational data. The other 25 models were factors of 2 to 4 times higher in their predictions of warming. By no rational argument is that performance of the models “remarkably well”.
2) “Dr. Schneider envisions ‘training’ their model with the last three decades of data, and then routinely feeding it the latest updates. The model itself could ‘learn’ from the data and calibrate its performance with formulas refined by AI, even as the climate changes.”
— If done fairly and without introducing bias into the AI routines, one can confidently predict the AI output would be along the lines of: By 2050.0, the GLAT will rise by 0.1277 °C ± 2.5139 °C. Yeah, that will be very helpful . . .
Basically everything Zeke says can be guaranteed to be on the FAKE side of reality.
There are some things where there are rubust results. What does that mean?
If all your models contain the same fundamental error, your results may be robust, they are not necessarilly correct.
“Robust” is 1990’s lingo to try to look confident and tough. Much used by the Blair Government. Everything was “robust” in those days.
Lessons learned: when somebody says they have “robust results”, it means they don’t, and they hope a bold statement of confidence means you won’t check.
“Robust” was the ‘buzz word, du jour, for all things government and pseudo science. It was often inked with the concept of “settled science” and fictional data.
I hope the new group includes Pat Frank or someone of his ilk so they can help them determine whether the output of the model has any statistical validity whatsoever.
Pat get’s my vote.
PF’s card is marked. He has too much integrity.
FORTAN is faster than Python? It has nothing to do with the languages. Python is an interpreted language, just as JAVA is. That way you only need to write an engine that converts that information into something the computer can execute (i.e., machine code). Those interpreters are often written in C. Why? Because the operating systems are usually written in C. You have to write FORTAN compilers for each specific machine that you’re running it on due to the different instruction sets in the actual hardware.
If you wanted to write really fast code you’d write in assembly language (though maintainability would be a nightmare). Someone could even write a compiler for Python that would do the same as FORTAN. FORTRAN has stuck around because of legacy code not because it’s super fast. And it’s easy to create bad software of which climate models are the poster child. I don’t know Julia so I can’t make a comparison but almost any modern language would be a better choice.
FORTRAN is faster. And I don’t think you could write a compiler for Python that would “do the same as FORTRAN.” It doesn’t work that way for highly dynamic scripting languages.
There are always tradeoffs.
I am a retired computer programmer-analyst and have always wondered if FORTRAN was still around and being used. It dates back to what, the 1960s? I recall learning the language in my younger days (among others) but ultimately worked with a different one in my job.
FORTRAN, if I recall, is primarily used in science, engineering and mathematics, is it not?
FORTRAN stands for FORmula TRANslator.
I suspect that FORTRAN and Cobol will still be around when all the current crop of ‘better’ programming languages such as JAVA and Python are long forgotten. Even BASIC has disappeared, despite being very popular at the beginning of the personal computer revolution.
Mathematicians and Physicists usually peak early in their careers. Other professions such as geology and medicine are more dependent on acquiring a large database of facts in order to develop and logically analyze hypotheses. Unfortunately, by the time that one acquires a large accumulation of facts, the short-term memory starts to deteriorate. Strongly typed languages like FORTRAN are probably easier to de-bug than languages that are dynamically typed. At least that is my experience. Therefore, I’ll speculate that FORTRAN will continue to be preferred by senior scientists over the ‘modern’ languages.
1950s
You don’t have to create an entire compiler when you write for a new computer.
Compilers are made of multiple layers.
The first layer is the parser that validates that the code matches the syntax for the language. This layer also does things like remove comments and excess white space.
The second layer converts the output of the parser to a pseudo code.
The third layer converts the pseudo code to machine code.
When writing for a new processor, you only need to worry about the third layer.
With the complexity of modern hardware, multiple levels of caching, multiple data and op-code pipes, multiple processors, etc., it’s almost impossible for a human to write code that is efficient as what a good compiler can do.
And that third step is where the rubber meets the road. Making sure the machine code for that particular processor is generating the intended answer that the programmer expects from the high level language and it’s consistent with other implementations. Maybe state of the art has advanced enough to ensure that differences in machine design don’t affect the answer but I’m still skeptical.
Your last statement also brings up an additional issue on top of machine learning. What did the compiler actually do to implement my code? How would you know if you’re really getting the correct answer to as complicated an issue as climate? How do you validate?
The AI bit would assume that accurate data, in and out, would be used. Would they be allowed?
They only use the “AI bit” to impress the droogs to make it sound all ‘state-of-the-art’. Whatever it’s called generally it has little to do with the science.
Yes. They need crap climate models that can turn crap data and, based on crap assumptions churn out climate crap faster, and with more “precision”.
A fools errand. Avoiding parameterization, and getting Regional specificity requires much smaller grid cells. The most super duper computers are some 6-7 ORDERS of MAGNITUDE too slow thanks to tye CFL constraint on numerical solutions to,partial,differential equations. AI cannot fix the problem.
Regional models already exist – they are known as weather models. And they are only good for a few weeks projection at best. If your model can’t predict short term results then it is highly unlikely to be able to predict long term results. AI “learning” machines won’t fix this – they *can’t* fix this. No amount of “averaging”, “smoothing”, “homogenization”, or “parameterization” can fix it either!
My personal experience is that weather forecast accuracy varies significantly with location. They do pretty well in the two-season California regime. However, when I lived in New England 50 years ago, they seemed to be wrong more often than right.
Now I’m living in Ohio. Sunday, the Yahoo weather forecast was for overcast on Monday and mixed snow and rain on Tuesday (today). It snowed more on Monday than today, and it was a mix of precipitation. Weather forecasts (in my judgement) do a decent job of forecasting temperature. However, I suspect that the forecasts for precipitation have a high rate of false-positives, despite now having Doppler radar and geostationary weather satellites.
All “climate change” and AGW true believers were painstakingly schooled to believe that it is easier to produce accurate long term, “climate” projections than the short term weather projections we are used to from weather forecasters. It takes a fairly long and detailed rational to explain that to skeptics.
LOL. JPL trying to get a bigger serving from the climate model gravy train has Gavin nervous. That was HIS gravy train!
Weather balloons, we need more weather balloons not AI!
A properly thought-through sampling regime would be a start Al. Until somebody figures out how to sample the atmosphere for measurement of climate variability – especially spatial distribution – the quality and value of the data will be questionable.
And definitely more cowbell.
I am so sick of Gavin’s use of the word “robust”.
It simply means they consistently get the same systematic errors in the climate models because the current GCM are systematically wrong in their implementation.
Ptolemaic solar system models are still “robust” to this day in their predictions of Mars, Venus, Jupiter, Saturn, Mercury locations in the sky.
In mickey mann’s case, “robust” means that no matter what data you put in, you still get the same result.
GISS et al are much the same.
….. as are climate models.
“Robust” is how we refer to an active octogenarian with all his own hair … not science conjecture.
Published in the CHRISTIAN science monitor? Christian science?
Trying to form an alliance with a more modern religion.
There was a time when the CSM had a reputation for objectivity. Not so much anymore. They have a stated object to “injure no man, ..” I cancelled my subscription after they published a particularly ugly political cartoon defaming the NRA. If they can’t achieve their object, and fail to understand their failure, then I don’t trust them.
“They hope to corral the vast flow of data from sensors in space, on land, and in the ocean, and enlist “machine learning,” a kind of artificial intelligence, to bring their model alive and provide new insight into what many believe is the most pressing threat facing the planet.”
But, even with perfect data of what’s out there now won’t help build a better model.