JANUARY 16, 2021
By Paul Homewood
h/t MrGrimNasty
There has been a nice discussion on Twitter, regarding the GWPF’s latest bulletin inconveniently pointing out that there has been no global warming in the last 5 years:

But why does Richard Betts show a graph beginning in 1958, which implies that ocean warming suddenly started to accelerate after 1990? True, there is little reliable ocean heat content data prior to 1958, but some would argue that the data prior to ARGO buoys, rolled out in 2004, is also worthless.
Although the graph is labelled in Zettajoules, designed to make it look scary, the actual temperature changes involved are microscopic, and impossible to measure to such accuracy in pre-ARGO days.
Since 2004, for instance, ARGO data shows an increase of about one hundredth of a degree.

But we do have much longer records of sea surface temperatures, for instance the Hadley Centre’s HADSST3:

https://www.woodfortrees.org/plot/hadsst3gl
You will note a couple of things.
First, global sea temperatures actually fell between 1940 and 1980. (This coincided with sea level rise slowing down). Betts, of course, would like you to believe that the accelerating rate of rise since then is due to AGW, rather than a natural cyclical event.
Secondly, sea surface temperatures began rising from 1900, long before CO2 emissions could have had the slightest effect on the world’s climate.
Indeed the rate of rise from 1910 to 1940 was every bit as fast as since 1980. This also correlates with tidal gauge records of sea level rise around the world, which show a similar pattern.
Simple physics tell us that the oceans drive the world’s climate, and not the atmosphere. The heat capacity of the oceans is so much greater than the air, that the heat capacity of an atmospheric column of unit area cross section extending from the ocean surface to the outermost layers of the atmosphere is equivalent to the heat capacity of a column of seawater of 2.6-metre depth.
Put another way, rising ocean temperatures cause atmospheric temperatures to rise, and not vice versa. We can readily see that every time there is an El Nino.
So the real question is what has caused sea temperatures to steadily rise since 1900? And if you think it is greenhouse gases, then you need to explain how these also caused the pre 1940 rise.
The oceans temperatures principally rise due to the direct absorption of sun light. The only variable I can think of is cloud cover
Yes, cloud cover is the result of the vapor pressure of surface water. About 90% of sunlight striking the ocean surface goes into evaporating water and 10% into warming the water. The surface water mixing depth puts the planet on a 60 to 80 year SST cycle imposed on a 20,000 year Milankovich cycle, with occaisonal volcanic dust, smoke, and aerosol interference….note that the albedo of an additional sq.M. of cloud cover reflects hundreds of watts of incoming solar, while CO2 forcing is only a few watts.
SST variation with AMO on the following graph…
https://psl.noaa.gov/cgi-bin/gcos_wgsp/tsanalysis.pl?tstype1=91&tstype2=0&year1=&year2=&itypea=0&axistype=0&anom=0&plotstyle=0&climo1=&climo2=&y1=&y2=&y21=&y22=&length=&lag=&iall=0&iseas=0&mon1=0&mon2=11&Submit=Calculate+Results
And if you research the “8.2 Kyr event”, you can see a 3500 year Tempdrop in that as well, which is probably long term SST trend related.
and posting something I commented on another thread:
One degree of warming over the ocean causes 7% more water vapor…causes 3.5% more clouds on about a 5000 km surface scale, assuming a simple parcels up=parcels down relationship….the albedo of one sq.m. of additional cloud reflects hundreds of watts of incoming sunlight compared minuscule CO2 IR forcing of a couple of watts. So effect of radiative but non-condensing CO2 is relatively close to nil. CLOUDS control the planet’s temperature, not CO2.
And the amount of cloud cover depends on scales of 5 to 5000 km on the amount of water vapor in the atmosphere….which as a function of SST looks like the following.
And CCN availability.
JF
What CO2 “forcing” ?
The only way you can even measure CO2 radiation, (which has a mean path length measured in 10’s of meters), is to create a negative temperature gradient using a heavily cooled sensor.
No warming effect what so ever.
A modern IR camera can detect it. Admittedly small. A couple tenths of a percent of this guys maybe 80 watt candle flame isn’t going to warm his CO2 tube much. And if it did, the heat would convect into the air and eventually radiate into outer space, just like the real world outside the lab…..
https://m.youtube.com/watch?v=kGaV3PiobYk
Sorry, but in that video the IR camera is not detecting any emissions from CO2.
also…..
As you de-compress a gas it will always absorb energy
CO2 absorbed IR visible to the camera…the CO2 downstream of the valve might have been cold enough to absorb a lot in the 15 micron band even…
Yes, it recorded absorption by a stream of de-compressing gas… not emissions of any sort..
…so then you are saying the candle wasn’t emitting any heat for the camera to detect…hmmmm….
Your lack of understanding is astounding !
A bigger variable may be how this temperature is measured. Approximately 8 years or so ago I heard an ugly story about how temperature data taken by US Navy ships at sea changed the way they recorded ocean temperature. This change caused temperatures to rise artificially due to bilge water (heated by turbulence) mixed with natural sea water. This unnatural increase in the temperature data was not adequately accounted for and this fact was covered up. But then this result is not much different from the resulting behaviors of other US Government agencies responsible for temperature data.
Admittedly been a few years since I was in the USN but we never, ever took bilge temperatures. Not only that we only discharged the bilge when water level got high enough which was only a couple times a day and took ~1/2 hour. Unless there’s a seawater inlet for cooling near the bilge water discharge there’s no mixing. Also, a cooling inlet will be in the 12″-48″ diameter range while bilge discharge is 3-4″ diameter. With mixing the rise in temperature likely isn’t even detectable.
I can give you a list of why historical naval temperature readings can be a poor selection of readings but discharging bilge water leading to contaminating readings isn’t on the list.
I agree that it’s all about sunlight, my simple but unscientific observation from last summer shows this, sorry for repeating myself.
I have a cabin on a lake in SW Saskatchewan.
Ice comes off beginning of May, 2020 was a long cool spring and summer, was awful until the last week of July, barely breached 20c all that time and yet the lake temp rose from just above zero to ~23c.
The system then flipped and until Labor Day weekend it was agreed to be the nicest august in years, lots of sun, temps above 30c, had to run the AC most days.
And yet on Labor Day weekend taking out the docks the lake temp had fallen to ~17c
So hotter air for weeks didn’t prevent the lake from cooling as the sun angle decreased.
Simple, but shows the atmosphere does not heat water
Most people won’t understand about the desert-like climate of southwest Saskatchewan. link
Never mind the daily high temperatures, that’s a distraction. If the lake were to be heating according to the atmosphere, it would follow the daily mean temperature which is quite a bit different than the daily maximum.
Your lake heated to around 10 deg. F higher than the July/August daily mean. So, you can think of the atmosphere as a comfy warm blanket covering the lake if you like but the necessary heat came entirely from the sun.
I agree
My point was the lake warmed as the sun angle in the sky increased even though air temps were cool, then the lake cooled even tho the atmosphere was much hotter, because the angle of the sun decreasing.
We had the furnace kick in a few nights in early July (18c setting), but late July thru end august the AC was running so we could sleep at night.
Hotter atmosphere, lake cooling
Lake is 1x6km, maybe 35’ deepest point
The atmosphere does not heat the water but the IR active gases, mostly water vapor, slow its cooling.
They can only do that by altering the lapse rate.
H2O can
CO2 does not.
Except the point was the lake cooled just as fast no matter the air temperature.
I have been saying since the begining that the atmosphere would have to warm a lot and stay warm to have any affect on ocean temps. If the oceans are warming first then no greenhouse affect.
Cloudless nights cool faster and farther when water vapor content of the atmosphere is lower. This simple observation demonstrates that WV is IR active, thermalization takes place and that the misleadingly named Greenhouse Effect exists.
Mike McHenry:
“The only variable I can think of is cloud cover”
THE variable is the amount of dimming SO2 aerosols in the atmosphere. Decrease them, and it warms up. Increase them and it cools down. ..
Solar TSI 30 year trailing average .(ie… “climate” period of time) 😉
Since an average is just a sum divided by “n”
….. you can think of the shape of the graph as being a daily ACCUMULATION of solar energy over 30 year periods..
And albedo.
JF
And albedo. An oil/lipid/surfactant smoothed surface resists ruffling and has lower albedo that clean water.
JF
Whatever the WV increase which results from temperature increase, human activity adds more. One of the mistakes in the GCMs is that they do not account for the water vapor added by human activity. https://drive.google.com/file/d/1FCTMAm8fBJQT8Cc-VTbXXIykEXJsTSO7/view?usp=sharing .
About 7 molecules of WV have been added for each CO2 molecule. The added WV from human activity (about 90 % from increased irrigation) explains all of the increase in average planet temperature due to human activity.
The temperature increase is self-limiting because increasing WV will result in more clouds and a lower average cloud altitude which will limit the temperature increase. Average global temperature is very sensitive to cloud changes http://lowaltitudeclouds.blogspot.com
The increased WV will slow and possibly prevent an otherwise expected life-threatening planet wide cooling. Burning fossil fuels does not have and never will have a significant effect on climate but the increased CO2 enhances food production (plant growth)
If humans add water vapour, won’t the increased humidity will decrease evaporation?
Most of the WV added by human activity is from irrigation at locations where WV content of the atmosphere is very low. As a consequence, there is plenty of ‘head room’ to add WV. Of course, one of the factors in evaporation rate is the difference between the vapor pressure and the partial pressure of the gas in the atmosphere. In the desert, in shallow water, under full sun, there is a big difference.
I would think that surface winds also play a part on a smaller scale.
NOT correct Mike. When you delve into the behaviour of water during the evaporation phase of water you will understand why this is not the case. A one sentence explanation lies in the conversion by water of radioactive energy into Latent Heat AT CONSTANT TEMPERATURE which is driven by buoyancy up through the clouds for dissipation and into space.
Try boiling a pan of water with a blowtorch on the surface and you may get my drift.
I think you need to look for other explanations.
Ummmm….. underwater volcanism, black smokers increasing in numbers, increased heat at previously unknown locations, e.g., the edge of the Juan de Fuca plate boundary a few years ago….
But when the term “warming” is involved, just what is meant by using it? If it is 0.001 degree F, is it really all that noticeable, or is that just a front for begging letters for grants?
Just askin’…. because we finally got snow here in m kingdom, and the birds are still ignoring my offerings of food and more food.
Sara, your comment about “underwater volcanism, black smokers…” is analogous to heating the bathwater with a gas flame under a tank of cold water rather than directing your hairdryer on top of a bathtub of cold water (sorry about my sexist tendencies). This escaping heat does not get the respect it deserves. However, I still am going to equatorial regions for vacations because the sun is my friend.
You only have to look at pools with temperatures of 50ºC+ on the Eastern shores of Greenland, to know that there is significant warming coming from these underwater volcanic regions.
Ocean seismic activity lagged two years, tracks UAH way better than CO2 does.
But that’s the point, Ron: where IS the heat coming from? It ain’t coming from you or me, and the reality of it is that the ocean in its deepest depths is really quite cold.
Deep oceans are not heated by geothermal, the temperature gradient goes the wrong way.
There has to be some warming of the oceans around areas of ocean volcanic activity which occurs along plate boundaries etc.
But in relative terms, its a small flame under a VERY large bathtub !!
What a silly argument. The rate of heating could be orders of magnitude less than the rate of cold water sinking.
I’m not necessarily claiming thermal heating. As far as I’m concerned we don’t know if heating, cooling, or in equilibrium, (on human time scales.)
So it doesn’t cause any warming.. OK ! 🙂
Can you show the deep ocean currents somehow warm as they pass over the ocean bottom….
…then you would have a case.
??
The coldest water is already at the bottom.
And if this “cold water” sinks, where does the displaced water go to ?
fred
Your map only shows surface volcanoes. What is missing from your map are underwater volcanoes, and more importantly, the mid-ocean spreading centers where hot rock comes up from the mantle. We know that the Black Smoker fields that have been investigated have very hot water coming out. Yet, because it mixes with very cold water, it quickly becomes tolerable to organisms. The question is, how much colder would the bottom waters be if it weren’t for the hydrothermal heat?
I’d love to see a chart of underwater volcanoes hot vents as well
Same regions + a few extras.
If you have map, that would be great. 🙂
I have seen maps, such as by National Geographic, that depict the mid-ocean ridges. I have also seen maps that show the general location of some Black Smoker fields. We know so little about the deep ocean that I suspect we only know about a small fraction of the Black Smokers.
There is this map of currently active volcanoes from Volcano Discovery.
https://www.volcanodiscovery.com/volcanoes.html
There is plenty of deep sea activity that hasn’t yet been recorded, or is ignored by the CAGWer peeps, because it just does not suit their meme.
Erebus, down in Antarctica, sits on a rift zone and is part of a field of volcanic activity down there. It is on the plate boundary that goes south from Africa. There is an active volcano-building episode going on off the coast of Tenerife in the Canary Islands. That’s been underway for several years, and right now, it’s kind of quiet.
It’s all connected, you see, and therefore, it is not just ONE thing that causes subsurface ocean water to heat up. There are many factors involved, including the fields of black smokers.
The point is that if you limit the cause to just one thing, you will miss all the other contributing factors. That is the flaw in the way Those Other People work: they follow only ONE path. It leaves no room for other possibilities. Big Mistake. Big Huge Mistake.
Don’t be Those Other People!
Sara, That’s basically what I posted above.
Yes, sorry about that. I jumped the fence on that one.
In 2019 there was a large seismic hum heard around the world. Eventually they discovered that it was the largest undersea eruption ever recorded. Within 6 months, the eruption created a mountain almost 1km high and 5km wide. Had this eruption occurred on land it would have been called a supervolcano and would have changed the climate for years. And these things probably go off pretty regularly, it’s just that we never noticed before because seismic monitoring equipment wasn’t sensitive enough (or even looking for it).
https://www.sciencemag.org/news/2019/05/ship-spies-largest-underwater-eruption-ever
https://www.livescience.com/65545-largest-underwater-volcano-seismic-hum.html
30 years ago, scientists thought there was only a few undersea volcanoes and hydrothermal vents. 10 years later it was in the hundreds. 10 years later in the thousands. And now it’s in the MILLIONS.
The heating from all of this may not be significant, but it seems crazy to think that it is not heating the oceans to some extent.
I do not disagree with your opening sentence or your summation, but…
That map strictly shows volcano locations, known and surmised while reducing tectonic rift, collision and subduction zones to single dots…
e.g. Antarctica’s “Ring of Fire” volcanism area is extensive. What is physically shown on the above map is a few small dots.
e.g. 2; The Atlantic’s rift zone running through Iceland and literally eventually to Antarctica is not identified.
Still, as you summarize, considering the volume of the oceans, “its a small flame under a VERY large bathtub !!”
That is true, even if every magma emplacement, magma chamber, magma pipe, geyser, smoker, rift, hot spring outflow and volcano is fully identified and imaged.
Alarmists frequently ignore that all of the above volcanism geology emits immense amounts of CO₂ continually. Including hot springs far from recognized volcanic locations; e.g. hot springs in West Virginia, Arkansas, etc.
You have found the earth paradoxes. (One of two comments)
This is interesting. In the last 10 years, Geology has found via observations/analysis that the geological ‘forces’…
… the ‘force’, that make the tectonic plates move apart and cause the geomagnetic field are changing in real time.
In the last 10 years it has been discovered that the geomagnetic field abrupt changes correlating with climate change.
And that the geomagnetic field changes are very fast and very frequent. And there is a factor of 3 to 4 increase in the strength of the geomagnetic during the interglacial period.
And the very large, geomagnetic excursions when there are massive large long term drops in the earth temperature. An example is the Younger Dryas abrupt cooling period, 13,900 years ago when the North hemisphere went from interglacial warm to glacial cold with 70% of the cooling occuring in a decade and the cooling lasting for 1200 years.
Another example, is the mystery as to why the earth’s core can crystallized. The liquid part of the core is 1000C too warm to crystallize. If the earth’s core was 1000 degrees colder it would all crystallize. Somehow something is causing the earth’s core to start crystallizing about 1 billion years ago.
Challenging core belief: Have we misunderstood how Earth’s solid center formed?
Scientists question long-held understanding in new paper
https://www.sciencedaily.com/releases/2018/02/180207151842.htm
Summary:
Researchers are posing an important question about the formation of planet Earth’s inner core, arguing that it’s time to consider the nucleation paradox at the heart of the issue.
It is widely accepted that the Earth’s inner core formed about a billion years ago when a solid, super-hot iron nugget spontaneously began to crystallize inside a 4,200-mile-wide ball of liquid metal at the planet’s center.
There is also a mystery as to where the water came from that covers the 70% of the surface of the earth.
Based on analysis, geology believes the earth’s core started to crystallize a billion years ago.
And a mystery as to why deep oceans suddenly appeared on the earth 570 million years ago.
What happened on 570 million years ago for the earth ….
To produce the ‘first’ deep oceans on the earth?
There is an old unsolved paradox to explain Cambrian Explosion of advance life, 570 million years ago.
https://www.sciencedaily.com/releases/2018/12/181212134354.htm
Why deep oceans gave life to the first big, complex organisms
Why did the first big, complex organisms spring to life in deep, dark oceans where food was scarce? A new study finds great depths provided a stable, life-sustaining refuge from wild temperature swings in the shallows.
They are connected. (One of two comments.)
All over the planet starting in 1994, there was suddenly a 300% increase in the frequency of earthquakes of magnitude 4 to 6 all along the ridges where the sea floor is being pushed apart.
The mid-ocean ridges are thousands of miles long. At these very long regions, the ocean ridge is pushed apart in two directions. At ridges where there is sufficient force (Pacific ocean) to move the ocean plates apart fast, there is constant magma coming up at the ridge.
This increase in the frequency of mid ocean earthquakes, physically absolutely must have a cause and the only physically possible cause is there must be a physical system in the earth that suddenly can cause unbelievably massive ocean ridges to be pushed apart.
So, what we have ‘discovered’ (this is an observational discovery not a theory): There is mysterious unknown ‘force’ that Geology has not found that is moving the ocean plates and …
This is the logical implications of the observations, kicker. This mysterious force that moves the ocean plates can increase by a 300%. The mysterious force is changing in real time.
Curiously and unbelievably, It is a fact that Geology does not have an explanation as to what ‘moves’ the massive ocean plates and what moves the massive continental plates.
“As detailed in those studies, increasing seismic activity in these submarine volcanic complexes is a proxy indicator of heightened underwater geothermal flux, a forcing mechanism that destabilizes the overlying water column. This forcing accelerates the thermohaline circulation while enhancing thermobaric convection [3-6]. This, in turn, results in increased heat transport into the Arctic (i.e., the “Arctic Amplification”), a prominent feature of earth’s recent warming [7-9].”
https://www.omicsonline.org/open-access/have-global-temperatures-reached-a-tipping-point-2573-458X-1000149.pdf
Geology discovery of hundreds of thousand of tubes in the mantel that go down to the core of the planet and then connect in a complex latic below the crust.
Have you heard the geological term Kimberlite tube? Kimberlite is a town in South Africa that is near a tube in the ground that is full of diamonds.
Few people, know diamonds come from about 60 km below the earth and some force pushes a tube of material at about 60 km/hr to push 60 km of tube material out on the surface of the planet leaving a tube with diamonds in it. And an explosive release of CH4 gas and material.
Yes, I do know what a Kimberlite tube is, and am constantly amazed that carbon can be manipulated into a crystalline form that has more value than coal. And how much of that kind of thing went on in North America, which is indicated by jewel hunters who hope to find “some valuable thing” pay for the privilege of digging in dirt, and have occasionally found a real diamond. It’s like my grandfather panning for gold up in the Yukon and pulling enough gold out of the creek where he worked the creek bed to put himself through law school when he got back to Wisconsin. (I have his journal and photos.)
Where Erta Ale sits in the Danakil Depression, the earth is so thin that it is eroding from underneath, and Erta Ale (Mouth of Hell) is in the middle of a rift zone that starts up north of the Black Sea and goes all the way south through Turkey (look up how much the Haija Sofia is being split apart), down into the Danakil, and on south to Kilimanjaro (and other volcanoes) and further south, ad finis. Some day, the Antarctic will split (not in our lifetimes) and everything will change.
Whatever the “engine” is that drives all of this activity, we have no power over it, so we need to be aware of it and respect it, and not make the false assumptions that we can control it…. because we can’t.
I think the recent rise in ocean temperature is from solar heating in the medieval warm period about 900 years ago. Oceanic circulation can certainly take that long and the charts of CO2 aginst atmospheric temp show that sort of lag time.
Sophist claims regarding slow oceanic current patterns utterly fail to identify or explain how MWP oceanic warming is released centuries later.
Warm water rises.
Warm water radiates warmth into the atmosphere.
Warm water rapidly cools due to evaporation.
Warm water quickly exchanges warmth with adjacent colder water.
All of which means that submerged warm water will rapidly equalize temperatures with surrounding water. That few joules of warming is inconsequential when shared with vastly larger colder volumes of water.
In spite of alarmists claiming warmed oceanic surface water’s “heat” is driven deep into the ocean; their concepts of what is “warm” is bizarre. Their mechanism of how warm water is forced deep into the ocean and warming a future atmosphere is far more bizarre.
These same alarmists show their oceanic temperature graphs as joules to disguise how miniscule that warming actually is. Warming that ignores instrumental error ranges much larger than the alleged warming.
Complicating those instrument error ranges are the fact that NASA/NOAA do not test, certify or recertify their equipment at deployment. Instead they use the manufacturer’s ratings for laboratory installed and certified equipment, not equipment covered with oceanic growths.
With all of this claimed warming, we are certainly having a rather cold winter here in central Florida which, in case you haven’t noticed, is pretty well surrounded by ocean.
Having studied this matter for a good 14 years, listened to both sides of the issue, checked references, I’ll stick with S. Fred Singer and “Unstoppable Global Warming Every 1,500 Years.” (Aided and abetted by William J. Burroughs and “Climate Change in Prehistory” plus excerpts from many other scientific and historical sources.)
Dicking around with hundredths of a degree during the now declining AMO will get them in trouble with their Zetajoules trick.
Looks to me like AMO might not get serious about declining for another 5 years or so.
Agreed….. Will be fun watching the alarmist apologists when it does, though 🙂
Thanks, Dan. I should have said ‘peaking.’
Any graph that shows an arbitrarily selected “zero” point on the y-axis should arouse suspicion. So the oceans gained 350 zettajoules since 1958. Is this an increase of 10%? 1%? 0.00000001%? There is no way to tell without context, and this graph intentionally obfuscates that context.
Betts clearly has resorted to telling half-truths to support the climate scam.
That is because he is placing all his betts on CO2 as the culprit.
A half truth is a whole lie.
Old Yiddish saying
Betts always has.
Like other members of the early alarmist collusion, Betts has spun far away from reality.
Now, Betts is unable to defend global warming without starting with falsehoods and fabrications.
Yes. The actual ocean heat content includes the energy required to raise the entire ocean temperature from 0 K (absolute zero) to its actual temperature. That’s about 5 orders of magnitude greater than zettajoules. If plotted on a properly scaled graph, Betts’ data would be a flat line.
Of course no one has the ability to actually measure the average ocean temperature to a precision of +/- 1 K to begin with, much less +/- 0.001 K. You can’t even measure the average temperature of a bucket of water in the laboratory to +/- 0.001 K.
AD proxy data shows just how INSIGNIFICANT the current OCH rise really is.
And its NOTHING to do with human CO2. (Red comment is /sarc)
Two items to keep in mind:
IPCC AR4 Page 387
The oceans are warming. Over the period 1961 to 2003, global ocean temperature has risen by 0.10°C from the surface to a depth of 700 m
Correcting Ocean Cooling
Smoothing the Bumps
In mid-2008, however, a team of scientists led by Catia Domingues and John Church from Australia’s CSIRO, and Peter Gleckler, from Lawrence Livermore National Laboratory in California, revised long-term estimates of ocean warming based on the corrected XBT data. Since the revision, says Willis, the bumps in the graph have largely disappeared, which means the observations and the models are in much better agreement. “That makes everyone happier,” Willis says
We are supposed to believe that they can measure the world wide temperature of the ocean 700 meters deep accurate to 0.01° for the previous 42 years.
And it’s so nice to know that the actual data was changed so that the observations and models now agree making making all the climate scientists happy.
Climatology has been altering the temperature data for so long now they just take it as a normal part of business. No other science discipline does these things that climate data curators do with infillings and “homogenizations” and still think the data means anything regarding the science and nature of what they are trying to understand. The biases are strong in the field, the “carrots” for doing so great (careers, paychecks, tenure, grants) , and the “sticks” they would get if they didn’t are severe to the pocketbook. That’s why most of the climate skeptics calling out the scam are emeritus professors and retried scientists whose paychecks can no longer be threatened by the The Hockey Team quarterbacking The Cause.
“Climatology has been altering the temperature data for so long…”
Compensation Corollary. An experiment may be considered successful if no more than half of the data must be discarded to obtain correspondence with your theory.
(From “Wisdom of the Giants of Science” via “The Official Laws” – Paul Dickson)
Thanks for reminding me, NASA’s GISTEMP updated their Land Ocean Temperature Index (LOTI) a day or so ago to include December of 2020. LOTI has monthly data back to January 1880, so that’s 1680 monthly entries of which on average they change over 300 every month. Here’s the changes made through out 2020:
Jan Feb Mar Apr May Jun Jul Aug Sep Oct Nov Dec
319 240 313 340 298 404 319 370 303 389 381 370
This goes on month by month, year by year and follows a regular pattern of cooling the past and warming recent temperatures. Here’s what that looks like compared to GISTEMP’s 2005 data:
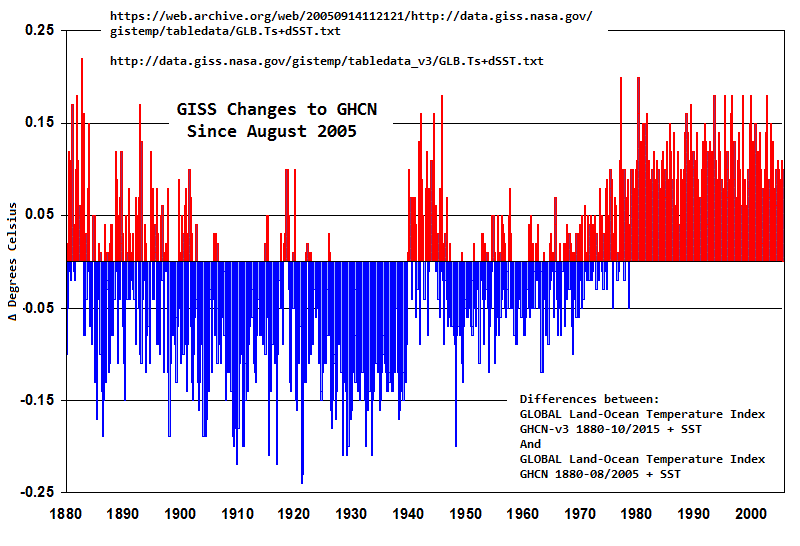
These charts show to me that only thermometers in service in 1970 or so are accurate. In order to produce accurate results, those thermometers in service before then must have their readings reduced and those in service after must have their readings increased. The key then to good climate science is finding the circa 1970 thermometers and then use only them.
Glad to be of help.
DHR,
The only thing I know for sure is just dump the URL into the post message dialog box, using the little [icon] in the box down in the right hand corner is crap.
Shouldn’t there be some sort of criminal statute involved with that?
I mean, can I go back and adjust all the financial records of my personal corp like this?
Would the CRA come visit me and offer a trip to jail?
What do I look like, a lawyer?
If you dry lab, pencil whip, fudge, or gun deck the data, it’s OK if you’re a climate scientist or a Democrat. All others must be willing to do the time if they do the crime.
So what you’re showing us, Steve, is that these people are having hissy fits over a quarter of a degree, or even less, change in the average temps.
Is that correct?
I wish I could grab The Doctor’s TARDIS and drag these people back to the Wisconsin ice period. Just drop them off there for a few days and find out what they do in really rough weather.
What? I can dream, can’t I?
If you Google the HADCRUT temperature data which goes all the way back to 1850 instead of the 1880 start date NOAA and NASA use, you will see that temperature peaked in 1878 dropped to a low in 1912 and peaked again about 1945 and then a new low in 1975 and back up to where we are now for a grand total of ups and downs amounting to about a degree warmer than it was in 1850. So it’s a hissy fit over a degree of warming in 170 years.
That low in 1975 is the Global Cooling scare that the liberals say never happened.
Thanks. I think there is a parallell somewhere in here to the whipsaw weather systems that give us bitter cold winters followed by beastly hot summers, and mild winters followed by mild, pleasant summers.
You know a derecho is a straight-line wind that has as much force as a tornado. (Check the damage done in Chicago and some suburbs last summer 2020 by a derecho.) Now, why, when it has the same strength as a tornado, does the air stream form a straight line pattern instead of the erratic twisting that turns it into a tornado?
That should be looked into. Is it air pressure, temperatures, humidity, or is it just a quirk in wind flow? And like a tornado, it comes out of nowhere, no forecast available because it’s just wind, but WHY doesn’t it become a vortex?
Why do we get snow tornadoes in the middle of a heavy snow that is almost – not quite – a blizzard? And lightning, thunder, and all the trimmings, too?
If it’s got to do with temperature, what’s the number/volume of tornadoes in one year compared to another year? If there’s a pattern there, it’s worth investigating, isn’t it?
Courtesy of NWS:Derecho
You are not incorrect, but there is more.
Not quite.
These people are having hissy fits over data they should not average, but do average.
Ignoring individual sites’:
Besides the issue that averaging poorly located/gridded local temperatures into a global average is irrational.
What is amazing besides NOAA’s continual adjustments to individual temperature station data is that despite NOAA’s insistence that CO₂ is a temperature control knob, NOAA does not measure CO₂ at the temperature stations.
As well as using temperatures from up to 1,200 kilometers away, to compare, verify and adjust temperatures warmer, always warmer.
It’s one of their favorite methods for isolated temperature stations, like in Antarctica, Arctic, interior Africa, interior Russia, interior Australia, etc. etc.
the data you posted of the sea temperature were tampered with to disappear with the abrupt cooling of the middle of 1940. below is the link to the old sea temperature chart:https://woodfortrees.org/graph/hadsst2gl/from:1840
If you were to ask metrologists (yes metrologists people who study measurement) if it was possible to provide the temperature of a swimming pool with a precision of one thousandth of a degree, they would laugh at you. Claiming as the graphic in this article does that it was possible to measure worldwide ocean temperature to one thousandth of a degree is, bluntly, a falsehood and an invention.
The error would be in the region of +/- 5C and probably more, until satellite measurement became possible but satellites only use a proxy for surface temperatures. Yes the Argo floats are useful but they are thousands of miles apart when a few hundred meters (in any direction) can take each float from a warm to a cold current. For a really good explanation see Bob Tisdale here:
https://bobtisdale.wordpress.com/2013/03/11/is-ocean-heat-content-data-all-its-stacked-up-to-be/
Even surface air temperatures in the Southern Hemisphere before around 1945 are invented apart from Australia and perhaps South Africa. It doesn’t help anyone to invent data then claim that the invention is accurate to a thousandth of a degree.
Ian
There are two components to the measurement of water temperatures of the oceans. The first, obvious, but limited by technology, is how precisely and accurately the temperature can be measured before it changes. The second consideration is the sampling protocol. How can one be certain that the same water is being measured every time when there are currents moving the water laterally, and mixing changing the vertical distribution of temperature?
The crux of the problem is that there are two uncertainties that contribute to the overall uncertainty of even Argo measurements. The first uncertainty is the sensitivity and calibration of the ‘thermometer.’ The second one, which is almost certainly much larger, is the variation with time even for the exact same place. The two uncertainties combine. I suspect that the only way they can report measurements to a precision of greater than 0.1 deg C is by inappropriately rationalizing the use of the Law of Large Numbers and claiming that they are justified in dividing the mean by the square-root of the number of measurements.
There is an obvious conflict in what is reported because the Empirical Law allows one to estimate the standard deviation based on the range of temperatures. If the reported standard deviation (which is used to report the uncertainty) doesn’t agree closely with the estimate from the Empirical Law, then that is prima facie evidence that they have calculated the standard deviation, and precision of the mean, improperly!
I have previously demonstrated that the air temperature precision reported doesn’t reconcile with the the estimate from the Empirical Law.
https://wattsupwiththat.com/2017/04/23/the-meaning-and-utility-of-averages-as-it-applies-to-climate/
“ have previously demonstrated that the air temperature precision reported doesn’t reconcile with the the estimate from the Empirical Law.”
No, you didn’t. Nick stokes patiently pointed this out in the very article you linked. Do you still cling to only conveniently selective applications of the Central Limit Theorem?
“there is no justification for reporting either current global temperatures or anomalies to three or even two significant figures to the right of the decimal point”
That’s wrong. The global mean is not the temperature of a point. It is a calculated result, and has a precision determined by the statistics of sampling. An example is political polling. The data is often binary, 0 or 1. But the mean of 1000 is correctly quoted to 2 sig fig.”
big,
“It is a calculated result, and has a precision determined by the statistics of sampling.”
Nope. Temperature measurements come with an uncertainty. That uncertainty *has* to be propagated through any calculation. That uncertainty GROWS as you try to combine independent, one-time, temperature measurements. The precision is determined by the uncertainty. The stated value should not have any more precision than the uncertainty. If the uncertainty has the units digit as the most significant digit then the stated value should have no more significant digits than the units digit.
Polling is a counting process. It’s a totally different animal than temperature measurements. Uncertainty in a count typically is quoted as the square root of the total count. So if you survey 1000 people with a binary choice and get 300 zero’s and 700 one’s then the uncertainty would be sqrt(300) and sqrt(700), +/- 17 and +/- 26 respectively. Counts in an interval can change in successive intervals, e.g. number of decays in a radioactive sample over the first 10 second interval and the second ten second interval. So the actual counts in any specific interval will always have an uncertainty associated with it. (check out Poisson distribution)
Clyde,
I just read your 2017 editorial. HOORAH! Every climate scientists should be forced to read your editorial and write an essay on uncertainty using it as the base document!
This comment is spot on. Only in Climate “Science” does one see air and ocean temperatures recorded to 0.001 deg C, which is utter nonsense in a meteorological context. I can only conclude that the practitioners of said “Science” are computer jockeys with no training in physical sciences or engineering.
Note the similarities between North American grain belt cold summer temperatures and poor crop yields in 1974, towards the end of the ~37-year global cooling period and again in 2019.
Published by Time Magazine in 1974, towards the end of the naturally-caused global cooling trend from ~1940 to 1977.
ANOTHER ICE AGE?
Monday, June 24, 1974 Follow @TIME
http://content.time.com/time/subscriber/article/0,33009,944914,00.html
[excerpt]
In Africa, drought continues for the sixth consecutive year, adding terribly to the toll of famine victims. During 1972 record rains in parts of the U.S., Pakistan and Japan caused some of the worst flooding in centuries. In Canada’s wheat belt, a particularly chilly and rainy spring has delayed planting and may well bring a disappointingly small harvest. Rainy Britain, on the other hand, has suffered from uncharacteristic dry spells the past few springs. A series of unusually cold winters has gripped the American Far West, while New England and northern Europe have recently experienced the mildest winters within anyone’s recollection.
As they review the bizarre and unpredictable weather pattern of the past several years, a growing number of scientists are beginning to suspect that many seemingly contradictory meteorological fluctuations are actually part of a global climatic upheaval. However widely the weather varies from place to place and time to time, when meteorologists take an average of temperatures around the globe they find that the atmosphere has been growing gradually cooler for the past three decades. The trend shows no indication of reversing. Climatological Cassandras are becoming increasingly apprehensive, for the weather aberrations they are studying may be the harbinger of another ice age.
_________________________________
Published in 2019:
THE REAL CLIMATE CRISIS IS NOT GLOBAL WARMING, IT IS COOLING, AND IT MAY HAVE ALREADY STARTED
By Allan M.R. MacRae and Joseph D’Aleo, October 27, 2019
https://wattsupwiththat.com/2019/10/27/the-real-climate-crisis-is-not-global-warming-it-is-cooling-and-it-may-have-already-started/
[excerpt]
It is notable that planting of crops has occurred one month later-than-usual in North-central growing areas of North America in both 2018 and 2019. In 2019, there were many more record U.S. all-time daily low temperatures than record highs for the last 30 days, 365 days and year-to-date. These events may just be weather, not climate, or they could be the early indicators of global cooling.
…
The North-central 2019 harvest was hit hard by wet, cold weather. Meteorologist Joe D’Aleo explains:
The growing season in North America has been especially challenging.
Crop Challenges 2019
· Greatly delayed or aborted planting
° 19 million acres did not get planted.
° Late cold, snow, rain and flooded fields.
· Shallow roots caused by excess rain
· Soil Compaction
· Mid to late summer dryness and heat to the South and East.
· North-central growing areas saw excessive rainfall AND not enough sun or Growing Degree Days
· Early snows in Northwest growing areas
· Half the corn and soybean crop was not mature enough to harvest until mid-October
· The soybeans and corn still in the field are delaying the planting of winter wheat
Allan, not being a smarty pants, but the key to it all is excess wet stuff: rain, snow, flooding, etc.
Seeds tend to rot when the ground is too wet, but you know that anyway. 🙂
Hi Sara and Happy New Year!
Joe D’Aleo is the expert on crops. He and his colleagues at Weatherbell consult to the agricultural and energy industries and provide the best detailed forecasts. As I recall from our conversations:
Across the Great Plains the Spring was very wet and cold, such that the ground was too soft in some areas and planting equipment could not traffic on the land without bogging down. 19 million acres did not get planted.
As you stated, excessively wet ground caused seeds to rot.
The summer was cold with inadequate growing degree days so the crop took a long time to ripen – harvesting was delayed until October in many areas.
Early snows damaged the unharvested crops and excess moisture caused more damage.
Crops in the far South and East were better and there was adequate grain in storage, so prices were not greatly affected.
Best, Allan
Joe Bastardi, Joe D’Aleo’s partner at Weatherbell, recently sent me a copy of his latest book, which can be purchased here. I highly recommend it. http://phonyclimatewar.com/
This book by a recognized expert in Meteorology is an easy read – it demolishes the false global warming / climate change scare and recognizes that the advocates of this false crisis are driven by their covert political objectives.
Joe states the same points that I’ve made for decades, but he says it much better. [smiley-face]
The Weaponization of Weather in the Phony Climate War – by Joe Bastardi
The new book by one of the World’s most experienced forecasters on climate & weather.
Factual tour de force of Past Weather Revealing what is Being Covered up, and the reasons behind it!
About The Book
What if climate change is naturally occurring and cyclical? What if trillions of dollars will be spent to accomplish nothing? What if the real agenda is not about science, climate and weather, but simply uses this as a tool to disrupt and destroy the foundational concepts of one nation, under God, that have led to the greatest quality of life and liberty the world has ever known?
At 65, Joe Bastardi is one of the most experienced meteorologists in the world today. His knowledge of past major events puts in perspective the extreme weather events seen today, that are nothing new, and in fact, not as severe as before. In this book, Bastardi goes in-depth to document naturally occurring climate and weather events to question those whose agenda it is to weaponize each weather event for the pursuit of a political and social aim.
Of course, the climate is changing, and with the many natural influencers constantly in play, it always will. Thanks to an ever-fluctuating level of activity in the large natural drivers that have always controlled it, such as our Sun, the oceans, stochastic events and the very design of the system itself, climate change is natural. “A single attribution to man as the climate control knob in the face of this is questionable, if not a stretch. The reader should at least look at the ideas presented here,” said Bastardi.
Joe understands the fear today, given what has been nothing short of public indoctrination. His new book offers an environmentally friendly and inexpensive solution to alleviate those fears, that will not destroy the economic lifeline of this nation as the Green New Deal surely will. It begins with removing the fear that has been pushed to create what is becoming irrational panic, especially with our young.
Ummm, Allan, the cover alone will get me to buy it. 🙂
That noise you heard was me, falling off my chair in a huge giggle.
I love it!!! And I will put it next to my copy of “The Medieval Warm Period”.
Consider adding
To your reading list.
Books by Dr. Roy Spencer and Donna LaFramboise are worth considering.
Roy’s books are generally solidly educational.
Donna’s are detailed incisive investigative facts.
Thanks for the link Allan. Book ordered . . .
Great to hear from you Dan.
Best wishes to you and yours for the New Year!
I really enjoy working with highly competent professionals like veteran meteorologists Joe D’Aleo and Joe Bastardi at Weatherbell.
Here is a story that describes how very good they are:
https://wattsupwiththat.com/2017/01/13/new-butt-covering-end-of-snow-prediction/#comment-1954298
A little recent history about Winter weather forecasts:
The National Weather Service (NWS) of the USA forecast a warm winter for 2014-15 and my friend Joe d’Aleo told me in October 2014 that the NWS forecast was seriously incorrect, and that the next winter would be particularly cold and snowy, especially in the populous Northeast. This was the second consecutive year that the NWS has made a very poor (excessively warm) Winter forecast, in Joe’s opinion – and he and his colleagues at WeatherBell have a great track record of accurate forecasts.
Joe and I had been working together on a paper on Excess Winter Mortality, and I suggested to Joe that this false “warm winter” NWS forecast was dangerous, especially if the country and its people were unprepared. Joe agreed, but did not know how to tackle the problem.
I proposed an approach, and we prepared a presentation for my friend at the US Energy Information Administration (EIA). Joe then prepared his own monthly Winter Forecast by region for the EIA, who re-ran their winter energy demand calculations. Using Joe’s forecast, the EIA projected 11% more winter energy required for the USA than the “warm” NWS forecast had projected.
After that brutally cold and snowy winter, a back-analysis showed that the actual energy used was 10% more than the NWS forecast projection, and just 1% less than Joe’s forecast projection.
(Note: all numbers are from memory.)
So I think we did a good deed.
As far as the subject 2017 paper is concerned, I expect the climate in the US Northeast to get colder, not warmer, starting soon. Those states that have adopted foolish green energy schemes will soon find that green energy is not green and produces little useful energy.
Regards to all, Allan
Postscript:
I got another Boy Scout merit badge this summer, for shutting down a very dangerous sour gas threat near Calgary.
For all you warmist scam artists out there: This is what real credibility looks like.
You make a prediction that actually proves to be correct – you should try it sometime.
To supplement the one graph in CTM’s post, as many may recall, two years ago I published the post “Deep Ocean Warming in Degrees C”, at my blog…Deep Ocean Warming in Degrees C | Bob Tisdale – Climate Observations (wordpress.com)
…and here at WUWT:
https://wattsupwiththat.com/2019/01/23/deep-ocean-warming-in-degrees-c/
Regards,
Bob
As I’ve mentioned a few times in the past, one of the often overlooked factors in the oceans is the changing salinity of the mixed layer. Increasing salinity affects ocean surface temperatures by reducing evaporative cooling. It is also true that fresher water holds more CO2. Hence, increased salinity of the ocean mixed layer would add to the CO2 in the atmosphere.
This diagram from a recent paper shows salinity changes in the Gulf of Mexico and how they have tracked with temperatures.
https://www.nature.com/articles/s41467-018-02846-4/figures/2
I don’t know of any global salinity data but maybe others do. It would be interesting to see how it tracked with the recent warming. It could very well be this is the cause of what is often called the recovery from the Little Ice Age and the source of much of the background warming we have seen.
Ask and you shall receive.
NOAA:
“Sea Surface Salinity“”NOAA CoastWatch”
“Sea Surface Salinity – Near Real Time – MIRAS SMOS“
I have just compared annual HadSST3 and the HadCrut4 temperature date. They follow each other to a fraction (~0.01) of degree C up to 1975 when data start to diverge.
From 1975 to 2019 land has warmed by 0.15C more than the ocean.
Is it possible for the land to warm when the ocea doesn’t?
Vuk, have you compared HadSST to CruTem? The reason I ask, is that ~71% of HadCrut should be HadSST.
Regards,
Bob
Hi Bob,
Downloaded ‘woodfortrees’ anomaly data files HADCRUT4 global mean and HadSST3 global sea trmperature, calculated 12 month moving averages and simply look at difference between the two.
Vuk:
I have recently had an analysis of the Hadcrut4 data set (1850-2019) published, titled :
“A Graphical Explanation of Climate Change”
http://www.skepticmedpublishers.com/article-in-press-journal-of-earth-science-and-climatic-change/
You will find that the analysis is irrefutable, and that the actual cause of climate change is very simple..
(tried to insert a Figure–my first try– but the image attachment feature appears not to work):
I don’t think the the Ocean’s heat content can be measured anywhere close to the accuracy of any of these indexes. I think the whole discussion is moot. El Nino’s change the distribution of heat in the Ocean and the Ocean atmosphere system.
I felt the same way more than 20 years ago when reading about El Nino’s causing global temperatures to rise.
We do not know the precise borders of the thousands of thermocline based currents in the Ocean, which also shift constantly. Without that information, there is no possible way to calculate changes in ocean heat content with the claimed precision.
Heat just sloshes around in the Ocean and between the Ocean and the atmosphere.
Change the currents, another ice age.
Change a different way, tropical Earth.
Charles,
See my comment to Ian, above.
So the real question is what has caused sea temperatures to steadily rise since 1900?
There are two climate cycles that are of the order of a century:
Note: It is likely that the effects of this long solar cycle are lagged by a couple of decades or so.
Both of these cycles were simultaneously at their minima around 1900.
The temperature pattern of the 20th century is exactly what would be expected if both of these cycles were moving in unison, from their cold phase to their warm phase, over the early part of the 20th century, diverged during the middle part (i.e. the ocean cycle going into the cooling phase mid century) and again moving higher in unison over the latter part of the 20th century.
The long sunspot cycle of the 20th century was the strongest of the last 1000 years, but has rolled over since SS23. The ocean cycle (ENSO/AMO) is now near its peak, but if it is to follow its normal 70 year cycle over, should also begin declining towards the cold phase in the next few years.
So in the next couple of decades we should see global temperatures decline as both the solar cycle and the ocean cycle are simultaneously in their cold phase.
there is also the lunar-solar cycle that can increase or decrease the penetration of hot water into the Arctic ocean for decades or centuries:https://youtu.be/w4hbKF5-qUE
Sorry, dh-mtl, but the ONLY question to ask is – why would a reputable scientist claim that it is possible to know the average temperature of any large body of a fluid or gas?
Basic physics shows that it’s impossible to calculate such an “average” temperature with any degree of accuracy that would be useful for valid scientific use.
But we aren’t interested in the average temperature. We are only interested in the change in temperature and the relative magnitude of the change. For this you only need a statistical sampling of temperatures from around the world. At a minimum a few dozen will do. If they all vary in the same direction at approximately the same time then, statistically, you can be pretty sure that something is going on.
The general temperature pattern that is shown in the HADSST3 graph, over the 20th century, has been replicated in many different datasets from around the world, local and global, land and sea. So I think that it is reasonable to assume that the earth’s temperatures have changed over the last century roughly in line with the HADSST3 graph.
What does those few anomalies tell you when they are taken at stations at different altitudes with different humidities?
Do you think averaging the temperature in Death Valley with the temperature in Denver actually tells you anything? The actual heat content of the atmosphere in those two locations are vastly different. Climate scientists trying to use temperature as a proxy for heat content are only fooling themselves – and are trying to fool everyone else as well!
*ALL* temperatures vary with the rotation of the earth and with the tilt of the earth. *THAT* is what temperatures are correlated to, not to each other. What happens when you compare the temperatures in Kansas City with one in Brazil? They move in opposite directions!
If you *truly* want to know what is going on with temperature then use degree-days – the integral of the entire temperature profile above and below a set temperature point. That will tell you what is happening with the climate in a certain location. Anomalies hide that data. A 0.1F change at 70F is vastly different than an anomaly of 0.1F at 40F. The first is a 0.1% change and the second is 0.25% change. The second is more than 2.5 times the first! Anomalies hide that relationship!
The ARGO system has 3885 buoys, according to their web site. The oceans have about 141 million square miles of surface area. That works out to one buoy for every 36,000 square miles.
36,000 miles is the area of Indiana.
If you had one thermometer located somewhere within the borders of Indiana, and if that somewhere was constantly changing, would you report that as “the temperature of Indiana” and then crank it into some kind of average for the continent?
ARGO is a good thing. The tech is as good as there is. But one of the principal problems with how modern politicized science works is the tendency to ascribe far too much weight to a little data. It appears to me that the ARGO system, superb tech though it is, is a victim of this tendency.
May I suggest a slight revision in wording – “ascribe far too much weight to far too little data”?
Well, I’ve been telling you all for years how solar variations influence cloud cover so as to affect the amount of solar energy that gets into the oceans thereby causing a net warming or a net cooling trend:
https://www.newclimatemodel.com/is-the-sun-driving-ozone-and-changing-the-climate/
Solar variability changes global cloudiness which drives climate variation via my ‘Hot Water Bottle Effect’:
https://www.newclimatemodel.com/the-hot-water-bottle-effect/
Solar effects on the ozone production processes at different levels above the surface alter the gradient of tropopause height between equator and poles so as to alter jet stream meridionality which drives cloudiness variations because greater meridionality introduces longer lines of air mass mixing between polar and equatorial air masses.
But in the end, convective adjustments maintain hydrostatic equilibrium so that the average surface temperature only varies to a small extent whilst the system seeks stability in response to destabilising influences such as changes in the quantities of radiative gases, the amount of particulates in the atmosphere and solar or oceanic influences on global cloudiness . All that changes is the positions, size and intensity of the established climate zones under the Polar, Ferrell and Hadley cells.
The larger any destabilising influences, the stronger are the negative convective adjustments which serve to maintain hydrostatic equilibrium.
See:
https://www.researchgate.net/project/Dynamic-Atmosphere-Energy-Transport-Climate-Model
which sets out several papers replacing the radiative model with a convective model as per my long standing hypotheses which have been converted into numerical form with the help of Philip Mulholland.
The radiative model is fatally deficient because it fails to deal with non radiative processes involving conduction and convection which are the true causes of the so called greenhouse effect.
The effect of CO2 variations is miniscule compared to natural solar, volcanic and ocean variations and can be ignored for all practical purposes.
Between the Mediaeval Warm Period and the Little Ice Age jet stream tracks shifted longitudinally by up to 1000 miles whereas our CO2 emissions might have shifted them by a few miles.
Utterly insignificant in the scheme of things.
And we would never know…. yet another “unprovable” from the “climate changeᴸᴼᴸ” farce. 🙂
The effect of CO2 variations is miniscule compared to natural solar, volcanic and ocean variations and can be ignored for all practical purposes.
As far as heating goes this makes sense. But consider the increased plant growth we’re seeing now with a little increase in CO2. Desertification has been decreasing for some time now. As more biomass is generated and litters the forest (and former desert) floors, more water is retained for a longer period of time rather than immediately running into the oceans. A few decades to a few hundred years of this will surely result in increasing cloud cover from ground water evaporation from larger reservoirs of ground cover, peat and pools. Hence, increasing cloud cover will reflect more incoming radiation resulting in lower temperatures. May this be Mother Nature’s thermoregulatory solution to runaway temperatures?
Don’t overlook the wind speed
The dominant cooling process for the oceans is wind driven evaporation.
The penetration depth of the long wave IR (LWIR) radiation from CO2 into the oceans is less than 100 micron (0.004 in).
The net LWIR cooling flux and the wind driven evaporation are mixed together in the first 100 micron layer or the ocean and the combined flux produces the cooling water that sinks and cools the ocean. This cooler water is replaced by warmer water from below. This means that the evaporation continues 24/7.
Any analysis of ocean temperatures has to include the combined effect of both the evaporation and the net LWIR cooling flux/sensible heat flux. The LWIR flux cannot be separated and analyzed separately.
Also, the flow velocity through ocean gyre system is set by the wind speed.
As the wind speed slows across the equatorial Pacific Ocean, both the latent heat flux and the flow velocity decrease. The ocean water takes longer to cross into the Pacific warm pool and the size of the warm pool expands.
The peak ocean surface temperatures are limited to about 30 C by thunderstorms.
This explains the relationship between the ENSO and Southern Oscillation Index.
There is a similar effect in the N Atlantic, but the role of the wind speed is reversed.
As the wind speed decreases there is more cooling.
The Atlantic Multi-decadal Oscillation is most likely produced by long term variations in the winter polar winter wind speed related to the NAO.
Within the +/-30 degree latitude bands, the average sensitivity of the latent heat flux to the wind speed is at least 15 W m^-2/m s^-1. A one meter per second increase in wind speed produces a 15 W m^-2 increase in latent heat flux [Yu et al, 2008].
The observed increase in atmospheric CO2 concentration of 120 ppm since the start of the industrial revolution has produced an increase in downward flux to the surface of about 2 W m^-2 [Harde, 2017]. This is removed by an increase in wind speed of about 13 cm s^1. Yes that’s CENTIMETERS per second.
Normal wind speed variations are 0 to 12 meters per second with higher speed short term wind gusts.
The average increase in CO2 concentration is now about 2.4 ppm per year. This produces an increase in downward LWIR flux to the surface of about 0.034 W m^-2 per year. This is the number we should be using. How does 0.034 W m^-2 per year change a hurricane or a blocking high pressure system or the Santa Ana winds in S. California? Tell this to Herring and company at NOAA with their annual ‘extreme weather’ attributions in Bull Amer Met Soc. [Herring et al 2020]
The ‘radiative forcing’ used in the climate models is fraudulent pseudoscience that has blamed the 1980-2010 warm phase of the AMO on CO2. All the discussion about forcings and feedbacks and ‘equilibrium climate sensitivities’ is complete nonsense [Ramaswamy et al, 2019]. For example look at Otto et al 2012, particularly Figures S1 and S2. See the AMO in HadCRUT4?
The bulk air temperature of the weather systems that come onshore from the N Atlantic includes the changes in the AMO that get coupled into the local weather station temperature, mainly through the minimum temperature. Then local daytime heating produces the temperature rise to the maximum temperature.
Because of the way that average ‘climate temperature anomaly’ is calculated, the AMO becomes a dominant effect.
Also, don’t forget Ekman (Coriolis) transport and pumping that can transport warm surface water to lower depths along the western boundary currents and within the ocean gyre circulation. (Missing the heat anyone?)
There is no such thing as an ‘equilibrium average climate’ that can be perturbed by an increase in atmospheric CO2 concentration.
Harde, H., Int. J. Atmos. Sci.9251034 (2017), ‘Radiation Transfer Calculations and Assessment of Global Warming by CO2’. https://doi.org/10.1155/2017/9251034
Herring, S. C.; N. Christidis, A. Hoell, M. P. Hoerling and P. A. Stott, Bull. Amer. Meteor. Soc., 101 (1), S1–S128 (2020), ‘Explaining Extreme Events of 2018 from a Climate Perspective’. https://journals.ametsoc.org/bams/issue/101/1 (This is annual series that started in 20120
Otto, A., F. E. L. Otto, O. Boucher, J. Church, G. Hegerl, P. M. Forster, N. P. Gillett, J. Gregory, G. C. Johnson, R Knutti, N. Lewis, U. Lohmann, J. Marotzke, G. Myhre, D. Shindell, B. Stevens and M. R. Allen, Nature Geoscience, 6 (6). 415 – 416 (2013). ISSN 1752-0894, ‘Energy budget constraints on climate response’. http://eprints.whiterose.ac.uk/76064/7/ngeo1836(1)_with_coversheet.pdf
Otto, A., F. E. L. Otto, O. Boucher, J. Church, G. Hegerl, P. M. Forster, N. P. Gillett, J. Gregory, G. C. Johnson, R Knutti, N. Lewis, U. Lohmann, J. Marotzke, G. Myhre, D. Shindell, B. Stevens and M. R. Allen, Nature Geoscience, 6 (6). 415 – 416 (2013). ISSN 1752-0894, ‘Energy budget constraints on climate response’, Supplementary Material. https://static-content.springer.com/esm/art%3A10.1038%2Fngeo1836/MediaObjects/41561_2013_BFngeo1836_MOESM299_ESM.pdf
Ramaswamy, V.; W. Collins, J. Haywood, J. Lean, N. Mahowald, G. Myhre, V. Naik, K. P. Shine, B. Soden, G. Stenchikov and T. Storelvmo, Meteorological Monographs Volume 59 Chapter 14 (2019), DOI: 10.1175/AMSMONOGRAPHS-D-19-0001.1, ‘Radiative Forcing of Climate: The Historical Evolution of the Radiative Forcing Concept, the Forcing Agents and their Quantification, and Applications’. https://journals.ametsoc.org/doi/pdf/10.1175/AMSMONOGRAPHS-D-19-0001.1
Yu, L., Jin, X. and Weller R. A., OAFlux Project Technical Report (OA-2008-01) Jan 2008, ‘Multidecade Global Flux Datasets from the Objectively Analyzed Air-sea Fluxes (OAFlux) Project: Latent and Sensible Heat Fluxes, Ocean Evaporation, and Related Surface Meteorological Variables’. http://oaflux.whoi.edu/publications.html
“… So the real question is what has caused sea temperatures to steadily rise since 1900? And if you think it is greenhouse gases, then you need to explain how these also caused the pre 1940 rise …”.
:no_upscale()/cdn.vox-cdn.com/uploads/chorus_asset/file/20086824/annual_co_emissions_by_region.png)
There is a corollary to that question, more specifically how the putative rise ~1900 – ~1940 was directly due to human GHG emissions?
The apparent sea surface temperature drop 1940 – 1980 is being incrementally adjusted away.
What do the cumulative emissions v time look like?
Sorry I’m busy, try a google search for yourself.
I’m sure a self-styled genius like yourself could work it out. 😉
Because I know the greasy blob in incapable.
Interesting.
Why doesn’t that look like the actual measured temperature records BOB?
DOH !!
They haven’t adjusted the temperature enough yet, of course. !!
Oops, forgot to vertical axis legend.. its in “billion t”, same as original graph
Uses data from same source.
https://ourworldindata.org/co2-emissions
1940’s in NH essentially the same temperature as now.
with 11% of cumulative human emissions.
Every bit of that is estimated from estimates and assumptions.
Including estimates of what isolationist countries allegedly emit.
A petroleum engineer like yourself should understand that the area under the curves given by Chris represents the cumulative emissions. You are an engineer, aren’t you? All you have to do is look at them to see what they “look like.” If you are ambitious you could pick numbers off the graph and use Excel to plot a cumulative curve.
“A petroleum engineer like yourself should understand that the area under the curves given by Chris represents the cumulative emissions.”
You don’t have to be an engineer to know that. What you’re missing is the fact that the plot visually obscures how much more we’ve emitted than China. On a per capita basis, even more so. That’s why you don’t see that plot in these fora…
That’s also why these posters often post plots without the data. Not a fan of visually “picking off” hundreds of points, needlessly. As they say, engineers are lazy. Who else goes to school for a min of 4 years to learn to do things the easy way….
You erroneously claimed, “What you’re missing is the fact that the plot visually obscures how much more we’ve emitted than China.” It is not obscured anymore than the relationship between the US and any other country on the chart. It is only obscured if you don’t know how to interpret such charts. Which wouldn’t surprise me.
However, a comparison isn’t what you asked for! You said, “What do the cumulative emissions v time look like?” You said nothing about particular comparisons!
What a load of empty BLATHER.
You seem to have not learnt much at all.
Back to junior high, and TRY harder next time.
Pretty PATHETIC sort of engineer that can’t even find some data and graph it !!!
Cumulatively, USA is about twice what China is, but China is catching up RAPIDLY
Yes, China et al have a lot to catch up.
That is why they are choosing FOSSIL FUELS as their way forward.
Some countries got started earlier, and became DEVELOPED because of their use of fossil fuels
GET OVER IT !!
…. or move to a country where you don’t have to put up with all the MASSIVE BENEFITS from the use of FOSSIL FUELS.
Just for fun , added some purely hypothetical cumulative USA vs China emission projections.
Took me about 10 seconds to find the relevant data.
But there is NO accounting for the IGNORANCE and INCOMPETENCE of the bog-standard AGW sympathizer that you epitomize, big greasy blob.
Are bobob’s fingers broken?
Apparently not, since bobob is able to whine and whinge about data it is apparently capable of finding all by itself.
I suspect he was a “sanitation” engineer.
Doesn’t appear to have much of any sort of actual engineering knowledge.
Against proxies data AD, the current OCH rise is basically an insignificant little wiggle.
Red writing there as a bit of a tongue in cheek remark. 😉
Earth’s ocean surface temperature is thermostatically limited to the range -2C to 30C.
Any trend in measurement inside a thousand years is more likely a measurement error than an actual trend.
These purported trends in SST dating back to 1840 are simply a joke. Who was down in the Southern Ocean taking accurate temperature measurements in 1840.
There has been no trend in SST in the Nino 34 region in the past 40 years.
Even the AGW priest Phil Jones admitted the SH data was PURE FABRICATION.
It was my understanding that the ARGO network would only be able to yield results after:-
A. Decades of ENSOs
B. A large Pinatubo type eruption.
1.Mechanised agriculture and land clearance increasing dissolved silica runoff, enhancing the competitiveness of diatoms versus cellulose and chalk walled phytoplankton. hence reduced carbon fixation and, diatoms having a ‘C4 -like’ carbon fractionation process, a proportionately greater pull down of C13, leaving a C12 signal in the atmosphere. So more CO2 in the atmosphere with an enhanced C12 signal misinterpreted as due to fossil fuel burning.
2.Haber process nitrogen fixation altering the ocean plankton ecology leading to 1. and to reduced DMS production, in turn reducing stratocumulus cover over the oceans. Hence reducing cloud amounts and ocean surface warming.
3.Oil spills from increased mechanisation of our civilisation leading to more oil run-off. A medium sized city produces as much oil pollution as a major tanker incident. Google SeaWifs. A smoothed surface with less wave breaking reduces nutrient uplift — fewer and more stressed phytos — and supresses wave breaking — fewer salt CCNs, less cloud and also lower surface albedo. Explains Arctic ice loss –oil spills from Alaska and Siberia.
4.Why the blip? See WWII and the war at sea. Extrapolate from 3.
5.Phytoplankton blooms lead to large die-offs, releasing huge quantities of lipids which smooth the ocean surface. see 3.
6.Aniline dye and 20th century chemical industry killing plankton.
JF
I have seen a bay in Ibiza smoothed just by the sun oil from bathers. En-route to Madeira I saw a smooth covering tens of thousands of miles, mostly glassy but with rivers of clean water between. Wave action was supressed in the smoothed areas up to Force 4. Cloud amounts above the smooth were much reduced.
Research natural oil seeps off the Alaskan coast. They are responsible for more oil in the ocean there than manmade spills. I can find no study which attempts to measure the year-to-year variability of natural oil seepage, but logically, it should track volcanic activity in the area (i.e., both oil seeps and volcanic activity should be responding to the same subterranean pressure changes).
That increases in natural oil seepage could be contributing to declining Arctic ice would be an interesting theory to pursue.
And Russian oil development in Siberia
JF
Here’s a one for folks with calculators and maybe some time on their hands.
Not take a lot neither.
1) As a start, the only thing that can inject heat into the ocean is the sun – either getting brighter or by there being less clouds
So, have either of those things happened?
2) The calculator bit.
Seemingly the land area of earth has warmed. i would assert that that makes quite good sense and frankly, I’m a little surprised it hasn’t warmed more than it has.
My reasoning says that ‘Tillage’ did it.
especially the part of tillage that destroys forests and perennial plants and replaces them with annual plants. Those obviously being the wheats, corns, rices etc etc of this world.
That they leave large amounts of low albedo soil lying around whereas the perennials are always green. Despite appearance, those ‘dark’ shades of green have very high albedo – circa 0.4 upwards
Now then, it rains on this low albedo soil, which will warm that water more than it did when it fell onto perennial planted land and that water will finish up in the ocean
Obviously also, floating on the top where it is easily visible
So we know the rainfall over land (circa 700mm per year).
We know the area of low albedo (warm soil/dirt/fields/farm/cities) so how much would that amount of warmer water affect the apparent temperature of The Ocean.
Back to my opening statement where I’d have expected the land temps to have risen more than they have – rainwater is carrying that heat into the ocean.
Perfect so far.
And and and (this has literally just dawned on me), it maybe really is happening here in the UK.
I keep track of a 7 little Wunderground personal weather stations – the ones I could find with long records – about 20 years and counting.
And what I see from them is that the western side of England is ever so slightly cooling.
The western side being the wet and rainy side – where the cows live, happily munching away on fields of perennially green grass.
However, the much dryer eastern side of England is warming quite dramatically – and as I’ve just realised – for 3 reasons.
1 is because its where the tillage occurs, growing all the annual plants
2) it has typically half the rainfall of the west
3) its where most people live (in cities) because, haha, it haz nice climate.
Beautiful. (I amaze myself sometimes yanno)
Also, the non-warming western side completely trashes the alarmists endless ravings about The Heat being absorbed into the ocean.
The western side of the UK catches the full brunt of the Atlantic Conveyor/Gulf Stream.
Now if 100 millions tonnes per second of moving water don’t drag up at least some of that haha trapped heat and dump it onto the UK, what will?
wtf will?
Anyway, how much heat are rivers removing from arable farmland and cities?
Answers in zettajoules if possible. Interesting huh?
Over to you shirley
Roger that Roger Oveur out out
10-4 that buddy convoy too :-/
So, have either of those things happened?
Yes… tropical clouds have decreased…. pretty much in inverse to temperatures.
Call it unsettled and incomplete settled science on which to base the global crusades. The last ones not screaming emergency are to be left out of the great funding parade.