Guest Post by Willis Eschenbach
I’ve said before that I consider myself a climate heretic rather than a climate skeptic. A skeptic doubts parts of things. A heretic questions the basic assumptions underlying the whole field. My heresy is that I do not think that temperature is a linear function of greenhouse gas forcing. I think that the temperature is regulated by a variety of “emergent” phenomena. In my last post, Watts Available, I discussed my view of how thunderstorms act to cap the tropical Pacific temperature.
In addition to my underlying heresy, I consider the various climate phenomena in what some people think is a backwards or improper manner. I’m not so much interested in how these phenomena work. Instead, I’m much more interested in what they do when they do work. I was told that this is called a “functional” analysis of a situation, which makes sense—I’m looking to see what the function of a phenomenon is.
Doing a functional style of analysis leads me to notice things like how thunderstorms operate on the exact same principle as your household refrigerator. And it also leads to my heretical view of another emergent temperature regulatory phenomenon, what’s commonly called the “El Nino”.
Let’s take a leisurely perambulation through the work of the El Nino/La Nina interchange, and consider what are known as “emergent” phenomena.
Let me start by discussing emergence and the class of phenomena known as “emergent”. Here are the defining characteristics of emergent phenomena.
- Emergent phenomena appear, often very quickly, out of what might be termed a “featureless background”. For example, a day in the tropical oceans typically dawns clear. The clear air usually persists until late morning, when suddenly and without warning, out of the featureless blue sky background, puffy white cumulus clouds rapidly form and cover half the sky. These cumulus clouds are an emergent phenomenon.
- Generally, emergent phenomena are not what might be termed naively or obviously predictable before emergence. For example, suppose you’d lived your entire life in tropical clear blue morning skies without ever seeing or knowing anything about clouds. There’s no way you’d look up and say “Y’know what? I think a whole bunch of giant white bulbous masses could suddenly appear way up in the sky!”. People would call you crazy.
- Next, emergent phenomena are generally not permanent. For example, the tropical cumulus clouds above typically dissipate before dawn. Emergent phenomena usually have an emergence time, a lifespan, and a dissipation time.
- Emergent phenomena are often, but far from always, associated with a phase change. For example, the clouds mentioned above are associated with condensation, which is a phase change of water from a vapor in the air to tiny liquid droplets in the clouds.
- Emergent phenomena are often mobile and wander around the landscape. An excellent example of this kind of emergent phenomenon are the familiar “dust devils” that are frequently seen moving across dry hot landscapes.
- Emergent phenomena involve flow systems far from equilibrium.
- Emergent phenomena, as the name states, emerge spontaneously when the conditions are right.
- The conditions for that emergence are often threshold-based. Once the threshold is crossed, many individual examples of the phenomenon may appear quickly. This is true, for example, of the tropical cumulus clouds discussed above. Once the morning gets warm enough, and some local temperature threshold is passed, a skyful of cumulus clouds rapidly materializes out of nowhere.
- Emergent phenomena are generally not cyclical. They don’t repeat or move about in any predictable fashion. It’s why the predictions of the emergent phenomenon known as tropical cyclones have “cones” rather than a single line.
From the smallest to the largest, the emergent phenomena that I think work together to regulate the global temperature include:
• Dust devils
• Rayleigh-Benard circulation of both the atmosphere and the ocean
• Daily cumulus cloud fields
• Tropical (convective) thunderstorms
• Squall lines and other thunderstorm aggregations
• Tropical cyclones
• The El Nino/La Nina alteration, discussed in this post
• Ocean-wide circulation shifts such as the Pacific Decadal Oscillation (PDO), Atlantic Multidecal Oscillation (AMO) and the like.
All of these are thermoregulatory emergent phenomena. When the local temperature exceeds a certain level, they emerge and cool the surface down in a wide variety of ways.
With that discussion of emergent phenomena as prologue, let’s look at what’s happening in the Pacific. Here’s a movie of the month-by-month sea surface temperatures (SSTs). Take particular notice of the tongue of cooler water that extends out a variable distance offshore from South America along the Equator.

Figure 1. Month by month temperature variations, Reynolds Optimally Interpolated sea surface temperature dataset. The blue box shows the “NINO34” area, from 5°N to 5°S, and from 170°W to 120°W
So where in all of that endless motion is the El Nino and the La Nina? Here’s a drawing from NOAA showing the normal Pacific conditions.

Figure 2. ORIGINAL CAPTION The map (top surface) shows the Pacific Ocean from the Americas (brown area, right edge) to Australia (brown area, left edge) Graphic shows the sea surface temperature (colors from blue to red for cold to hot), the atmospheric circulation (black arrows), the ocean current (white arrows), and the “thermocline” (blue subsurface sheet). The thermocline is the bottom of the mixed layer—above the thermocline, the ocean is mixed on a regular basis, and below it there is little mixing. As a result, the water above the thermocline is warmer, often much warmer, than the water below the thermocline.
At times, however, the heat piles up in the eastern Pacific near the Americas. In this case both the atmospheric and oceanic circulation changes, as shown in Figure 3. The thermocline deepens, with warmer water near the coast of the Americas.

Figure 3. El Nino conditions. The surface near the Americas is warmer. The thermocline off the coast of the Americas is deeper.
Moving from theory to measurement, here is the sea surface temperature (Figure 4) as well as the sea surface temperature anomaly (seasonal variations removed, Figure 5) during an actual El Nino.

Figure 4. Actual sea surface temperature during the peak month (November) of the large El Nino of 1997-1998. Note the high temperature of the water in the blue rectangle that outlines the NINO34 area. Temperature in this area is diagnostic of the state of the El Nino/La Nina alteration.

Figure 5. Sea surface temperature anomaly (seasonal variations removed) during the peak month (November) of the large El Nino of 1997-1998. This show the large heat buildup along the equator in the eastern Pacific near the Americas.
After an El Nino condition peaks, a strong trade wind starts blowing towards Asia. This blows the warm surface water towards Asia, to the point where the thermocline comes all the way to the surface off the coast of the Americas. When the warm water hits the coast of Asia, it splits in two. One part goes towards the Arctic, and the other goes towards the Antarctic. Here’s the NOAA graphic showing La Nina conditions.

Figure 6. Schematic diagram of the La Nina Condition.
And as above, shown below is an actual La Nina condition. This is the La Nina peak of the same Nino/Nina cycle in Figure 5, which began 12 months earlier, in November 1997.

Figure 7. Reynolds Optimally Interpolated (OI) sea surface temperature for November 1998.
And here is the temperature anomaly at that time:

Figure 8. SST Anomaly (seasonal variations removed) during a peak La Nina condition.
Note in Figure 8 above how the trade winds have exposed the cooler subsurface waters all across the equatorial Pacific. They’ve been laid bare because the warm water has been pushed westwards. You can see above how when the warm water hits Asia/Australia, it is mostly split in two and moves towards the poles.
Now I started this by saying I do functional analysis. I don’t look at what causes the El Ninos or the La Ninas. I’m not trying to understand the processes. Instead, I look at what they do.
When I do that, I see that talking about the El Nino and the La Nina as separate phenomena is incorrect. They function together as the world’s largest pump. What they do is pump trillions of tonnes of warm equatorial Pacific water polewards. So much water is pumped that the elevation of the equatorial Pacific sea surface drops, and the effect is visible in local tide gauges.

Figure 9. The Nino/Nina differences as shown by the TAU/TRITON moored buoys along the Equator. You are looking westward, across the equator in the Pacific Ocean, from a vantage point somewhere in the Andes Mountains in South America. The colored surfaces show TAO/TRITON ocean temperatures. The top surface is the sea-surface, from 8°N to 8°S and from 137°E to 95°W. The shape of the sea surface is determined by TAO/TRITON Dynamic Height data. The wide vertical surface is at 8°S and extends to 500 meters depth. The narrower vertical surface is at 95°W. All of these data come from the TAO/TRITON Array of moored ocean buoys in the Equatorial Pacific.
So … what happens when warm ocean water gets transported towards the poles? More heat is lost to space. Figure 10 shows how much upwelling surface radiation makes it to space, by latitude.

Figure 10. Top Of Atmosphere (TOA) upwelling longwave radiation as a percentage of the upwelling surface radiation, by 1° latitude band. These are monthly averages over the entire period of record.
In Figure 10 above, the low spot at about 7°N or so is the location of the ITCZ, the intertropical convergence zone. When you start moving towards either pole, there’s an immediate and continuing increase in the percentage of the surface thermal radiation that escapes to space.
Now given the functional nature of my analysis, I make a different identification of “El Nino” and “La Nina” than the one normally given.
There are several indices used to evaluate the El Nino/La Nina conditions. An example of an index is that “El Nino conditions” are times when the sea surface temperature (SST) anomaly in the NINO34 Region (blue box) is more than a certain temperature (often around 1°C) warmer than normal. And “La Nina conditions” are when they are more than a degree cooler than normal in the NINO34 region. (There are other identifications, but they all identify Nino and Nina conditions separately, and they all establish a temperature threshold for Nino and Nina conditions. I do neither.)
I don’t look at them separately, or have any set temperatures. This is because I don’t see them as separate phenomena.
Unlike the standard definitions, I identify the Nino/Nina phenomenon as working together as a pump. In that pump the El Nino is the peak of the intake stroke, and the La Nina is the peak of the discharge stroke. We can see this activity in a graph of the temperature in the NINO34 region (blue rectangle shown in the graphs above).

Figure 11. Sea surface temperature in the NINO34 area. Blue sections show the times when the pumping action is occurring. Red dots show peak El Nino conditions, and blue dots show peak La Nina conditions. Dotted vertical white lines show November of each year.
I have highlighted in blue the times of the pumping action. What I first noticed about them is what the Peruvians noted about them. This is that they all start within a month or so of November, and thus are often strong near Christmas … hence the name “El Nino” for the boy-child.
I noticed another oddity. In all cases highlighted , the duration of the pumping action from the red dot at the top (peak “El Nino”) to the blue dot at the bottom (peak “La Nina”) is one year plus or minus a month or so. This allows us to distinguish the Nino/Nina pumping action from the normal temperature variations found anywhere in nature.
The regular ~ 12-month length of the discharge cycle also shows that the two (El Nino and La Nina) do not exist as independent entities. Instead, they are intimately tied in a single larger one-year-long phenomenon.
Now, recall that the question in functional analysis is, what does this single larger combined Nino/Nina phenomenon do?
I say that the El Nino/La Nina pump is an emergent phenomenon with a lifespan of 12 months. It emerges when enough heat is built up in the eastern equatorial Pacific Ocean. It cools the equatorial Pacific, and hence the entire planet, by
1) exporting the warm equatorial surface waters polewards where the heat is lost more quickly to space, and by
2) exposing the cooler subsurface ocean layer which cools the atmosphere.
So the function of the El Nino/La Nina alteration is to cool the earth by means of a periodic pumping cycle.
Like many other emergent climate phenomena, it is what I call “self-latching”. By this I mean that once the Nino/Nina pump starts, it creates conditions such that it strengthens itself, and thus tends to persist.
Here’s how that works. The strength of the trade winds in the equatorial Pacific is driven by the east-west temperature difference. Now, when the pumping action is underway, the east is getting cooler, and the warm water is piling up in the west. This increases the east-west temperature difference, which in turn increases the east–>west wind strength, which in turn increases the temperature difference, which …
This makes it self-latching, and this positive feedback is responsible for the long duration of the phenomenon once initiated. Once the Nino/Nina phenomenon begins, it generates its own wind. This allows it to continue to runs until the cold water is exposed all along the equator, as you can see in Figure 8 above.
Predictions and Conclusions
Now, any theory such as mine is only as good as its predictions. So how can I determine if the Nino/Nina is actually an emergent phenomena that cools the Pacific when excess heat builds up?
Well … we could start with the observation that the trigger for the pumping is the buildup of heat in the eastern Pacific. So the form of the phenomenon obviously is temperature-limiting (cooling) and thermal-threshold based (happens more when it’s warmer).
What I’d never figured out until this analysis was how to determine whether the Nino/Nina pumping phenomenon as a whole was more frequent or more powerful or both in warmer times than in cooler times. The problem is that we already know that it is triggered by excess heat … but does it increase when the excess heat increases? And how would you measure that increase?
What I realized is that if the pumping increases in warmer times, such as the current post-1981 Reynolds SST record of a gradual slight overall ocean surface warming, we should see differential heating trends in the Pacific.
And what the pattern of larger and smaller trends should look like is what it looks like after a complete pumping cycle—the areas on the way to the pole should show warmer trends, and the eastern Pacific should be cooler. If there is an increase in the number of Nino/Nina cycles, the transfer of energy will show up in the trend. The trend should be smaller in the area along the Equator where the pump exposes cooler water, and the trend should be larger where the pump moves the warm water, which is westwards and towards the poles.
Here’s how that played out at the end of the large 1997-1998 Nino/Nina cycle. I repeat Figure 8 from above to here for comparison.

This is Figure 8 from above.
And here are the sea surface trends during a 36-year period when, as the figure below shows, there’s been a slight SST warming (0.10°C per decade).

Figure 12. Decadal sea surface temperature trends.
My conclusion from the distinct similarity of those last two graphs is that the prediction from my theory is correct—the Nino/Nina pump is indeed a temperature-regulating emergent phenomenon, which opposes any increase in overall tropical Pacific temperature.
Here, the first rain came yesterday after a long dry “fiery but mostly peaceful” wildfire season here … the forest smells of growth, green life, and decay are particularly strong this evening, reminding me of the endless cycles of creation and destruction.
My best regards to everyone,
w.
Post Scriptum: When you comment please quote the exact words that you are discussing. This helps avoid the endless misconceptions that plague the internet. For more info regarding how you can show that I’m wrong, see my post Agreeing To Disagree.
I’m not so much interested in how these phenomena work.
Nice job Willis although some of us are interested in the ‘how’. The emergent phenomena is linked to solar activity, ie, the solar ‘cycle’ is driving the pump:
Nice picture, not sure what it means …
w.
This represents the average solar cycle influence for each of the last seven solar cycles on the Niño12, 3, and 34 regions of up to a 1°C positive temperature anomaly change. It was computed by taking one sample of a high solar activity year minus one sample of a low solar minimum year from each of those seven cycles.
We can look at the effect of the last solar cycle maximum instead of one year re the ERSST image.
The 2015/16 El Niño followed the 2014 SC24 sunspot peak that drove TSI above my sun-ocean decadal warming/cooling threshold represented by the solid straight red line in plot (g) of Fig10 below of 1361.25 W/m^2 SORCE TSI.
The 2015/16 El Niño took off in earnest driving the Equatorial OHC anomaly positive until TSI fell below the threshold again (i), driving all manner of emergent phenomena along the way such as Kelvin waves, atmospheric rivers, the ‘Blob’ NW Pacific Warm Pool – all parts of the cooling process of expelling the high-TSI solar absorbed ocean heat content.
I think the 1°C temperature change anomaly shown in the ERSST image is statistically significant in spite of the low R values for the various oceanic indices shown below in Fig11 with respect to TSI. If the data were partitioned and compared according to the time of the solar activity period above my threshold to that below it, or a detrended TSI anomaly wrt my threshold is used, I think the R-values will improve into the very statistically significant range, the next task for me.
Your emergent phenomena could then be rigorously linked to the ocean’s solar supersensitivity.
The sunspot connection is cumulative, lagged from sunspots to TSI, and lagged again from TSI to Eq. OHC, which helps to explain why prior efforts at linking sunspots to weather were inconclusive.
Bob, I’m gonna pass on this. I just took a look at the NINO34 index since 1870. There’s no power in the 11-year range. There’s a small peak at nine years and another at fourteen years, but nothing at 11 years.
In addition, a scatterplot of the NINO34 index vs. sunspot numbers shows absolutely no correlation (p = .64, R^2 = 0.0001.
Sorry, not seeing it.
w.
I’m sorry Mr. Willis but your methods are too ‘linear’ which is why you haven’t ‘seen it’.
I’ll bring out the solar threshold-partitioned analysis I mentioned earlier when I have it, but in the mean time we can look at another type of data partitioning I did a year ago that works well enough to ‘see it’.
You correctly mentioned the temperature isn’t a linear function of greenhouse gas forcing, and you could in all fairness extend that idea to long-term solar forcing too. As I said the solar effect is cumulative with sunspot number, a concept that applies not just to individual top of solar cycle Niño(s) such as I cited in my previous example, but also to the solar effect on Niño regions over much longer time periods.
I previously looked at Niño1-4 since 1870 wrt 30y average sunspot number in 2019.
In doing so, I created an partitioned Niño indice shown below I called ‘Nino1234’, a timeseries since 1870 of the Niño regions interyear ratio for each year expressed as a percentage of the ratio of the sum of the area-weighted Niño1-4 data of the first half of each year to the second half of each year, which accounts for both the annual insolation cycle effect and the effect of sunspot number changes since 1870, because the early year TSI is most geoeffective closest to the perihelion in January.
I found a very strong correlation with a 13y lag for the 30y SN compared to the 30y Nino1234 timeseries, R=.96, where the P-Value is < .00001. The result is significant at p < .01.
How is this applicable to the present climatic situation? The present 30y SN average is 69.5, below the 87 SN breakeven threshold indicated on the SN-v-N1234-CO2 plot, and the 13y SN ave today is 42 SN, which is why the tropics are presenting cooling.
Thanks for your thought-provoking article.
Good effort Bob, should we discard the lunar hypothesis?
…should we discard the lunar hypothesis?
Why did you ask that non-sequiter, when it doesn’t matter to the climate?
Ian Wilson seems to think ENSO behaviour is influenced by the moon, just saying.
‘ … whether the Nino/Nina pumping phenomenon as a whole was more frequent or more powerful or both in warmer times than in cooler times.’
Cooler times like the LIA might have produced greater intensity and more La Nina conditions. During warm times like the Holocene Climate Max the ENSO cycle may have been longer.
No one knew what the “global” temperature looked like in the LIA. Temperature swings occur with ocean cycles but the trend over decades is constant unless there are volcanoes or asteroids. Longer term, the orbital geometry plays a role in altering the weather around the globe but the energy balance is subject to very powerful negative feedbacks that are as good as any room thermostat.
I think we can generally agree that European temperature minimum during the LIA was about 1.5 °C below the long-term mean.
ENSO is an enigma and the Western Pacific Warm Pool is a heat engine, there maybe a teleconnection?
As I point out below. The SST in Nino 34 region has not changed in the last 40 years:
https://1drv.ms/b/s!Aq1iAj8Yo7jNg3j-MHBpf4wRGuhf
Once you realise that the SST is stuck between two firm limits, 271.3K at the sea ice interface and 305K in the tropics then there is plenty of evidence to support the thermostatic control. Even the exception of the Persian Gulf, which cannot form CAPE so is the warmest ocean surface on the planet proving the reality of powerful shading.
Sure ocean circulations are going to move the boundaries in and out on a cyclic basis but the longer term tropical SST trend is zero.
The power of clouds to shade tropical oceans is limitless once the SST approaches 32C. At the other extreme, sea ice is a powerful insulator that prevents heat loss.
These powerful temperature control mechanisms are clearly beyond the capacity of climate scientist to comprehend. They have a myopic view on the “greenhouse effect”, which is a figment of some incompetents imagination and the irrelevant impact of a trace gas.
As El Nino builds the Western Pacific Warm Pool expands, warming the ocean.
https://agupubs.onlinelibrary.wiley.com/doi/full/10.1002/2016GL071767
Does the Warm Pool shrink during La Nina? Methinks it stands as a barrier and sends the cool waters back east where they gradually warm up.
That’s an interesting question. Do the variations in the interglacial temperatures, e.g. the LIA and the Minoan/Roman/medieval warming periods, represent systemic “global” changes or purely changes in the Niño/Niña cycle, raising or lowering temperatures in EurAsia but not globally?
This recent abstract suggests that la Nina type conditions operated during the early Holocene.
https://journals.sagepub.com/doi/abs/10.1177/0959683610369508
I think La Nina was also prevalent throughout the LIA.
In an otherwise drying climate the LIA brought anomalous moisture.
‘At centennial scales, the record presents the first insights into subtropical Australian hydroclimates during the LIA, and we find that persistently high rainfall marks this period as anomalous in the context of the late Holocene. This contributes to a complex picture in which there is an apparent decoupling of SST and terrestrial hydroclimates during this interval.’
Barr et al 2019
The emergent property you seek is called Convective Available Potential Energy (CAPE). It kicks in when the TPW reaches 30mm and generates daily cloud burst when TPW reaches 38mm. CAPE is essential to creating and intensifying cyclones. The resultant highly reflective cloud prevents open ocean surface from reaching 32C. Reflected energy increases asymptotically as SST approaches 32C.
You need to look at reflected energy. It increases dramitically once TPW exceeds 38mm.
The Nino 34 region has not changed temperature in the last 40 years:
https://1drv.ms/b/s!Aq1iAj8Yo7jNg3j-MHBpf4wRGuhf
This temperature is viewed as a key indicator of climate in the Pacific rim countries. So it is a highly regarded record.
The linked chart here shows how energy is rejected as TPW increases. The knee at TPW of 30mm is particularly noticeable comparing the winter and summer rejection for the Northern Hemisphere:
https://1drv.ms/u/s!Aq1iAj8Yo7jNg2_DukRksyuhIkZ8
The atmosphere moves into shade mode once TPW exceeds 30mm.
Once there is daily CAPE at latitudes higher than 10 degrees, cyclones form. Cyclone can block out 80% of daily insolation. They cool an ocean surface at midday with sun directly overhead with insolation exceeding 1400W/sq.m. Cyclones are clearly visible by their reflective power:
https://1drv.ms/u/s!Aq1iAj8Yo7jNg20rmI6ZbdeTV0c9
Cyclones are the brightest spots on the planet. Monsoons not far behind.
If you see any temperature measurement that shows a long term warming or cooling trend then check the measurement system. Earths energy balance is tightly constrained by a powerful thermostat operating over the sea surface in the tropics and at the sea ice interface. SST range is confined between 271.3K and 305K to give 288K mean.
The only sea surface exceeding 32C is the Persian Gulf because conditions there prevent the formation of CAPE. It is the only sub-tropical surface exceeding 27C that has not experienced cyclones in recorded history.
RickWill: “SST range is confined between 271.3K and 305K to give 288K mean”
WR: This is interesting, but fortuitous. During a glacial the average temperature of the Earth is several K lower and in a Hothouse situation several degrees higher.
The difference is made by a change in the distribution (of solar energy) and in the redistribution of (absorbed) energy over latitudes.
You are right but those changes occur over hundreds of thousands of years or millions; driven by orbital changes and movement of land masses.
We know Antarctica was warmer when there was no ice in the southern Pacific before the southern ocean circulation began after Drakes Passage opened. Atlantic was cooler. We know that Eastern Australia received much more rainfall during that era. The average temperature of the Pacific was warmer but the tropical Pacific still did not exceed 32C because it cannot. There was little or no sea ice abutting the Pacific in Antarctica – trees grew there.
Mid Holocene there was a step change during a time of climate transition … 4.7 ka.
https://www.nature.com/articles/s41598-020-61013-2
Interesting but …
1. It’s not easy to separate cause from consequence when dealing with the El Nino-Southern Oscillation.
2. Some of the change in thermocline depth in the tropics can be attributed to higher temperatures causing expansion of the water down to the thermocline.
3. The percentage of surface upwelling radiation that gets out to space is interesting but should also mention how much radiation is received at the various latitudes. And let’s not confuse intensity, in Watts/m^2 with the total because watts are joules/second and therefore there’s a time component involved. Taking longer to lose the same amount of heat would mean nothing more than a lower figure for watts/m^2.
4. Hadley Circulation (transmeridional – i.e. spreading tropical heat towards mid-latitudes in the NH in particular) increases during El Nino events and decreases during La Nina events. When heat is dispersed, the upwelling radiation is reduced (refer S-B law and note that T^4 causes the difference).
5. La Nina events don’t always follow El Nino events (e.g. 2015-16, 1982-83), nor do El Nino events always precede La Nina (e.g. 2010-11)
6. Determining what starts an El Nino event is interesting but with so many feedbacks supporting it there’s a question of why those events stop. This article suggests it’s a developing La Nina, but see 5 above. And the obvious follow-up question is what triggers a La Nina if it’s not an El Nino?
Solar activity appears to be the trigger.
https://judithcurry.com/2019/09/01/enso-predictions-based-on-solar-activity/
Generally true in climate. I follow the wisdom of Mulla Nasruddin, who said “Only a fool looks for cause and effect in the same place.”
Seems doubtful. Here’s a discussion of “thermosteric” sea level rise, which is rise due to the expansion you mention.
That wouldn’t change the depth of the thermocline in any significant fashion.
You continue:
Not clear why you’d want that.
I assure you I don’t confuse watts and joules.
Mmm … not clear what that means. Heat is not energy. Heat is the energy that flows spontaneously from warm to cold. Not clear what “heat is dispersed” means.
You are using the traditional definition of those events, which in my opinion is confusing and misleading.
Again you are using the traditional definition and insisting on a traditional analysis focusing on “why it happens”. I do a functional analysis that focuses on “what does it do when it happens”.
For me, the pumping action is what is of interest. It is, as described above, self-latching. Once it starts, it tends to persist until it has blown itself out. I would think that it stops when there’s very little warm surface water remaining all across a wide expanse of the equatorial Pacific, and thus little temperature difference to drive the wind. However, such processes are generally complex, so there may well be other factors.
Regards,
w.
Willis
Nice article.
“My heresy is that I do not think that temperature is a linear function of greenhouse gas forcing”
I do not disagree with this challenge to the foundation of CAGW, but my position is more broad.
CAGW is a contrived political “package” involving many disputable components.
Whether we are a heretic or sceptic, we must fight on all fronts as well as the package as a whole.
I am not very smart. Dropped out of school at 17. Joined the service, got out, got married, had child, blah, blah. How about this theory? When the oceans warm up, we have more hurricanes which suck up the heat, distribute it through winds and rain, thus trending more toward average (there being no ‘normal’). Then, when the oceans are cooler, there are fewer hurricanes, thus trending the oceans more toward average. Similar deal with tornadoes. Give it a thought?
Thanks,, Renaldo. Let me encourage you to hold a higher view of yourself and your ideas. As my dad used to say “Imagination is free”. And nobody has a lock on imagination. Education doesn’t guarantee it, nor (sadly) does age.
So. From your fertile imagination you’ve pulled an idea, which is exactly what I’m talking about. This is that when it warms up hurricanes and tornadoes increase and when it cools they decrease. I’d suggest that that is true in both the short and long term … however, the difference may not be detectable. This is because there is an unimaginable amount of energy flowing through the climate system, and as a result, a small change in say clouds or other phenomena may have a large effect.
Trust yourself more, bro’, you’ve got good instincts.
w.
Complexity often depends on how one chooses to view a problem. In the case of CAGW the theory explicitly states rising CO2 warms the planet by reducing Earth’s energy loss to space. NASA has measured Earth’s energy loss to space since 1985 (outgoing longwave radiation or OLR for short) and it has been steadily rising not falling. If the predictions of a theory conflict with measured reality the theory is wrong. To me, it really is that simple!
Michael Hammer November 8, 2020 at 9:26 pm
Mmmm … don’t think so. The theory states that rising CO2 warms the planet, but not by reducing energy loss to space. Instead, it warms the earth by delaying earth’s energy loss to space. This doesn’t decrease the amount being lost to space, it just delays it.
However, this warms the earth, and when the earth warms, the total amount of LW energy lost from the surface increases, as does the total OLR.
w.
Is your objection
“Mmmm … don’t think so.:
that OLR is not increasing or that increasing OLR is not in conflict with the green house effect hypothesis?
If OLR is increasing does that not mean that additional energy is being radiated away?
If additional energy is being radiated away should that not result in net cooling?
If not cooling, then additional energy is being radiated away (increasing OLR) but the earth is warming in spite of retaining less energy?
AndyHce; exactly. For Earth to warm energy in must be > energy loss. The CAGW claim was that GHG’s were reducing OLR but unfortunately the NASA data for the last 35 years shows OLR is rising not falling. If you look at the literature you will now find the warmist response is that the warming is actually due to a rise in absorbed solar radiation (ASR) but the AGW theory is still right! Why, because feedbacks convert a fall in OLR to a rise in ASR. At least GHG causing a fall in OLR had some established scientific basis but there is no such basis for claiming a rise in CO2 causes ASR to rise. Purely conjecture. Their claim seems to be that as Earth warms more water evaporates and that causes a drop in cloudiness hence a drop in albedo. Trouble with that is that more evaporation means more precipitation and rain only comes from low dense clouds so less cloud leads to more rain??????
Willis, I am sorry but I must strongly disagree! Look at the Nimbus plot of energy loss to space, in the absence of GHG’s the energy loss would follow planks curve. Instead it shows large notches at the water vapour, CO2 and Ozone absorption wavelengths. The area under the emission curve is reduced (ie OLR in total is reduced). GHG’s block surface radiation and replace it with radiation from the top of the GHG column which is essentially the tropopause. This can be seen by the effective emission temperature (determined from Plank’s law assuming a near unity emissivity which for GHG is unquestionably correct). This tells us the altitude from which the emission is occurring.
Earth can only warm of energy in > energy out. You say GHG’s delay energy out but for how long. If it is only a delay then eventually energy out would rise back up to original levels and warming would stop. Also, if energy out is rising not falling, then what is driving the warming? Further, if you say GHG’s delay energy loss then surely that means that at least in the short term OLR should be reduced and falling further as GHG’s concentrations rise.
You say “However, this warms the earth, and when the earth warms, the total amount of LW energy lost from the surface increases, as does the total OLR.” So the delay reduces OLR short term? But the warming causes OLR to rise. SO GHG’s both reduce OLR and drive up OLR???? So ask yourself again, what is causing the warming, is it a fall in OLR or a rise in absorbed solar radiation (ASR)? If it is a rise in ASR how is CO2 responsible for that?
The branch of science underlying the action of green house gases is spectroscopy and this science clearly tells us that the initial action of GHG’s is to reduce OLR, it does not “delay” OLR. However that does not mean that the incremental impact is significant or will cause further warming. It all depends on the feedbacks. Oh and by the way, without green house gases there would be no weather on Earth, no rain, no wind no lapse rate and the surface temperature at the equator at noon would be above 100C! Sound farfetched, think about the atmosphere as a heat engine. Where is the necessary cold junction and how does it lose energy to space. If interested I have a short dissertation/analysis on the subject which I can post.
As I have said many times before, Willis’s description of emergent phenomena is absolutely right.
He just needs to extend his hypothesis to cover every density driven movement of gases and liquids within a gravitational field.
It even applies to convection within the solid material of the Earth’s mantle.
Once he does that, I would hope he would then see, that everything he describes is simply the system working in accordance with the broader hypothesis that I have been promulgating for years and which has now been set out in detail in the work of myself and Philip Mulholland.
The emergent property is way simpler than you think. The atmosphere moves into cloud burst mode when the TPW exceeds 30mm. It will go into daily burst mode once the TPW exceeds 38mm. This is observed in the tropics as monsoon. The resulting dense cloud is highly reflective and simply shades the surface to reduce heat input. Small reduction in OLR but massive increase in SWR.
Convective Available Potential Energy (CAPE) is a well known cause of cloud burst and is an essential ingredient for cyclone genesis and intensification. Cyclones can cool ocean surface by more than 3C during their passage. They knock out some 80% of the ToA insolation. Very powerful sun shades. More powerful than monsoon but not as consistent. Cyclones are the major relief valve that kick in when the SST increases to 27C at latitudes greater than 10 degrees, where Coriolis acceleration spins them up as they extinguish CAPE.
Absolutely. I have previously mentioned CAPE.
The space between molecules is full of it and the higher one travels the more there is.
CAPE is constantly being created from kinetic energy in uplift and converted back to kinetic energy in descent.
CAPE is created by the condensation above a level of of free convection. Any atmosphere that has more than 30mm TPW can produce CAPE. Once TPW exceeds 38mm then daily cloud burst is possible and the atmosphere will generate monsoonal cloud on a daily basis.
This is all that is needed to produce the highly reflective cloud that all but eliminates surface level insolation.
Very interesting – have you a link for the effect in the mantle?
As regards ENSO, the balance between El Nino and La Niña is solar driven because solar variations alter the gradient of tropopause height between equator and poles which alters the degree of jet stream variability and thus global cloudiness which then changes the amount of solar energy able to enter the oceans.
So, an active sun leads to more EL Ninos with global warming and a quiet sun leads to more La Ninas with global cooling.
However, the system cannot allow the hydrostatic equilibrium of the atmosphere to be destroyed so other emergent phenomena within the system change in order to ensure that energy in from space continues to match energy out to space.
In the end, the surface temperature for a planet with an atmosphere is governed by the mechanical process of convective overturning and not by back radiation from atmosphere to surface.
The radiative fluxes between surface and atmosphere are a consequence of those mechanical processes rather than a driver of them.
Willis correctly observes and describes the day to day features of the system in action.
You could swear looking at Figure 1 that the world is Breathing.
“You could swear looking at Figure 1 that the world is Breathing”
And that is the view of the centre of her back.
Just imaging what the front view of her chest looks like.
Willis, as a mariner yourself, you’ll be aware of the Marpol annex 1 regulations which came into effect in October 1983 and since which there has, theoretically, been a reduction in the amount of oil floating on the surface of the oceans. Considering the known impact of oil in suppressing wave action and therefore of heat exchange between the ocean and the atmosphere, has this been taken into account in global climate modelling? Would its impact be noticeable in any sea surface temperature datasets?
Bloke back down the pub,
I love questions like yours -its a matter of working out the scale. So here goes.
Surface Area of planet Earth 510,000,000 Sq Km (plus a bit).
There are 5 recognised oceans that make up the World Ocean, these are in order of size:
The Pacific, the Atlantic, the Indian, the Southern and the Arctic Oceans.
Two of these are ice covered (for at least part of the year) so let’s just look at the 3 ice-free oceans.
The Pacific, Atlantic (include the bits on the side like the Mediterranean Sea) and the Indian Ocean have a total surface area of 300,800,000 Sq Km (plus a bit).
OK now let’s look at the oil question. A sheen of oil on the surface of water is typically 1 micron thick (1 millionth of a metre). So, to cover all of the 3 ice-free oceans with a film of oil 1 micron thick we are going to need 300,800,000 cubic metres of oil.
Now where do we get that oil from? Well if we assume that the are 500,000 barrels of oil in a supertanker and that volume is 58,674 cubic meters, then we require 5,128 tankers to deliver the required oil volume to the surface of the 3 oceans. In 2010 the world tanker fleet was 11,127 vessels.
So, in order to cover the 3 world oceans with a sheen of oil 1 micron thick we need to deposit a volume of oil equivalent to that carried by just under half (0.46) of the total world tanker fleet.
The world is a big place and of course pollution is bad, but sometimes we think that we are more important than we actually are.
“The world is a big place and of course pollution is bad, but sometimes we think that we are more important than we actually are.”
You forgot to mention that oil is a natural substance that is eaten by microorganisms, so that to keep and oil slick, you have to have all those tankers continuing to dump repeatedly.
It is city dwellers who see the world as limited by their footprint. Here the municipality was required to build a caisson around a new boat ramp, specifically to prevent leaching of fresh concrete into the ocean. Boat ramps cast between neep tides last for many decades, so the concrete itself does not have to be protected for weeks.
Oh, very well done! Another man who loves “back-of-the-envelope” calculations as much as I do. I just ran the numbers myself and they agree with yours.
My only caveat is that you wouldn’t need to cover the global oceans to have a big effect, particularly locally. But even a tenth of the oceans would require 500 supertankers dumping all their oil …
There’s a further problem. There is a reasonable amount of global crude oil seepage from underneath the oceans. You can often see the sheen from natural oil seeps off of Santa Barbara in California, for example. As a result, the ocean is full of creatures that like crude oil for the same reason we like it—it contains energy. And between ultraviolet in the sunshine, plus chlorine and other chemicals in the seawater, aided by oil-eating bacteria, the ocean consumes surface oil sheens pretty rapidly. Within a month or two most of the oil would have disappeared … so we’d have to have another 500 supertankers dump their full loads every three months or so.
Good stuff.
w.
Thanks Willis,
Estimation is a critical part of science and it needs to be applied much more often.
Probably anything but CO2.
Like the Sun.
During periods of low solar activity, the effects of La Niña in the Northern Hemisphere are stronger because of the meridional jetstream.

The solar wind is still very weak as indicated by the high level of galactic radiation.
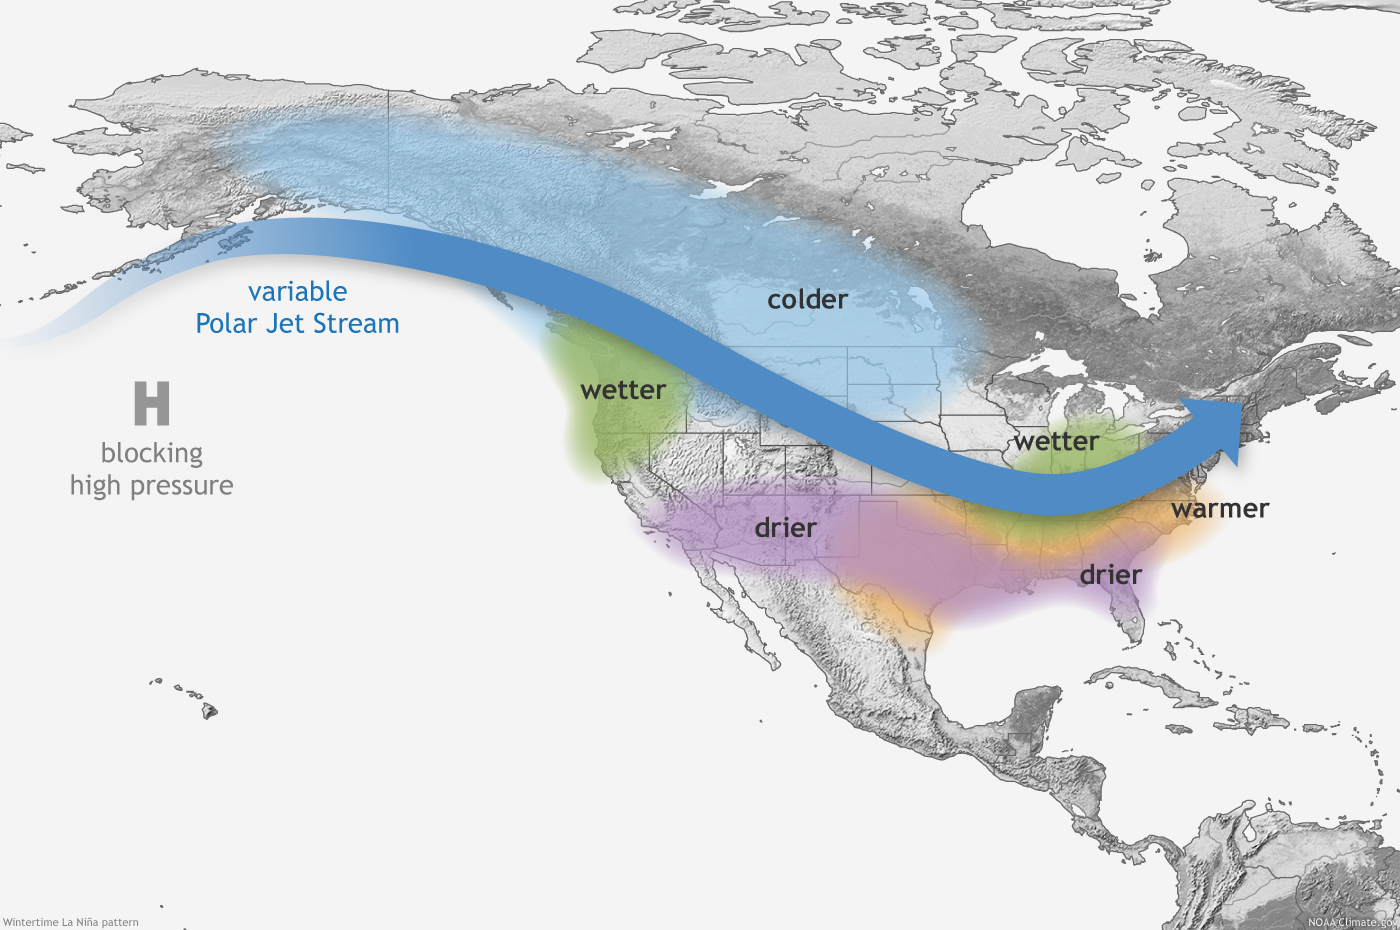
Typical impacts of La Niña on U.S. winter temperature and precipitation. Such impacts have been associated with past episodes, but all impacts aren’t seen with every episode. NOAA Climate.gov drawing by Fiona Martin.
During periods of low solar activity, the temperature in the North Atlantic is more closely related to the meridional jetstream than to La Niña.
Observe how the winter polar vortex works in the lower stratosphere. This determines the circulation in the upper troposphere.
I dont think it is pseudorandom, nor cancels to zero. It has a bimodal length between solar min el ninos similar to the sun (~10.4/12.1 yrs). https://app.photobucket.com/u/etregembo/p/2cb3bc3a-9910-4876-93e9-97bdfe23235f
With the enso index positive meandering during solar max and el ninos at polar magnetic flip, it is why finding the elusive 11yr cycle is difficult. it is twice as frequent (the pulses into the atlantic).
Super!
i will never look at enso the same again after overlaying the two images. the sun is the controlling mechanism in some unknown way (geomagntic probably). if you look at the pdo and the pulses into the atlantic, when cycle lengths is 10.4yrs, you cant see the individual pulses for solar min/max, but when the length is 12.1yrs, you can clearly see min/max pulses. the ocean time constant is longer than the short cycle, so those 3c transients result in 0.1c/decade imo.
Willis
Thanks for this useful article on emergent phenomena.
Figure 10 about the amount of radiated heat escaping with latitude, rang a bell in my memory about a paper I read this year on the subject of “why leaves are green”.
The paper by Trevor Arp in Science this year is entitled: “Quieting a noisy antenna reproduces photosynthetic light harvesting spectra.”
https://arxiv.org/ftp/arxiv/papers/1912/1912.12281.pdf
Why the link? Well figure 10 above shows that emitted radiant heat has its lowest “percent making it to space” at the equator where the heat and light are most intense. The peaks of transmission efficiency of heat to space is at the poles, where of course the heat and light are minimum.
This is analagous to the reason why leaves are green (or occasionally purple). It’s not intuitive why photosynthesis should be associated with green structures, since green is near the middle of the visible spectrum and associated with the most energetic band of potential absorption of light energy. So if the goal was to absorb the most light energy, green would not be the chosen colour – it would want to accept, not reject, the optimal green-yellow photons. But it turns out that maximising light intake is not the goal. In a really interesting piece of science, Arp et al show that the priority is stabilising energy input where incident sunlight intensity can vary rapidly over a wide range – think of a leaf swaying on a branch in a crowded forest or thicket. Avoiding the danger of saturation and too much energy turns out to be as important as overall efficiency.
Anyway in a nutshell, leaves being green and having maximal absorption in two peaks that are away from the maximum of spectral energy, allows the photosynthesis system as a whole to have the best adaptiveness to changes between high and low incident intensity. So the spectrum of light absorption for green photosysnthesis looks similar to figure 10 where emission of light to space is maximised near the poles, not at the equator where the energy supply is most intense.
It looks like both the transmission percent to space with latitude and the photosynthetic spectrum of used light energy have twin peaks, away from the most energetic part of the spectrum and separate from eachother. This twin peaks away from the maximum pattern seems to be one that maximises adaptiveness.
So adaptiveness could be the goal that the system optimises rather than pure rate of energy throughput, thus efficiency is diminished at the energy peak and maximised at twin peaks away from the maximum. Photosynthesis wants a controllable input of energy without damaging excursions of saturation and oxidation. And the climate “wants” to regulate energy output to achieve a stability and homeostasis in the climate also – as an emergent property or attractor.
Just a thought, does this make sense?
https://images.app.goo.gl/svDQsNHAKKCUoUoZ8
Thpis is not surprising as the troposphere above the polar circle is very thin, especially in winter.
http://ds.data.jma.go.jp/tcc/tcc/products/clisys/STRAT/
Sorry.
It is not surprising that the radiation into space is stronger at high latitudes. The weaker the polar vortex, the stronger it is.
http://ds.data.jma.go.jp/tcc/tcc/products/clisys/STRAT/gif/zt_nh.gif
Ren: http://ds.data.jma.go.jp/tcc/tcc/products/clisys/STRAT/
WR: interesting. All (warm) convection over the North Pole (low quantity of sea ice, high water vapor, low pressure areas, high convection) results in lower actual stratospheric temperatures.
My guess: the intrusion of water vapor into the stratosphere has a cooling effect: extra water molecules radiate at more wavelengths not intercepted by CO2: more stratospheric cooling. The gradient with the surface becomes enhanced.
In winter, it is difficult to establish the boundary between the troposphere and the stratosphere. Both interpenetrate. Ozone from above, water vapor from below. It is different on the equator.
Willis, take a look at the etymology of “heretic.” Do you realize that it is:
Latin from Greek hairetikos ‘able to choose’
TIL, thanks.
w.
Thanks for the good work, Willis! Bob Tisdale’s (https://bobtisdale.wordpress.com/) extensive ENSO discussions leads one to a similar place. I recommend his books to everybody – most are free. Please donate to support his ongoing work.
Bravo! This isn’t heresy, this is science.
Thank you very much.
Heres an idea Willis.
Why not stop using the false marxist term greenhouse gases, and instead use the correct terms of either condensing gases or optically active gases, you know go all 20th century modern science on their asses..
Willis,
Again a great post. The ability to communicate a complex subject clearly and effectively is a gift. The gift is revealed by the reaction elicited. You consistently push the debate towards physical reality and the pursuit of underlying truths. Thank you.
A very long comment I know, apologies but I though some might find it of interest
I repeatedly hear comments from warmists that if there were no greenhouse gases in the atmosphere the earth would be 33C colder than it is at present. That comment makes me very angry because it is utter bunk. Any half way competent scientist MUST know this so saying it is a clear act of deceit . Consider;
Earth’s atmosphere generates mechanical energy. It raises water to high altitudes powering hydroelectric generators, while wind can blow down trees and buildings, raise waves and drive wind turbines. So, where does this energy come from? Clearly from absorbed solar energy. That means earth’s surface and atmosphere is converting thermal energy into mechanical energy, the definition of a classic heat engine. Heat engines are governed by very well understood natural laws. A working fluid (in this case the atmosphere) cycles between a hot junction (where heat enters the system and is injected into the working fluid) and a separate cold junction (where heat is extracted from the working fluid and leaves the system). The maximum efficiency possible is the carnot efficiency ((Thot-Tcold)/Thot). Typically the hot junction is the hottest point in the system and the cold junction is the coldest point in the system.
In the case of earth, the hot junction is clearly earths’s surface and especially the surface in the tropics but where is the cold junction? There are 2 candidates, the first is the tropopause and the second is the poles. However the working fluid has to cycle between the hot and cold junction and because the earth is a rotating sphere the atmosphere rising at the equator cannot get to the poles. Firstly air rising at the equator is moving at the speed of earth’s surface 1600 km/hour but as it tries to move towards the poles the radius of rotation of the surface and thus the surface velocity is reducing. The equatorial air, moving faster, is thrown outwards in the plane of rotation. That can be resolved into an outward force normal to Earth’s surface and a force tangential to the surface pushing the air back towards the equator. It is why we do not have an equator to pole circulation but instead 3 coupled circulations – the Hadley cell, the Ferrel cell and the Polar cell. The second reason is that even if the equatorial air could get to the pole it would have to descend to transfer heat energy to the surface but if the pole is the cold junction by definition the pole would be colder than the descending air so there would be a temperature inversion inhibiting the air from falling. The cold junction of our climate heat engine is the tropopause not the poles.
Given the cold junction is the tropopause, heat energy must be leaving the working fluid to space (ie the atmosphere) at this point and that is only possible by radiation. However, by definition a gas capable of radiating thermal infrared radiation is a green house gas. If there are no green house gases the tropopause cannot radiate energy so a necessary requirement for a heat engine is not met. In practical terms, the rising air cannot cool so it cannot lose energy which it needs to do in order to descend again. Thus convection stops and with time the entire atmosphere becomes vertically isothermal. Water vapour cannot condense because it needs to lose energy to do so (lose energy to where?) thus no clouds would form. If there is no condensation there can also be no evaporation otherwise the oceans would end up in the sky, the entire atmosphere would become saturated with respect to water vapour. Without convection no dust would be raised and what was in the atmosphere would eventually settle out so the sky would probably not be blue but closer to black. There would be no clouds, no wind, no rain, no significant waves on water, a completely static vertically isothermal atmosphere. The temperature would vary with latitude according to the solar energy absorbed by the surface at that latitude. Given a near transparent atmosphere Earth’s albedo would be close to the surface reflectivity. That is 70% water with a reflectivity of about 0.04.
In near Earth space the solar energy intensity is 1370 watts/sqM. For the Earth as a whole the average solar energy at the surface is 1370/4 * (1- albedo) but at the equator it is 1370/pi *(1-albedo) which, in the absence of convection will be close to 430 watts/sqM- maybe around 400 watts/sqM. Applying the Stefan Boltzmann law gives a surface temperature of 290K or 17C. Worse however, during the day the peak energy reaches close to 1300 watts/sqM (at noon). The surface temperature will depend on the thermal time constant but if you think about how hot beach sand, exposed concrete, metal surfaces can get on a warm summers day that time constant can be quite short- well under 1 hour. Again from Stefan Boltzmann law the temperature of those surfaces could then get to 389K or 116C. The air over those surface would be heated and rise. Of course at night the surface cools considerably but that creates a temperature inversion precluding convection and in the absence of green house gases the hot atmosphere could only cool by conduction back to the surface. Conductive heat transfer in air is extremely slow, much slower than convection. The atmosphere would end up at an equilibrium temperature much closer to the noon surface temperature than the average temperature! At such temperatures and without any rainfall land life would be very unlikely to exist or endure. Ocean life could possibly still be OK.
Due to the day/night surface temperature variation there could still be some conductive heat transfer allowing dew to form at night and some corresponding evaporation during the day but the effect would be tiny and limited to only the air very close to the surface. Dew but no rain.
Of course, away from the equator the temperature would not be quite as extreme but even where I am at latitude 37 south, the temperature inside a closed car in summer, which heats up because convection is prevented, can and alas too often does kill children in minutes (60C+)!!! This is not conjecture or modelling it is sadly proven fact. Without convection, the entire environment at that latitude would be in the same position as a closed car.
Without greenhouse gases the earth would not be 33C colder. Much of the atmosphere and land mass would be far hotter at least in summer (60% of Earth’s surface area lies between latitude 37N and 37S). Temperatures which really would destroy life on Earth.
Very often, looking at an issue from a different perspective can give new illuminating insights. Looking at the atmosphere from the perspective of heat engine seems to be such a case.
Just a tip: leaving some space between the paragraphs makes the story [much] more readable.