
Many will be familiar with El Niño – the ocean-warming phenomenon that affects global weather patterns – but how about La Niña, which is linked to cooler sea temperatures?
According to the World Meteorological Organization (WMO), La Niña is back in the central and eastern equatorial Pacific Ocean, after nearly a decade’s absence.
This is expected to result in sea surface temperatures between two and three degrees Celsius cooler than average, said Dr. Maxx Dilley, Deputy Director in charge of Climate Services Department at WMO.
“These coolings of these large ocean areas have a significant effect on the circulation of the atmosphere that’s flowing over them. And the changes in the atmosphere in turn affect precipitation patterns around the world.”
Uneven effects
The likely results of La Niña vary around the globe, but indications are that the Horn of Africa will see below average rainfall, as will Central Asia.
Elsewhere, WMO’s weather models forecast above-average rainfall for Southeast Asia, some Pacific Islands and the northern region of South America.
The UN agency also warned that East Africa is forecast to see drier than usual conditions, which together with the existing impacts of the desert locust invasion, may add to regional food insecurity.
WMO says that there is a 90 per cent chance of tropical Pacific sea surface temperatures remaining at La Niña levels for the remainder of the year, and a 55 per cent chance that this will continue through March next year.
This is important because La Niña contributes to temperatures, rainfall and storm patterns in many parts of the world.
The function of the system is Her, not her, Choice, thus the existence of chaos (e.g. “evolution”, life) outside of a limited frame of reference.
No La Niña developed after Super El Niño of 2015-16, as after prior Super El Niño of 1997-98. Strong El Niño of 2019-20, which will probably make 2020 the second or third warmest in the UAH satellite record, has now however been followed by La Niña, increasing the likelihood of a cooler 2021.
In that case, the global cooling trend since February 2016 will continue. How many years must a downtrend persist, without a higher anomaly month or year, before the global warming hounds are called off?
It has been 43 years since PDO flip of 1977 iniciated the late 20th century warming cycle. Will it take 43 years of cooling to convince the Catastrophic Anthropogenic Climate Change Alarmist mafia that they’ve lost? Eighteen years of “Pause” after 1997-98 Super El Niño didn’t do it, but cracks were starting to appear and lame excuses being bruited.
It generally takes around 20-25 years of statistically anomalous cooling trends for Climate Science De-Jour media reporters to declare “Ice Age Commeth”
“Change Alarmist mafia that they’ve lost? Eighteen years of “Pause” after 1997-98 Super El Niño didn’t do it, but cracks were starting to appear and lame excuses being bruited.”
And then temperatures resumed the upward trend.
Except that they haven’t done so. The “Pause” ended with another Super El Niño in 2015-16, but since then, the cooling trend of 1998-2014 has resumed and accelerated.
The temperature downtrend since February 2016 is set to accelerate in coming months, if not years.
John Tillman, please help because I’m getting really confused. I keep hearing (just again today) that 2020 might be the warmest year on record. If there’s actually a downward trend, why are there reports of warmest year? Would it be related to adjustments being made to the temperature record? But then on the other hand, I clicked on a link to “Carbon Brief” on a different WUWT comment thread, and if I understood that article correctly, it’s saying that adjusting the temperature record actually shows slower warming than the raw data. (I read the article quickly, and need to read again. Thanks for your help.
This year won’t be the warmest in the UAH satellite record, but possibly #2, the reason being another strong El Niño in 2019-20 after 2015-16 Super El Niño, without strong intervening La Niña.
Adjustments to and methodology of so-called “surface” record are criminal, but I’m going with the UAH satellite record, which is honest.
Earth has been warming since depths of the Little Ice Age during the Maunder Minimum. So far nothing out of the natrual norm has occurred, due to human CO2 emissions.
Thanks John.
You’re welcome!
“And then temperatures resumed the upward trend.”
From another SOLAR FORCED El Nino.. ie 100% NATURAL
CO2 does not and cannot cause El Nino.
1… Do you have any empirical scientific evidence for warming by atmospheric CO2?
2… In what ways has the global climate changed in the last 50 years , that can be scientifically proven to be of human causation?
No, they didn’t.
There was a warming blip associated with 2015-16 Super El Niño, but since then, the cooling trend has returned.
Despite strong 2019-20 El Niño, the temperature downtrend since Feb 2016 remains intact. It will deepen next year.
“In that case, the global cooling trend since February 2016 will continue. How many years must a downtrend persist, without a higher anomaly month or year, before the global warming hounds are called off?”
1. probably 25 years depending on the amount of cooling and of course the cause.
In the other case, the global warming trend since 1850 will continue. How many years must a upward trend persist before the global cooling hounds are called off?
A: 300
Thermopylae 2.0, The Redux.
https://en.wikipedia.org/wiki/Battle_of_Thermopylae
The entry to the Roman Warm Period.
It was a glorious time to be a human after untold millennia of struggle by humanity.
The Roman Republic with senate, then Julius Cesar was killed by his own Senate his friend Brutus, to usher in a 400 yr Roman Empire of dictatorial Cesars.
Of course most of the Mosher ilk don’t get that historical repetition.
“the global warming trend since 1850 will continue”
So absolutely no human impact at all. (except by data manipulation)
Let’s all be VERY GLAD it didn’t go the other way, shall we.
I don’t think Mosh is saying “no human impact at all”
Anybody who thinks we don’t have an impact on the climate is barking up the wrong tree.
Ok, Can you name one scientifically provable impact humans have had on global climate.
1… Do you have any empirical scientific evidence for warming by atmospheric CO2?
2… In what ways has the global climate changed in the last 50 years , that can be scientifically proven to be of human causation?
You can answer, with measured scientific evidence….
or NOT.
Anyone who thinks we have had and influence on global climate, and cannot produce actual evidence.
…. is just barking.
Do we have an impact on the planet? Absolutely! Without doubt, without question. This is what the Enviro’s and their acolytes the alarmist warmunist’s are really barking about. You will occasionally interact with them and they will accidentally let their slip show by shifting in and out of the climate change discussion and referring to dirty pollution which is indeed man made but not CO2.
Redge, anyone older than 60 knows we were heading into the NIA ‘next Ice Age’ back in the 70’s before the climate shifted and then the UN set up the IPCC with marching orders to find an adverse link between man and the climate. They did as instructe, what they were paid to do. They created Dah da da daaaaahhhhhh. MAN MADE GLOBAL WARMING!
They formed Bureaucratic Climate Councils, complete with CO2 detector rings, and appointed False Prophet celebrities like Leoanardo DiCraprio who actually didn’t freeze to death and drown in the North Atlantic after making Kate Winslet promise to “GO ON” but rather procured a fleet of private jets to fly around the world scolding the great unwashed on how evil the burning of fossil fuel to be.
They employed lab assistants like ALGORE, Igore’s 7th cousin removed from Ingolstadt Germany and transplanted to Tennessee, to star in badly doctored documentaries that gave us the “Hockey Stick Graph” but failed the settled science tests in British Courts. Like DiCraprio, ALGOREs carbon footprint is orders of magnitude greater than the average family of 4.
Yes Redge we humans pollute the planet but we aren’t inadvertently creating an invisible shield to hold in heat by improving life through fossil fuels. No matter how many times the NYTimes and CNN tells us so. These Propagandists are the same carnival barkers that gave us the revisionist and fictional “1619 Project” and Government as secular religion to be believed as when these politicians idiotically pronounce that they “believe in science.” as if the confers some omnipotence to whatever hypothesis they cook up e.g. You must wear a mask in the time of COVID aka the Communist Chinese Virus because they believe in science? And to not wear a mask makes you a Denier. Or worse a Trump Supporter. What!
We are no longer on a forced march to “1984” we are living it complete with Newspeak nonsense like: “Settled Science”, “Scientific Debate is Over”, 97% Consensus Science”, “Climate Denial”, Yada, yada, yada all because a bunch of bureaucrats have decreed that pollution is CO2 and that invisible greenhouse shield is warming a planet the cools and warms all thanks to very complex planetary physics and without human interference thank you very much.
Fred, @1:07 am
I didn’t mention “global”.
I’m thinking deforestation, large cities etc, all of which change the climate locally. Wind turbines change the local climate.
So yes, we do have an impact on the climate.
However, is there a “global” climate? Is there such a thing as “average temperature”?
I don’t need to answer the rest of your post, because I agree with you.
Yes Redge, there is no doubt we can have effects of local WEATHER.
That is not GLOBAL climate.
Mosh has a point.
Are we warming or cooling or neither, it’s just the earth doing what the earth does?
Warming, THANK GOODNESS !
The opposite, from the coldest period in 10,000 years, ..
…. would not have been good for human survival.
Sometime I think these AGW alarmist would have preferred the planet dropped down into another proper Ice Age, rather than the gentle warming we have been so fortunate to have.
1850…coming out of a mini ice age cause by the SUN and the global temperatures started rising back to warmer temperatures. WOW, who would have thought. Genius
“Steven Mosher November 1, 2020 at 8:35 pm
In the other case, the global warming trend since 1850 will continue.”
A most laughable statement. How many devices GLOBALLY were installed MEASURING temperatures in 1850?
What devices they did have, show a strong warming to 1940, then cooling , then warming.
All that has been adjusted out now, to suit the global warming scam.
The devices that were installed were installed in cities. There were none in rural areas or even in the oceans. So I would put that variance down to UHIE.
“In the other case, the global warming trend since 1850 will continue.”
The global warming trend since 1850 is a figment of your imagination.
Real temperature readings from around the world (regional temperature charts) show it has not warmed since the Early Twentieth Century (ETC).
The computer-generated temperature chart you go by, the Bogus, Bastardized Modern-era Hockey Stick chart, is a Big Lie. It doesn’t match any real regional temperature chart reading. It was created to promote the Human-caused Climate Change scam and does not represent reality.
Here’s the real temperture profile of the Earth, the US surface temperature chart (on the left of the webpage link)
http://www.giss.nasa.gov/research/briefs/hansen_07/
where the ETC warming shows to be just as warm as it is today. All regional surface temperature charts from around the world (real temperature readings) have a similar temperature profile showing it was just as warm in the ETC as it is today.
And on the right in the webpage is the Bogus, Bastardized Modern-era, computer-generated Hockey Stick chart, whose temperature profile (hotter and hotter and hotter) does not resemble any regional surface temperature chart, as it erases the warmth of the ETC and turns it into insignificance, which was a requirement in order to be able to sell the Human-caused Climate Change scam and fool people into believing it was getting hotter and hotter for decade after decade and is now at the hottest temperatures in human history. But, if it’s not any warmer today than in the recent past, then that blows up the claim that CO2 is causing temperatures to rise because temperatures have not risen above 1934 levels even though much more CO2 has been pumped into the atmosphere since that time.
It’s not getting hotter and hotter. There is no unprecedented warming today. It is no warmer today than it was in the 1930’s. That’s what Hockey Stick proponents don’t want you to know. If you knew that, then you would question all the Alarmists’ claims, and they can’t stand up to scutiny.
It’s all a scam. The Alarmists ignore the regional temperature charts and want you to ignore them too, because they can’t explain the discrepancy between the regional temperature charts, which show no warming since the ETC, and the bogus Hockey Stick chart, which shows unprecedented warming.
Any alarmist is welcome to try to explain this discrepancy. In fact, you are encouraged to do so.
http://www.giss.nasa.gov/research/briefs/hansen_07/
Look at the US surface temperature chart on the webpage. Draw an imginary line from the highpoint in the temperature record (1934, in this case) to the highpoint of 1998. Now, obviously, you have just drawn a downtrend line as 1934, was 05C warmer than 1998. Now consider that the year 2016 (not on this chart), NOAA’s “Hottest Year Evah!” is just one-tenth of a degree warmer than 1998 (a statistical tie), so the year 2016 also falls on that downtrend line you drew in your head. Obviously, the United States has been in a temperature downtrend since the 1930’s, and that downtrend continues to this very day.
Regional surface temperature charts show the very same downtrend. The “unprecedented” warming the Alarmists talk about, as embodied by the Hockey Stick chart, is an illusion. The unprecedented warming they are talking about is shortterm (1980 to 2016), and never exceeds the previous highs of the 1930’s.
There is no unprecedented warming today. Which means CO2 is not the control knob of the Earth’s atmosphere. Which means we can move on to other things than worrying about regulating CO2.
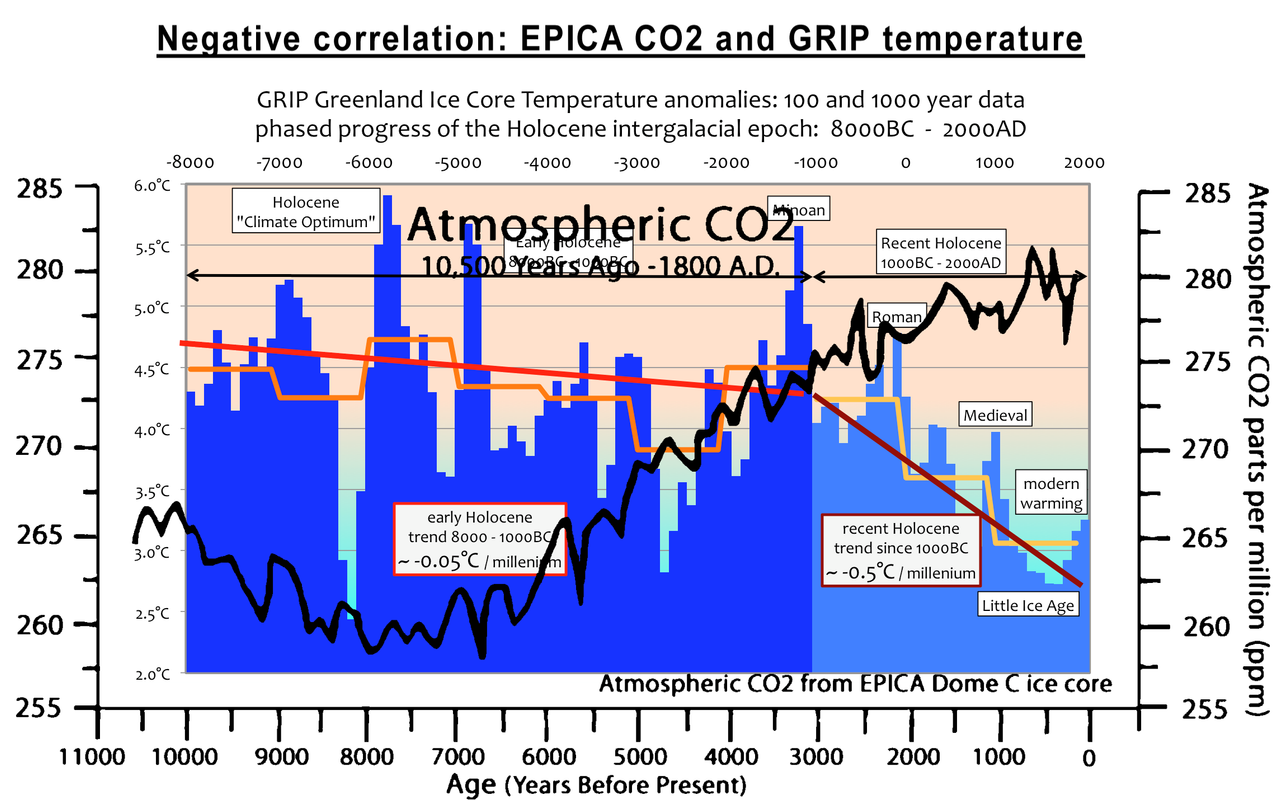
The Modern Warming Period began c. AD 1850. Like all such centennial-scale secular warming and cooling intervals, it’s broken by multidecadal countertrend cycles.
The Modern Warming should last about as long as the Egyptian (~4 ka), Minoan (~3 ka), Roman (~2 ka) and Medieval (~1 ka) Warm Periods, which have occurred at roughly millennial intervals since the Holocene Clinate Optimum, c. 5000 years ago, with secular cool periods in between.
So sustained, dangerous global cooling is still probably a few hundred years off, but we are due for a countertrend cooling cycle, as during the 1940s to 1977, despite rising CO2.
“The UN agency also warned that East Africa is forecast to see drier than usual conditions, which together with the existing impacts of the desert locust invasion, may add to regional food insecurity.”
Let’s cover all bases:
East Africa rainfall equals locusts – bad result
East Africa drought equals crop failure – bad result.
In the meantime maybe a bit less rain in eastern Kenya above Lake Turkana will be welcomed (or is that not in East Africa?)
STATEMENT ON THE IMPENDING SPILL-OVER OF TURKWEL DAM AND RISING LEVELS OF LAKE TURKANA
Am I right in thinking that every time there’s a strong El Nino, that the global temperature takes a step increase and then there’s a hiatus until the next strong El Nino? Could we expect that a strong La Nina would cause a step decrease in the global temperature?
Strong Las Niñas occurred in 2000, 2008 and 2011:
http://www.drroyspencer.com/wp-content/uploads/UAH_LT_1979_thru_September_2020_v6.jpg
The period 2009-10 was ENSO neutral and there was a sharp spike in temps, this is a worry.
Apologies, my bad, 2009-10 was El Nino.
With a medium La Nina either side of it.
Had no persistent warming effect like the 1978/9 and 1998/9 and now the 2015/16/17 El Ninos did.
The global temperature change caused by the Southern Oscillation – El Nino/La Nina is net zero – its an oscillation. There is noise overlaying a rising trend.
The ONLY rise in atmospheric temperature has come at El Nino events.
There has been no La Nina for some 10-12 years, certainly not a strong one, and they produce gradual cooling, not big lingering surges of delayed solar charged warming.
Do you have any empirical evidence that these natural cycles and the highly beneficial warming since the LIA had any human causation ?
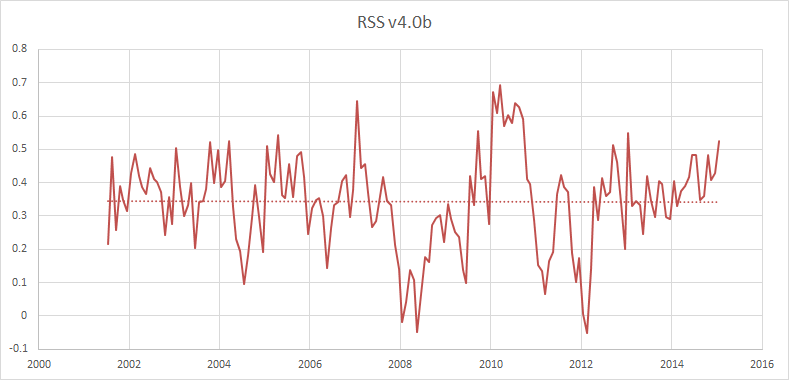
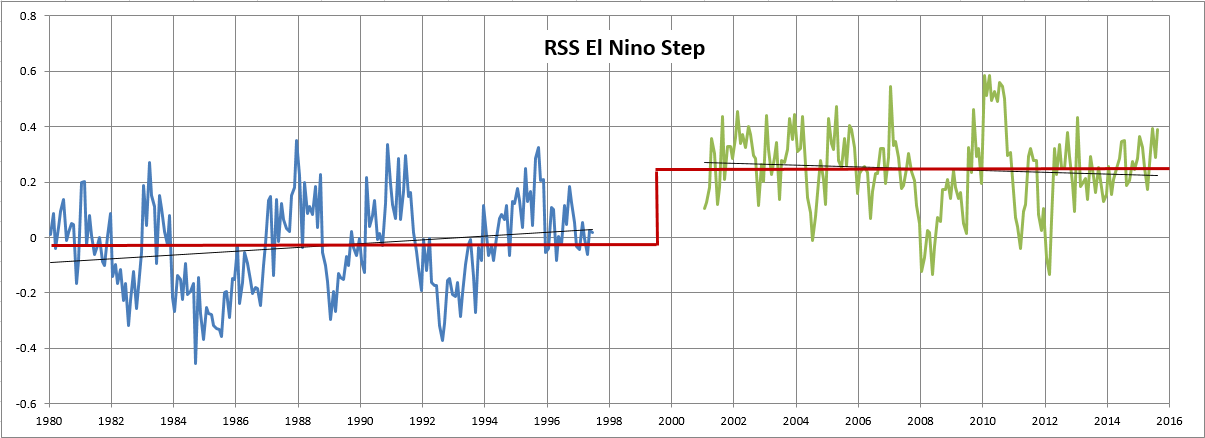
Step changes after Super El Niño events are plainly evident.
No statistically significant warming occurred after the 1997-98 event until 2015-16 SEN, rather statistially insignificant cooling in UAH record.
If you remove the long term trend your imaginary steps vanish altogether leaving random oscillations up and down. Oscillations, surprise surprise, that are remarkable well correlated with the SO and the IOD and seasonal fluctuations, etc. That is why it’s called the Southern Oscillation, the oscillations are “plainly evident”.
So-called “steps” is just a distraction from the trend. Now why would you want to do that?
No, they don’t.
I want to do it because I know how to do statistical analysis. Only an ideologically motivated “analyst” would fail to do so.
But if you want to ignore detailed trend analysis, then the long-term trend since the Minoan Warm Period is still intact, ie over 3000 years of catastrophic cooling.
“So-called “steps” is just a distraction from the trend.
WRONG as always Loy !
The steps CAUSE the warming trend
Between those El Nino events, THERE IS NO WARMING
No warming from 1980-1997
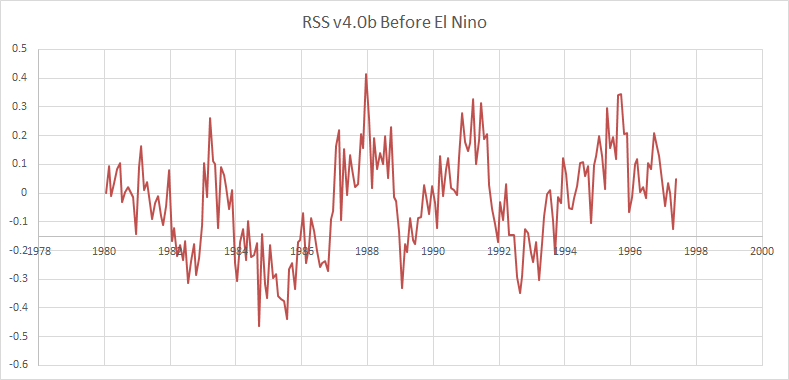
No Warming from 2001 – 2015
I know basic comprehension is REALLY hard for you, but do at least try !!
‘So-called “steps” is just a distraction from the trend.’
Yes, that is the general consensus, but when the PDO and AMO are negative the rising trend will evaporate.
Adding weight to my argument, when the PDO went negative we had the hiatus, so when these large ocean oscillations are both negative, world temperatures will fall.
Global cooling has begun.
“that is the general consensus,”
Yes, the El Nino steps do distract from the general trend
They are always used to CREATE a warming trend that doesn’t exist without them.
So let’s remove the approx 0.3ºC effect of the 1998 El Nino, shall we…
1988 El Nino spike removed
El Nino step removed
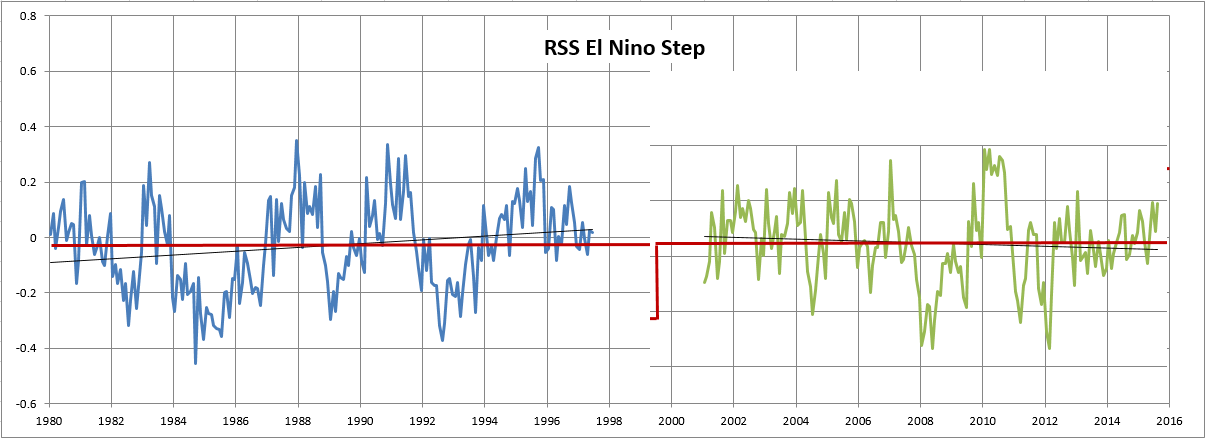
Loydo is right. The affect is net zero increase. Much like the tide has no affect on rising (or lowering) sea levels. What is significant is that the El Nino and La Nina peaks seem to be higher each time (or certainly in an upward trend)… which is what you would expect to happen in a warming world.
Again, your ignorance as to the effects of El Nino and La Nina shines through
El Ninos are a sudden release of energy, (which cannot come from atmospheric CO2)
La Nina is a slow cooling event
The only warming in the satellite era has come from the two major El Nino events
Between those events, there has been NO WARMING.
When the SUN has been at a sustained high peak.. you would expect more energy into the tropical ocean, and thus more El Nino than La Nina.
There is absolutely ZERO EVIDENCE that El Ninos have any human causation.
They are PURELY NATURAL
1… Do you have any empirical scientific evidence for warming by atmospheric CO2?
2… In what ways has the global climate changed in the last 50 years , that can be scientifically proven to be of human causation?
Fred
“There is absolutely ZERO EVIDENCE that El Ninos have any human causation. They are PURELY NATURAL”
It’s a crazy world, but we agree, they are purely natural and have nothing to do with the recent warming.
and have nothing to do with the recent warming.
LOL , you are like a monkey with it hands over its eyes.

The ONLY warming has come from those El Ninos
Are you now saying there WASN’T a step up at the 1998 El Nino
It didn’t cause any warming.. REALLY ?? !!
Are you REALLY saying the 2015/16 didn’t cause a warming surge.
Wow, talk about DEEP DENIAL of what is in front of your eyes.
Fred
“The ONLY warming has come from those El Ninos”
Nope, the recent warming doesn’t come from the El Nino any more than seal level rise comes from the tide. If El Nino was the reason for the warming then we would continually warm, and be frying, because they are not a new thing. On the other hand if you truely believe you are right and everyone else is wrong, please provide a peer reviewed reference for your theory?
Simon makes a bizarre attempt to emulate Adam Sandler as Billy Madison
Fred
So no explanation, just more childish put downs? I take it you have no references for your theories?
OMG , the nonsense just keeps coming from simple simon.
A series of strong El Ninos, with only weak La Ninas between
NO WARMING AT ALL between those El Ninos,
Just a step each time, clearly visible is any un-tampered data
Close your eyes and wish it wasn’t there, its all you can do, simple one.
Live your little dream.
Sorry you are so LIMITED in science that you cannot provide ONE bit of evidence for anything except NATURAL warming.
1… Do you have any empirical scientific evidence for warming by atmospheric CO2?
2… In what ways has the global climate changed in the last 50 years , that can be scientifically proven to be of human causation?
We are all STILL WAITING.
You are still so EMPTY. !
“If El Nino was the reason for the warming then we would continually warm, and be frying”
LOL.. Isn’t that exactly what your AGW priests are trying to tell us is happening .
Now you are telling us that IT ISN’T HAPPENING.
You are one very confused little turnip !
But you have very efficiently told us, that if there is any warming, it is being caused by El Nino events…
… so glad we have reached an agreement. 🙂
Fred/Simon, I agree/disagree with both of you.
As Fred has indicated the warming correlates very well with the warming. However, that still leaves some questions on the mechanism. If the warm waters that led to the initial warming disappear, what causes the warming to persist for years? Fred indicated solar but the weak solar cycle of the last decade makes that a bit of a stretch.
As for Simon, while the mechanism may be unknown, just denying it is not a reasonable argument. It certainly is feasible and the correlation is very suggestive. But, like you, I think the real cause of the warming since the mid 90s is something different. You think it is AGW while I think it is the AMO on top of a small 400 year background warming out of the LIA.
The good news is we will hopefully get some help in understanding this situation as the current La Nina continues. Where we end up afterwards should be helpful. If we go right back to where we were in 2014-15 then it will be hard to argue El Nino had anything other than a short term effect. It will also mean the pause is back and AGW hasn’t led to any warming in over two decades.
Fred
So how do you explain where we are in relation to the current impending La Nina? Even your favoured Spencer graph says you are talking nonsense. We sit almost higher than the El Nino peak.
http://www.drroyspencer.com/wp-content/uploads/UAH_LT_1979_thru_October_2020_v6.jpg
“But you have very efficiently told us, that if there is any warming, it is being caused by El Nino events…
… so glad we have reached an agreement.”
I didn’t say that. Said quite the opposite. You are the one blaming El Nino steps.
So if all the recent is caused by El Nino steps, how do you explain using your “theory” that as we enter a La Nina phase we are nearly at record temps for the last 100 years?
“If the warm waters that led to the initial warming disappear, what causes the warming to persist for years?”
Warmer water spreads far and wide, it takes a long time to dissipate unless a strong La Nina cools it down.
The 2015 El Nino , with the Big Blob in NE Pacific had effects in the Arctic and Antarctic
Arctic atmospheric effect is only now subsiding
In the Antarctic , it caused a big drop in sea ice for one year, which has now recovered
Can’t help it if you can’t keep track of what you said.
We have had a series of strong El Ninos, with weaker La Ninas
The warming has come at those El Nino surges, without enough cooling between them.
Those EL Ninos have ZERO human causation …..
Now, instead of flapping about aimlessly in abject ignorance, try answering the questions….
1… Do you have any empirical scientific evidence for warming by atmospheric CO2?
2… In what ways has the global climate changed in the last 50 years , that can be scientifically proven to be of human causation?
“We sit almost higher than the El Nino peak.”
Been in El Nino territory for quite a while
Still a lot of solar energy reaching the tropics until only a decade ago
But feel free to ignore the SUN.
Its what you have to do to keep up your nonsense AGW posts, without providing any evidence at all of any human causation.
Fred
“1… Do you have any empirical scientific evidence for warming by atmospheric CO2?
2… In what ways has the global climate changed in the last 50 years , that can be scientifically proven to be of human causation?”
Answered both of these a while back. You know it is yawningly boring you continually asking the same questions and ignoring the answers. So, I will not bother to answer that again. I notice most others here ignore your ramblings on this to.
“Can’t help it if you can’t keep track of what you said.”
But you can try being honest and not misquoting me.
No simon, you did not provide any actual science AT ALL.
You have refused to do so.
All you manage is regurgitated mantra, based on nothing but modelled junk science
Now either answer the question , with proper scientific backing
…….. OR DON’T.
Stop trying to weasel your way out of it… its PATHETIC.
1… Do you have any empirical scientific evidence for warming by atmospheric CO2?
2… In what ways has the global climate changed in the last 50 years , that can be scientifically proven to be of human causation?
“So, I will not bother to answer that again.”
You NEVER have.
and you NEVER will.
Garbled garbage AGW mantra is NOT EVIDENCE.
Kapeesh !
If it was a nice well behaved waveform like a sine wave, you would be correct. It isn’t. There’s no good reason to assume that it is even a linear time-invariant function.
Which is what all the computer models finally boil down to several years in the future – a linear response of (mx+b). The only difference between the models is the value of “m”. And the value of “m” is baked into computer code.
No, as always, he’s not.
The oscillation isn’t a zero sum game because the critical input, it solar irradiance, isn’t a constant, especially in the high energy UV spectrum.
Show us your math Loydo. You, actually the voices in your head, can’t even keep up with stuff from 6 -10 years ago.
There’s been a rising trend. Whooo hooo Nobel Prize stuff.
If the trend is whooo hooo Nobel Prize stuff, what are the steps? Yin and yang fairies whispering to each other?
Poor loy d’oh drifts off even further into his ignorant little fantasy land.
You do know that El Ninos and La Ninas are PURELY NATURAL events,
Do you have any evidence otherwise.. ???
1… Do you have any empirical scientific evidence for warming by atmospheric CO2?
2… In what ways has the global climate changed in the last 50 years , that can be scientifically proven to be of human causation?
You can believe anything you want when show no data to support your point and on the occasions that you do show any data, by pasting a link, you get it wrong.
Same with Simon – show us the data that supports your assertions and your analysis of it.
I won’t hold my breath.
“There is noise overlaying a rising trend”
I agree. Loydo.
The issue is the cause, is it beneficial and do we need to do something about it if we can?
Personally, I think we are part of the rise, although nothing to do with CO2. I think the warmer temperatures will be generally beneficial, and I’d be concerned about the so-called solutions to constrain the temperatures if needed i.e. the law of unintended consequences.
Satellite data shows clearly that the warming occurs in steps at El Nino events.
Hence, no human influence
The surface temperature fabrication, on the other hand, is heavily infected by human influences of many different sorts.
The homogenisation, infilling, data adjustment, UHI effects etc etc destroy any meaningful information. It become just GIGO, like climate models.
.. just like pretending step changes are part of linear trend….
it destroys looking at what is actually happening.
Right on, so stop hyping the warming phase and adjusting the 35 years of “Ice Age Cometh” out of existence. I lived through all of the cool phase and a good swath of the 1930s-mid 40s warming phase which was warmer than we have now.
The late 1990s were comparable perhaps to the late 1930s in warmth (with no help from CO2 I would add), but that means the 20yrs before that were simply a recovery from the “Ice Age Cometh” (despite bigtime emissions of CO2). Then we went into nearly 2 decades of no warming at all (while CO2 was galloping upwards), a period virtually as long as the warming that caused so much hype.
Conclusion? That all means most of the warming experienced so far had occurred by the late 1930s when CO2 wasn’t a factor. WUWT?
CommieBob, that is one possibility. Another possibility is that the El Nino events create a lot of noise over a fairly long period of time allowing other factors some time to have an effect.
If you look at the 1997-98 El Nino you also see La Nina events before and after. This led to a period of 5-6 years of ups and downs. It turns out the AMO flipped just a little while before and it could be this was responsible for the step change.
The 2014-16 El Nino was followed closely by the 2018-20 El Nino. I’m not convinced there has been a step change this time. In fact, it appears the Tropics may just be starting to cool after the latest El Nino. It will take another 6-8 months for the current La Nina to play out. Then we should have some idea where we are at.
If we revert back to the 21st century baseline then I think that will be strong evidence that the AMO is the most important factor.
commieBob November 1, 2020 at 2:19 pm
Am I right in thinking that every time there’s a strong El Nino, that the global temperature takes a step increase and then there’s a hiatus until the next strong El Nino? Could we expect that a strong La Nina would cause a step decrease in the global temperature
____________________________________
commieBob, it’s not only the 6 years El Niño followed by 1 year La Niña cycle;
In fact that’s in cooperation with the 11,3 years of Sunspot cycles.
And as the IPCC has to confess
– climate is coupled system of nonlinear functions with chaotic behavior.
So we endure weather. Climate is the master.
And it appears that at the same time the current solar minimum is coming to its end, unless the October sunspot count rise, the largest in over two years, was another ‘dead cat bounce’.
It would mean that the SC24 minimum will fall short of the two longest minima in the last 200 years.
http://www.vukcevic.co.uk/SSN-3-minima.htm
La Nina ahead?
Well… maybe some should look at
(1) http://www.bom.gov.au/climate/ocean/outlooks/#tabs=Graphs®ion=NINO34
(2) http://ds.data.jma.go.jp/tcc/tcc/products/elnino/elmonout.html#fig2
(3) https://origin.cpc.ncep.noaa.gov/products/analysis_monitoring/ensostuff/ONI_v5.php
and compare these three infos with
(4)
before getting heavily disappointed in a few months…
Be patient! Your time will come.
J.-P. D.
If I remember well, the NOAA Prediction Center (2) predicted for now a strong El Niño, as did the PIKaderos around Schellnhuber.
Better change the name ?
You have to get warming at depth which is not yet present. Lower right of page. http://www.bom.gov.au/climate/enso/#tabs=Pacific-Ocean&pacific=Sea-sub–surface
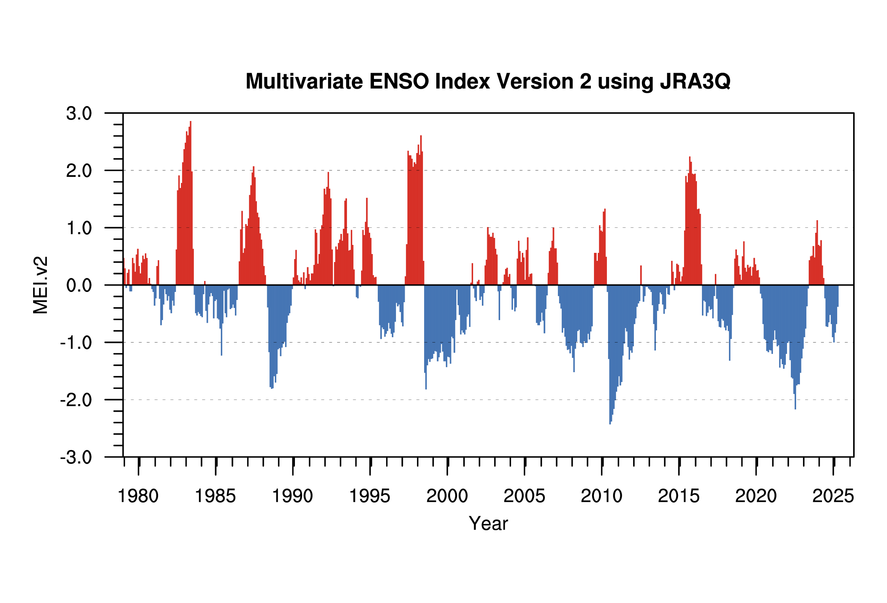
Version 2 of the MEI is unscientific. I can see why you reference it. It makes you feel good now.
The IPO is in a positive phase. There is no indication of a super La Nina. The rainfall in Queensland will likely be back to normal or slightly over but nothing like 2011 or 1974 when there were floods and deaths. The IPO period is about 30 years long.
“These coolings of these large ocean areas have a significant effect on the circulation of the atmosphere that’s flowing over them. And the changes in the atmosphere in turn affect precipitation patterns around the world.”
I’m still trying to wrap my head around the claim from climate alarmists that climate change is warming the oceans (if I understand them correctly). In the statement above we are told that the oceans (and La Nina in this case) affects the atmosphere and weather.
As a non-scientist, is there a bit of a contradiction here or am I missing something?
Southern Oscillation measurements are skin temperatures (even though the SO is apparent down a bit deeper) and being an oscillation the long term affect is a net zero. Small temperature fluctuations at the surface do have significant affects on the atmosphere, but compared to the depths, those thermal changes made to the air above are miniscule.
But because atmosphere is such a complex, finely balanced system, small temperature changes can have major affects on rainfall patterns and windshear patterns that affect hurricane formation for example. Meantime, away from that small oscillating surface patch, the trend almost linear.
Loydo, it’s “effect” and “minuscule”. Jeeez, and you a retired kindergarten teacher too.
…. but thanks for sharing your pearls of wisdom for the unwashed flyover deplorables.
No, thank CD for asking the question.
@Loydo:
I apologize Loydo, but when I asked the question I was not really looking for a reply from you. I should have mentioned that in the comment above, and I apologize for not doing so.
Although I am not one myself, it is my understanding that a scientist is one who challenges and questions a theory or hypothesis with skepticism until such time that the theory is proven beyond the shadow of a doubt. With all the scientific issues and problems surrounding the CO2-induced CAGW narrative that I have seen at this blog, it is apparent to me that the CO2-induced CAGW theory is far from proven.
I do not see the CAGW theory being given that kind of treated from you at this website, and that is why I preferred replies from the other scientists that frequent it. I do not know what your qualifications to answer the question were in the first place, and you do not need to provide them. I thank you anyway for replying, but please refrain from doing so in the future.
@philincalifornia: Exactly what is an “unwashed flyover deplorable?” Are you referring to me? I am just here trying to educate myself about the science behind the CAGW theory and participate in discussion when I can. That is all.
and you a retired kindergarten teacher too.
From the comments comment, more like a retired kindergarten student.
Great that you now ADMIT that these changes are TOTALLY NATURAL.
and that human CO2 has absolutely nothing to do with it
small steps, small steps
And so glad you see the TINY TINY amount of MODELLED ocean warming in the last 60 years
Let’s look at it in perspectives shall we..
See that little red squiggle. that’s your NATURAL ocean warming …
Do you have any scientific evidence whatsoever that it is anything but NATURAL ?
Where is the data used in that graph?
heat gains, very tiny that they those modelled gains are…
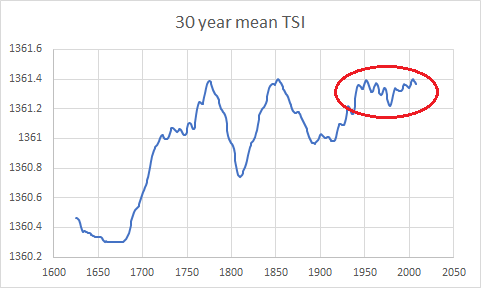
….. matched well with solar influence
thanks for that loy d’oh !
You do know that its the SUN that warms the oceans, don’t you !!
(with maybe a bit of geo warming)
Right fred with
“You do know that its the SUN that warms the oceans, don’t you !!”.
All day long the SUN warms the oceans. And where is the sun all nights.
Yes, you’re missing the difference between climate change and phony climate change.
Hi CD,
I’m surprised you don’t know the terminology for two out of those three (I added the unwashed part myself. It comes from unwashed masses, i.e. what elitists use to refer to people who haven’t quite reached the self-annontment of their elitism – think Hillary Clinton). Hillary also, in fact, was the one who coined the term deplorable which, apparently, was anyone not clever enough to vote for her, i.e. an unintelligent country hick. Great strategy – well she won the popular vote, ha ha.
I think Wisconsin may qualify as a flyover state – another elitist-driven derogatory term for people who live under the flight paths of the self-proclaimed intelligentsia nitwits who fly from Washington and New York to the West Coast.
…. and as for Loydo’s science, she complains that Fred posts a lot about her drivel, and he will keep posting until she answers his main question, which will be never, because she can’t come up with the data, because there isn’t any.
Let me just come out and say it
TALKING POINTS ARE DATA!
Whew glad this is off my chest
….. and SOMEBODY SAYS THERE”S SOME DATA, is much better quality data.
Am I the only one that gets annoyed at the use of ‘normal’, ‘average’, ‘usual’ and other similar terms being used as if they are to be expected and anything outside of these mathematical constructs is a disaster?
E.g. (from this article:
– La Niña, which is linked to cooler sea temperatures (in one area of the very large Pacific Ocean)
– cooler than average
– Horn of Africa will see below average rainfall
– above-average rainfall for Southeast Asia, some Pacific Islands and the northern region of South America
– East Africa is forecast to see drier than usual conditions
Even the IPCC recognise:
“The climate system is a coupled non-linear chaotic system, and therefore the long-term prediction of future exact climate states is not possible.”
16-17 and 17-18 had La Ninas. albeit weak
https://ggweather.com/enso/oni.htm
you can see both of them here by dragging over the year
https://maps.weatherbell.com/view/historical-ssts
http://www.drroyspencer.com/wp-content/uploads/UAH_LT_1979_thru_September_2020_v6.jpg
Steps or fluctuations or both Joseph?
You have USED those steps to fabricate a linear trend (a monkey can do that)
Thiose El Nino pulses are the ONLY WARMING in the satellite record.
Between those pulses, THERE IS NO WARMING
Now, how about providing some actually evidence that those El Ninos have any human causation whatsoever…..
Otherwise , you are telling us that they are TOTALLY NATURAL
1… Do you have ANY EVIDENCE that El Ninos are caused by humans?
2… Do you have any empirical scientific evidence for warming by atmospheric CO2?
3… In what ways has the global climate changed in the last 50 years , that can be scientifically proven to be of human causation?
OK, I should have said no strong or even average Las Niñas.
Mea culpa, mea maxima culpa.
The point is, nothing like the major La Niña after 1997-98’s Super El Niño.
The La Nina with the 6 months previous solar minimum has set up North America for a see-saw Meridional weather pattern through NH winter 2020-2021. Buckle up.
https://www.cpc.ncep.noaa.gov/products/predictions/610day/index.php
Well I guess California and the Pacific NW get no relief.
Cold and dry… until February.
Then it’s Katy bar the door, and get the canoe ready.
And strong winds coming ashore.
Strong offshore winds to Cal-Oregon-Washington in February and March will bring the Pineapple Express about 4 cycles. The 3rd will be the worst.
So like I said, “Katy bar the door!”
Willis and Anthony – get your Calic-chic galoshes ready for February and March.
”Meantime, away from that small oscillating surface patch, the trend almost linear.”
OFFS. What is a ”trend”? The atmospheric temps in 1958 and 2002 were precisely the same with a dip in the middle. Up down, up down.
There is such a thing as oscillations within oscillations within oscillations within oscillations. You do realize that right? Taking any 2 short points in time in isolation and trying to extract a trend is next to meaningless.
What are you so concerned about anyway?
He’s concerned that taxes will not be raised to solve the crisis. That’s always the concern.
Solar variations affect the balance between El Ninos and La Ninas but it takes at least two solar cycles for the effect to become apparent.
A less active sun produces larger, longer La Ninas which then produce downward stepping in global temperatures.
A more active sun results in the opposite process.
It would only be a net zero process across maybe 1000 years as per observations of past climate variability with an underlying downward trend since the Holocene Optimum.
What is a ”trend”?
The tiny surface temperature flucuations like the SO, are almost invisible compared to the larger-by-magnitudes oceanic thermal change.
But, you want to know what a trend is?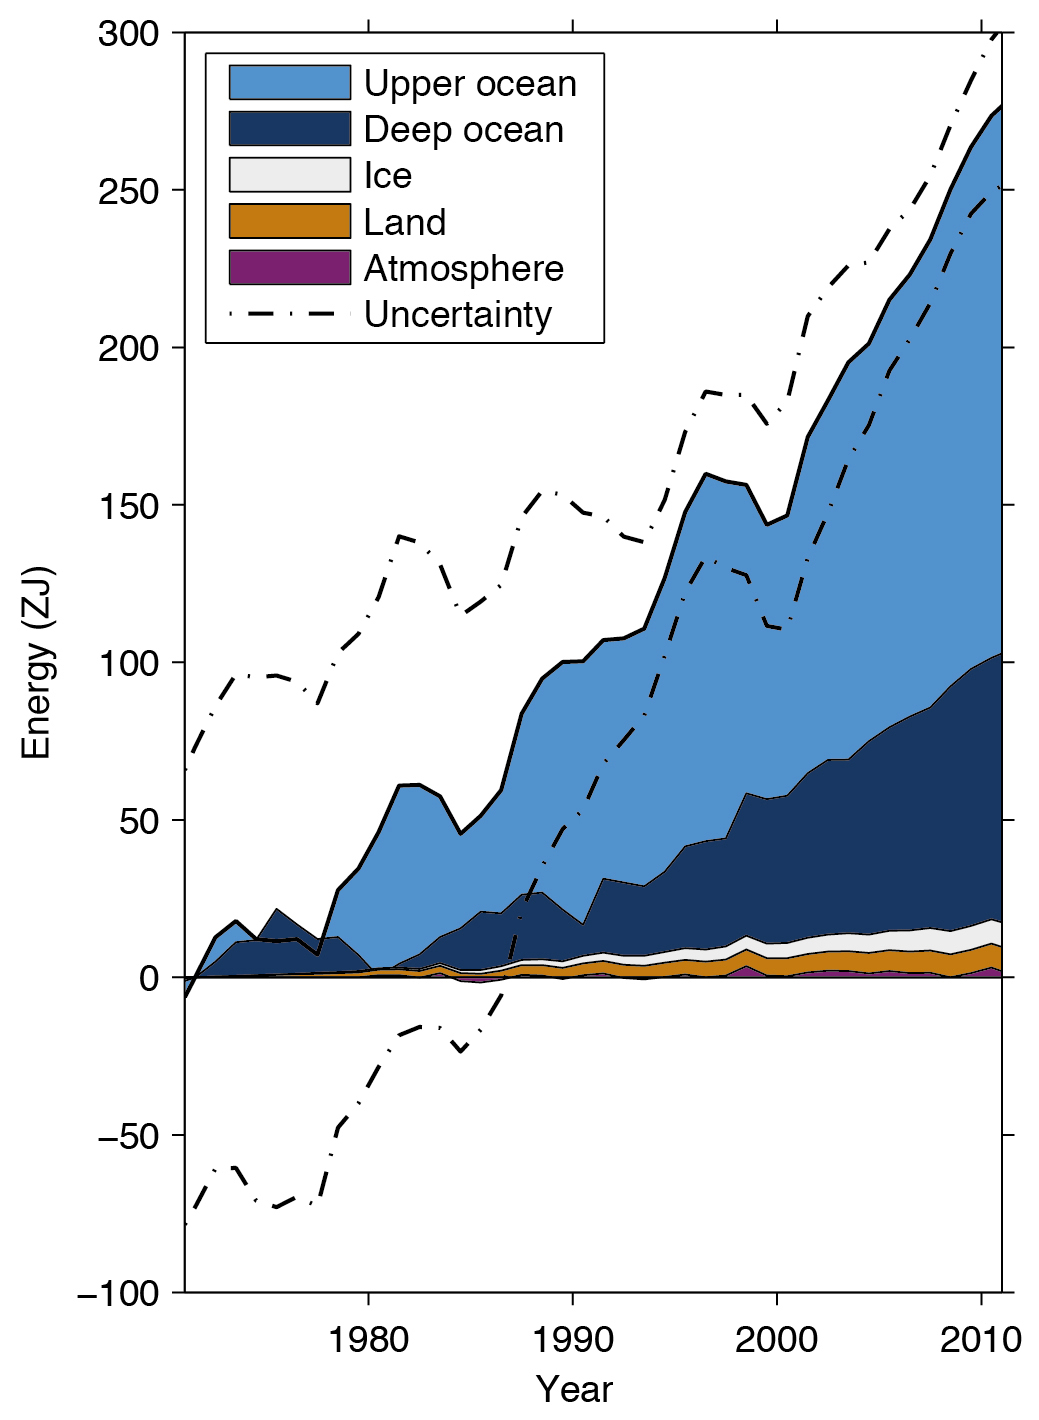
Notice the atmosphere. Notice the SO. Notice the uncertainty. Notice how most the heat rise is in the shallows. Think that trend is going change any time soon? If the strength and relentlessnees of that trend is NOT concerning then sorry, you’ve lost all sense of curiosity and boy are you in for some nasty surprises.
“he larger-by-magnitudes oceanic thermal change.”
Oh dearlie me.. big numbers really aren’t your thing, are they little bot
Its a TINY amount of ocean warming, MODELLED, not measured
And its totally insignificant in the scheme of things
Now do you have ANY EVIDENCE AT ALL that this TINY amount of warming out of the COLDEST period in 10,000 years, was cause by anything to do with humans. !?
So far you are totally EMPTY of any actual evidence for human causation of this highly beneficial. warming
Now all you have to do is INVENT some fantasy zero-evidence mechanism by which humans cause warming in the deep oceans.
This will be HILARIOUS. ! 🙂
It’s the Starship Enterprise beaming heat into the deep oceans with their transporter. It makes as much sense as any other crackpot theory.
Something is being lost in the ad hominems in the many comments above.
It seems most agree there is a long term rising temperature trend, at least since about 1700. Interestingly that is set against an even longer cooling trend over the last 4 thousand years or so. The cause of neither of these long trends is hardly the stuff of “settled science”. Probably some combination of orbital variation, solar activity, or precession of the Earth’s axis of rotation vs ??
Then we have shorter trends that look like oscillations: 60yr (PDO?) and shorter term, more erratic (El Niño/La Niña). All these trends superimposed and in any short interval difficult to tease apart.
And then the issue of rising CO2, man-caused vs only a natural slow, delayed response to the warming to some extent.
If we are in a secular warming period since the Little Ice Age, and then have periods of heat release (ElNiño) followed by periods of heat retention (La Niña) a stepwise pattern would result naturally. That does not mean the the El Niño’s are causing the warming. They are just delivering the heat into the air from the seas so that it becomes more manifest.
Looking for a CO2 signal in all this must be frustrating for the true believers. A large CO2 signal, essential to their warnings that the end is nigh for all us carbon sinners, just doesn’t seem to be there.
I am hoping for a nice long La Niña with cooling back to the “Pause” baseline, so that we can all cool it for a while and I can enjoy my old SUV.
”It seems most agree there is a long term rising temperature trend, at least since about 1700. Interestingly that is set against an even longer cooling trend over the last 4 thousand years or so.”
So please explain which ”trend” overrides the other . It can’t be cooling and warming at the same time….. The smaller/shorter the ”trend” the less significance therefore the less attention should be paid.
”But, you want to know what a trend is? ”
”
Yes well obviously a trend is what you say it is right?
“A less active sun produces larger, longer La Ninas…”
More like there is very weak and disputable correlation.
As opposed to the anti-correlation of atmospheric temperature and CO2
…. and the ZERO measured or observed effect of CO2 !
Still waiting….. yawn…..
1… Do you have any empirical scientific evidence for warming by atmospheric CO2?
2… In what ways has the global climate changed in the last 50 years , that can be scientifically proven to be of human causation?
“This is expected to result in sea surface temperatures between two and three degrees Celsius cooler than average, said Dr. Maxx Dilley, Deputy Director in charge of Climate Services Department at WMO.””
–
So does the sun heat the earth or do the oceans heat the earth?
–
A cold and long winter predicted in large parts of Europe.. and probably in the USA as well
How many people would PREFER and ENJOY a nice mild winter !
I know loy and griff will be happy that people are freezing their butts off !
https://notrickszone.com/2020/10/31/bureau-of-meteorology-central-eastern-tropical-pacific-coolest-since-la-nina-event-since-2012/
I have come to the conclusion a while back there is no such thing as Normal in climate or weather. One can formulate a mathematical Average of certain measured parameters but these are essentially useless to anything outside of a model.
Claiming there is Normal weather in Texas is like claiming there is a Normal outcome on a roulette wheel. Sometimes you win and mostly you lose, and you can invent all sorts of beliefs to try and explain or predict it, but it all boils down to chance.
If I remember right we got less rain after the El Nino of 1998 – sigh. I prefer the cooler wetter summers here. I hope the pattern does not repeat itself. Betting on…Black 33!
ROFL! When someone can show me the “global average location” on the globe in my office then I’ll believe the “global average temperature” actually means something.
This.
The whole CAGW scare is founded on the myth of a global temperature. Anyone with training in Engineering or Physics will tell you that an intensive variable like temperature CANNOT be averaged.
“an intensive variable like temperature CANNOT be averaged”
Graeme,
It is worse that that, they also average solar irradiance over the full period of 24 hours, so that the power of the sunlight is made too weak to heat the surface of the Earth to ambient temperature.
So next time you are out at night and you feel the balmy warmth of the air around you, remember it is the dark light of the climate sun shining in the black night above that is keeping you toasty warm.
“It is worse that that, they also average solar irradiance over the full period of 24 hours”
The fact that the tropical oceans get the brunt of that solar energy, which has been at a high level for a few decades,
… and it is the tropical oceans that have provided the only warming in the satellite era, via a series of strong El Ninos events,
… seems to allude their tiny minds.
I wonder how that “average TSI” they spread out all over the globe heats metal in the sun to an untouchable temperature.
Or melts tar on roads in mid summer.
Or makes sand on a beach actually cuase burn blisters..
Must be a new strange kind of physics. 😉
Game, set and match to Robert and all of you who see the the abject nonsense of “global climate”, “global temperature”, “global sea level” etc for exactly what they are – constructs with no physical connections to anything, so not worth wasting brain time on.
The 2015/16 Super El Niño ended the 19-year (mid-1996 to mid 2015) global warming hiatus, which was to be expected since Super El Niños occur every 15~18 years.
Since 2010, there hasn’t been a strong La Niña cycle to offset the 2015/16 super El Niño global warming spike, however, the current very cold La Niña cycle will finally do so.
The South Atlantic and South Pacific also showing significant cooling, which may mean the next PDO and AMO 30-year cool cycles will start soon.
According to the idiotic CAGW model projections, global temp anomalies should now be at around +1.2C and increasing at a trend of 0.3C/decade, which isn’t even close to reality.
Sometime in 2021, the UAH 6.0 global temp anomaly will likely hit -0.2C from the La Niña cooling, at which point, CAGW advocates will have to explain why actual global warming trends (0.14C/decade or less) are so far below CAGW’s model trend projections (0.3C/decade).
81 posts 23 are Freds, wtf? He needs to be reigned for his own mental well-being…
In contrast to your comments, they are of value 😀
+1
Poor Loy, still totally empty of any actual science.
Can count though.
If you didn’t keep making such idiotic evidence-free post,I wouldn’t need to counter them.
Now, try again… distraction and evasion are your only tactics
1… Do you have any empirical scientific evidence for warming by atmospheric CO2?
2… In what ways has the global climate changed in the last 50 years , that can be scientifically proven to be of human causation?
All Fred wants is a little evidence establishing that Human-caused Climate Change is real. He would probably be a lot less critical if you would provide some.
The fact that griff, loy and simon base everything they type on ignorant science-free AGW dogma/mantra, unbacked by any actual real scientific evidence, shows they are just trolling, seeking attention.
So I give them some attention, and they start complaining..
So Sad. ! 🙂
”81 posts 23 are Freds, wtf? He needs to be reigned for his own mental well-being…”
Loydo seems feel the little things are important – like counting posts or little trends in big trends. It’s kinda like if I went for a run and went back a few feet coz I dropped something, that trend has meaning.
A prediction does not really count unless it is made many years in the future – 18 years ago in this case, and one year before Theodor Landscheidt’s famous global cooling prediction. I dusted off the crystal ball and consulted the Ouija board, and see no reason to make changes to our 2002 global cooling prediction or my 2013 minor modification (see below) – “global cooling starting about 2020”. Bundle up.
I hope to be wrong, I’m getting old and hate the cold.
Caution: Global warming does not kill many people, but global cooling does. Let’s be safe out there.
Regards to all, Allan
___________________________
Allan MacRae published on September 1, 2002 in the Calgary Herald, based on a conversation with Dr. Tim Patterson:
3. “IF [AS WE BELIEVE] SOLAR ACTIVITY IS THE MAIN DRIVER OF SURFACE TEMPERATURE RATHER THAN CO2, WE SHOULD BEGIN THE NEXT COOLING PERIOD BY 2020 TO 2030.”
Allan MacRae modified his global cooling prediction in 2013:
3A. “I SUGGEST GLOBAL COOLING STARTS BY 2020 OR SOONER. BUNDLE UP.”
wattsupwiththat.com/2013/12/02/study-predicts-the-sun-is-headed-for-a-dalton-like-solar-minimum-around-2050/#comment-1147149
THE REAL CLIMATE CRISIS IS NOT GLOBAL WARMING, IT IS COOLING, AND IT MAY HAVE ALREADY STARTED
By Allan M.R. MacRae and Joseph D’Aleo, October 27, 2019
wattsupwiththat.com/2019/10/27/the-real-climate-crisis-is-not-global-warming-it-is-cooling-and-it-may-have-already-started/
Charles just a couple of observations, maybe you can explain. I am a sailor and talked to some sailors who had been to Tuvalu. They said you could see the high water mark “where the sea used to come” and that the ocean around there had actually gone down.
Second, there were lots of hurricanes on the east coast of the US this year but only one off Mexico or going towards Hawaii. Would this be a result of La Nina?
Thanks
My fav in that regard is the Great Pacific War between Chile on one side and Bolivia and Peru on the other.
I clicked on the “read the full article here” link and came to: U.N. News? Is that one of those oxymorons like “civil war” or “only choice”?
A better name would have been the Guano War.
ENSO Facts
El Nino Southern Oscillation is an oscillation. Its magnitude can be highly variable, with a total range of up to 5 C, while its periodicity tends to be relatively stable at about 3.5 to 4 years.
ENSO interacts with Global Atmospheric Temperatures (GAT) via two separate pathways.
1. The first pathway is energy transfer to the atmosphere via convective heat transfer and, more importantly, mass transfer (i.e. the transport of water vapor, and its energy of evaporation) from the waters of the tropical pacific directly to the atmosphere. GATs respond with an amplitude of about 10% of ENSO and a lag of about 4 months. This pathway causes well-known short term perturbations in GATs (and weather).
2. The second pathway is via advection, or the transport of the tropical pacific waters, via ocean currents, throughout the world’s oceans, and the subsequent (i.e. indirect) energy transfer to the atmosphere via convective heat and mass transfer. This pathway is an order of magnitude slower than the first, with lag times of more than half a decade, while the magnitude of the increases in ocean temperatures on a global scale is also attenuated by almost an order of magnitude from ENSO.
The increase in GATs resulting from this pathway is on a one to one basis with the increase in global ocean temperatures, but, with a lag of more than half a decade and an effect that can last a couple of decades. This pathway is responsible for what Tisdale and others refer to as the ‘permanent’ effect of ENSO on GATs.
To effectively evaluate the effects of ENSO on GATs, it is necessary to treat these two pathways of ENSO as two separate forcings.
In addition to the 3.5 to 4 year ENSO periodicity there is also an approximately 70 to 80 year oscillation. This oscillation can be seen when ENSO is averaged over longer periods, (ex. a 10 year moving average) and is also seen in oscillating global ocean temperatures, for example the AMO (Atlantic Multi-decadal oscillation). This longer term oscillation in the ‘back-ground’ ocean temperatures has a magnitude of about 0,5C. Since 1880 there have been almost two complete cycles of this long term oscillation. As of today, the transition away from the warm phase of this second cycle (since 1880) has not yet started, however the current strong La Nina may signal its beginning.
It is the transition, 1970 to 2000, from the cold phase to the warm phase of this long term oscillation in ENSO that has driven the increase in GATs, of more than 0.5C, and the pause at the higher temperatures, since 2000 consistent with the warm phase of this cycle, that has come to be known as ‘Global Warming’.
“El Nino Southern Oscillation is an oscillation. Its magnitude can be highly variable, with a total range of up to 5 C, while its periodicity tends to be relatively stable at about 3.5 to 4 years.”
CORRECT!!! … …AND:
The approximate 9-12 month lag of atmospheric CO2 changes after temperature changes is a direct result of the ~stable ENSO period of ~3-4 years. The CO2 lag is ~1/4 cycle of the ENSO period – basic calculus of the derivative vs its integral – as documented in my 2019 paper, below.
Question: IF increasing atmospheric CO2 is supposed to drive global warming, how is it that CO2 changes do not lead temperature changes, but lag them in time by approx. one year?
Answer: It’s warmist magic! The future cannot cause the past, EXCEPT in climate science, where everything is possible. It’s “Consensus Science”, where if enough imbeciles believe something, it MUST BE TRUE! Kind of like the Divergence Problem.
Green Solution: Ignore the contradiction (logical incompatibility, incongruity, inconsistency) or shout it down, and falsify the results. It’s all for a good cause: “Save the planet”!
🙂
___________________________
Excerpts from previous posts:
In January 2008 I published the following major observations, which constitute a strong disproof of the failed global warming hypothesis:
a. The velocity of changes of atmospheric CO2 [dCO2/dt] varies ~contemporaneously with changes in global temperature (Fig.1a).
Fig.1a – The very close relationship of dCO2/dt vs global temperature is clearly apparent. Major volcanoes disrupt the relationship.
http://www.woodfortrees.org/plot/esrl-co2/from:1979/mean:12/derivative/plot/uah6/from:1979/scale:0.22/offset:0.14
b. Therefore the integral of dCO2/dt, changes in atmospheric CO2, lag changes in global atmospheric temperature by ~9 months (Fig.1b).
Point “b” is a strong disproof of the catastrophic humanmade global warming (CAGW) hypothesis, which ASSUMES that atmospheric CO2 change causes and thus leads atmospheric temperature change, when in fact it lags in time. The CAGW hypothesis is disproved by precedence – “The future cannot cause the past.”
CARBON DIOXIDE IS NOT THE PRIMARY CAUSE OF GLOBAL WARMING, THE FUTURE CAN NOT CAUSE THE PAST
By Allan M.R. MacRae, January 2008
icecap.us/images/uploads/CO2vsTMacRae.pdf
Later I was advised by Richard S Courtney that Kuo et al (1990) made a similar observation to point ‘b’, as did Keeling (1995), in papers published in Nature. Neither Kuo nor Keeling noted point ‘a’ above. Kuo’s and Keeling’s findings have been carefully ignored for decades by the global warming alarmists.
I added some details to my 2008 paper in 2015:
TEMPERATURE DRIVES ATMOSPHERIC CO2 ON ALL TIME SCALES
By Allan MacRae, June 12, 2015
icecap.us/index.php/go/icing-the-hype/temperature_drives_atmospheric_co2_on_all_time_scales/
I later described WHY the lag of CO2 changes after temperature changes was ~9 months and formalized that conclusion in 2019.
CO2, GLOBAL WARMING, CLIMATE AND ENERGY
by Allan M.R. MacRae, B.A.Sc., M.Eng., June 15, 2019
wattsupwiththat.com/2019/06/15/co2-global-warming-climate-and-energy-2/
Excel: wattsupwiththat.com/wp-content/uploads/2019/07/Rev_CO2-Global-Warming-Climate-and-Energy-June2019-FINAL.xlsx
“This oscillation can be seen when ENSO is averaged over longer periods…”
Do you have a link to the evidence that supports this?
ROFLMAO
Loy asking for Evidence.. so funny !
You are an EVIDENCE FREE ZONE, loy.
You have none, and when others present it, it means NOTHING to you.