
Temperatures were 30-50 degrees below-normal late Monday in a widespread area from the Dakotas to Texas and west to the Rockies. Map courtesy weathermodels.com, NOAA
Guest Post by Paul Dorian
Overview
While the Atlantic Basin tropical scene remains active, an Arctic blast continues to bring record-breaking cold to portions of the western and central US as well as some unusual early season accumulating snow. Meanwhile, Tropical Storm “Zeta” is now entering the Gulf of Mexico after a brief encounter with the Yucatan Peninsula region of Mexico and it is quite likely to return to hurricane status (category 1) later today and then make a landfall later tomorrow in southeastern Louisiana. The remnants of “Zeta” will combine with a strong upper-level low now over the Southwest US to generate a significant rain event in the Tennessee Valley, Mid-Atlantic region and Northeast US from Thursday into early Friday. On Friday, enough cold air will get wrapped into the powerful system to cause a changeover to snow to result in the first accumulating snows of the season for portions of the Northeast US. All of this will be followed by a cold Halloween on Saturday with temperatures some fifteen degrees below-normal in the Mid-Atlantic/Northeast US.

Numerous record or near record low temperatures on Monday, October 26th across the central and western US. In many spots, the lowest temperature ever recorded for the month of October was observed. Map courtesy coolwx.com, NOAA
Some amazing cold and unusual accumulating snow
The Arctic cold has been historic in recent days across portions of the western and central US with some long-standing low temperature records being absolutely annihilated. In fact, temperatures late Monday were running as much as 30-50 degrees below normal in a widespread area stretching from the Dakotas to Texas as well to the west across the Rockies.

Numerous record or near record low temperatures on Tuesday, October 27th across the central and western US. In many spots, the lowest temperature ever recorded for the month of October was observed. Map courtesy coolwx.com, NOAA
One example of the extreme cold took place in Denver, Colorado on Monday where the high temperature topped out at 15°F. This was not only the coldest high temperature ever recorded in Denver during the month of October, it completely shattered the previous daily record for October 26 by halving the comparatively “balmy” 31°F that was set in 1923. The records in Denver go all the way to 1872 (i.e., 142 years) and the prior coldest high temperature in October was 18°F. The low temperature in Denver this morning was a record-breaking 8°F. Another example of the extreme cold occurred in Bozeman, Montana where earlier today the low temperature recorded was -20°F, which is 31 degrees below the previous record of +11°F. Finally, the astonishing cold in the Rockies featured a low temperature earlier today of -26°F in Laramie, Wyoming which, if verified, would not only break the monthly record for the month of October by 8 degrees, it would tie the coldest temperature for any day in November.
In terms of snow, accumulations will be significant over the next 36 hours or so in parts of New Mexico and Texas with more than half a foot in some spots on top of what has already been received. There was as much as a foot and a half observed yesterday in some areas in the Colorado Rockies. Earlier in this extended cold spell, there was impressive accumulating snow in an area extending from the interior Northwest to the Northern Plains. For example, Great Falls, Montana experienced its snowiest “one-day” ever in the month of October and also its greatest “two-day” snowfall total ever. In Alexandria, Minnesota, the snowfall this month has already made it the most ever for the month of October.

Tropical Storm “Zeta” is likely to make landfall late tomorrow in the southeastern part of Louisiana – perhaps as a category 1 hurricane. Map courtesy NOAA/NHC
Tropical Storm “Zeta”…significant rain event…accumulating snow threat on Friday in the Northeast US
While the western and central US experience unusual cold and snow, the Atlantic Basin is still featuring tropical activity. “Zeta” is now classified as a tropical storm after it weakened slightly in the overnight hours while encountering the northeastern part of Mexico’s Yucatan Peninsula. This tropical system is now entering the Gulf of Mexico and will likely return to category 1 hurricane status later today as it moves over the still relatively warm waters. By later tomorrow, “Zeta” will likely make landfall in the southeastern part of Louisiana – probably as a category 1 hurricane. This will make the 6th direct hit of the tropical season in the state of Louisiana and “Zeta” has put 2020 into the record books by matching the 2005 season for the highest number of named storms in a given year. While the number of named storms may now be equal, the strength of the storms in 2005 was on average notably higher than this year. Of the 27 named storms so far in 2020, only four have reached major hurricane status (i.e., category 3 or higher) whereas in 2005, there were seven majors, also a record.

A significant rain event is coming to the Tennessee Valley, Mid-Atlantic and Northeast US from Thursday into Friday with the combination of the remains of “Zeta” and a strong upper-level low. Map courtesy NOAA/WPC
After landfall, the remains of “Zeta” will turn northeast and combine with a strong upper-level low now over the Southwest US to generate a powerful storm system and a significant rain event across the Tennessee Valley, Mid-Atlantic region and Northeast US from Thursday into Friday. By late Thursday night and early Friday morning, this powerful storm will likely be situated off the Mid-Atlantic coastline and a cold air mass will begin to get wrapped in. As a result, there is a good chance that some of the higher elevation, interior sections of the Northeast US (e.g., Poconos, Catskills, Hudson Valley) experience a changeover from rain to snow with accumulations certainly on the table. In fact, there can be accumulating snow all the way down to the coastline of southern New England and flakes are possible as far south and east as New York City.

Accumulating snow is indeed a possibility on Friday in portions of the Northeast US as depicted here from the 06Z Euro model forecast. Map courtesy Weather Bell Analytics, ECMWF
First freeze possible and a cold Halloween in the Mid-Atlantic/Northeast US
Following the departure of the storm, it’ll turn quite cold on Friday night in the Mid-Atlantic and Northeast US with the first below-freezing low temperatures possible – even in the DC-to-Philly-New York City corridor. If, in fact, Saturday does bring the first freeze of the season, it’ll mark the shortest growing season in some areas (e.g., Chester County, PA: source Paul Callahan, Twitter) since 2002 at 174 days between freezes. On Saturday, temperatures could very well average out to be some fifteen degrees below-normal in the Mid-Atlantic/Northeast US making for quite a cold time of it for trick-or-treaters as we end the month of October. In fact, temperatures could actually dip into the single digits across the southern tier of New York State by early Saturday where there could be a decent snowfall on the ground.
One final note, this is the weekend to turn the clocks back as of early Sunday morning, November 1st.
Meteorologist Paul Dorian
Perspecta, Inc.
Follow us on Facebook, Twitter, YouTube
What does below normal mean? Nothing. It would be ‘below average’, since all records are averaged together to establish the (meaningless) average temperature. Below normal indicates that there is a ‘normal’ temperature on a given date, which I think we all can see is also meaningless – it may NEVER hit what is called ‘normal’. How can that be ‘normal’?
My complaint exactly John. I have been taking special note for a couple decades now on how the local Meteorologist’s on the TV stations mix up their vernacular. I noticed how as I moved around the country on business that their reports is “above normal’ temperatures on warm days but typically switch to “Below Average” when temperatures fall aschew of the Global Warming meme. All subliminal, albeit, intentional subconscious implantation.
In this particular report Charles is simply using the propagandists “trickeration” against them.
I suggest deviations reported by z-score to add to the confusion
“Normal” is a defined term in much the same way as a human’s “normal temperature.” It has been in use since the mid-1930s, and internationaly accepted. You can look it up – – and should.
Right-on, John.
My problem is with the use of “most this” , and “ever”.
Clearly these should all be changed to, “since records were established” and, then give the length of those records. This was actually done one occasion.
An “average” requires a start date/time. and an end date/time.
Both of which are chosen arbitrarily by necessity. Either with a motive … or not
“Climatic Normals” are defined and based on a 30 year record with the last year of the thirty ending in Zero. The 1981–2010 U.S. Climate Normals dataset is the latest release of NCEI’s Climate Normals.
Perhaps by this time next year there will be a 1991-2020 data set.
The concept was never meant to serve as a source for studies of climate change. It is just a standard reporting device.
However, it is what it is, and 85 years young. Give it some respect.
That reminds me of why 30 years was such a poor choice…Climate generally cycles around a 65-70 year period, which can be seen by looking backwards. 30 years can be 1/2 of a warm or cold cycle, or somewhere in between. So the 30 year ‘climate’ definition is totally worthless, UNLESS you know which section of the ‘sine wave’ it was taken from. Had they defined it as 70 years, it would include most of a warm cycle and a cool cycle. Even at 60 years, it would be more meaningful.
Unfortunately, we don’t have long enough records to homogenize the record…but we could average each pair to see what that looks like…
But these days, people see weather and think climate anyway…and Co2 as a cause. It’s daffy.
Weather Or Climate?
Steve, the cold part of the story is weather and the hurricane warm part is Climate Change.
++++++++++++++++++++++++++++++++++++++++++++++++++++++++++++++++++++++++++++++++++++
I thought I remember some meteorologist discussing that a cooler than normal spring generally indicating a more active hurricane season; Seems to have been correct this year.
Is there a climatological event that’s clustering storms in the GOM and aiming landfall near Louisiana; more than an unusual random cluster? FL took 3 strong storms at virtually the same landfall in 2005. Event or random???
Silly people. Don’t you know cold is caused by warming?
I would say its weather, probably associated with La-Nina.
Steve Case
Usually, CONUSians writing comments on this blog speak about weather when it’s warm, and about climate when it gets cold.
I see that the difference between Northern America and Europe becomes greater and greater.
My impression since years is that very cold bumps coming from stratospheric layers down to surface become more and more frequent in the northern part of the US.
We are here IMHO leaving weather conditions, and enter climate patterns.
I would enjoy Roy Spencer looking at the four atmospheric layers he watches all the time, and telling us what he sees there right now.
J.-P. D.
Bindidon, I am willing to guess that the cold outbreak is associated with weak latitude winds, due to a weak La Niña, which allow sine waves to start forming and polar outbreaks to occur. The stratosphere, by the way, is warmer than the troposphere, which means at higher altitudes it gets warmer.
Ron Long
” The stratosphere, by the way, is warmer than the troposphere, which means at higher altitudes it gets warmer. ”
You are right when considering higher stratospheric layers: but sorry, I didn’t mention that I was speaking about Roy Spencer’s observed layers, the topmost of them being… the lower stratosphere.
My bad.
If you look at the 1981-2010 climatology for this layer
https://www.nsstc.uah.edu/data/msu/v6.0/tls/tlsmonacg_6.0
you see, when you process this data, that the average temperature there is about 213 K, i.e. around -60 °C.
Rgds
J.-P. D.
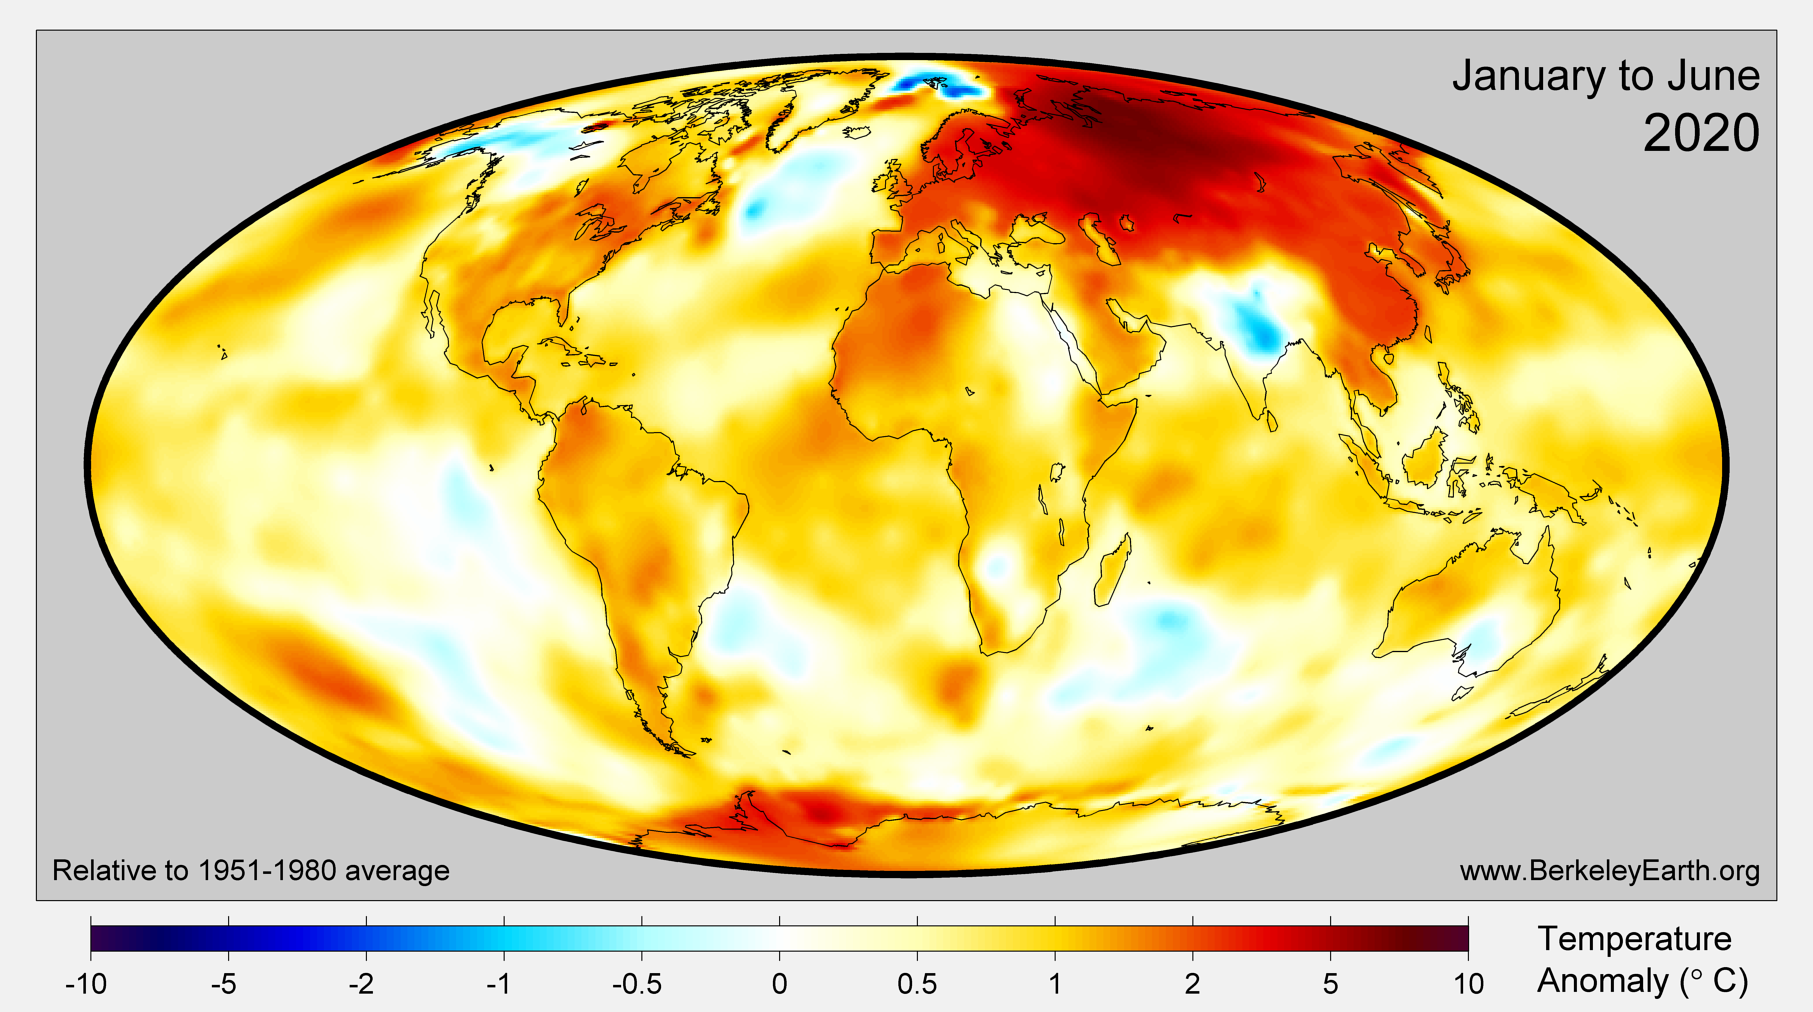
Its the flip side of the warm anomaly still sitting over the North of Siberia
This FREEZING cold blob will badly affect the USA, while the slight warm anomaly is good for the Arctic sea life.
That warm anomaly over the Arctic is still freezing temperatures, though, so I would expect Arctic sea ice to rise very quickly over the next month or so.
Would be good if the cold blob over the USA moved over to southern UK and froze the place solid.
It’s all just weather. Pretty much always unusual somewhere.
Is this what you’re describing as a “slight warm anomaly”? It’s now 10 months long and covers most of Northern Russia.
This:

is not weather.
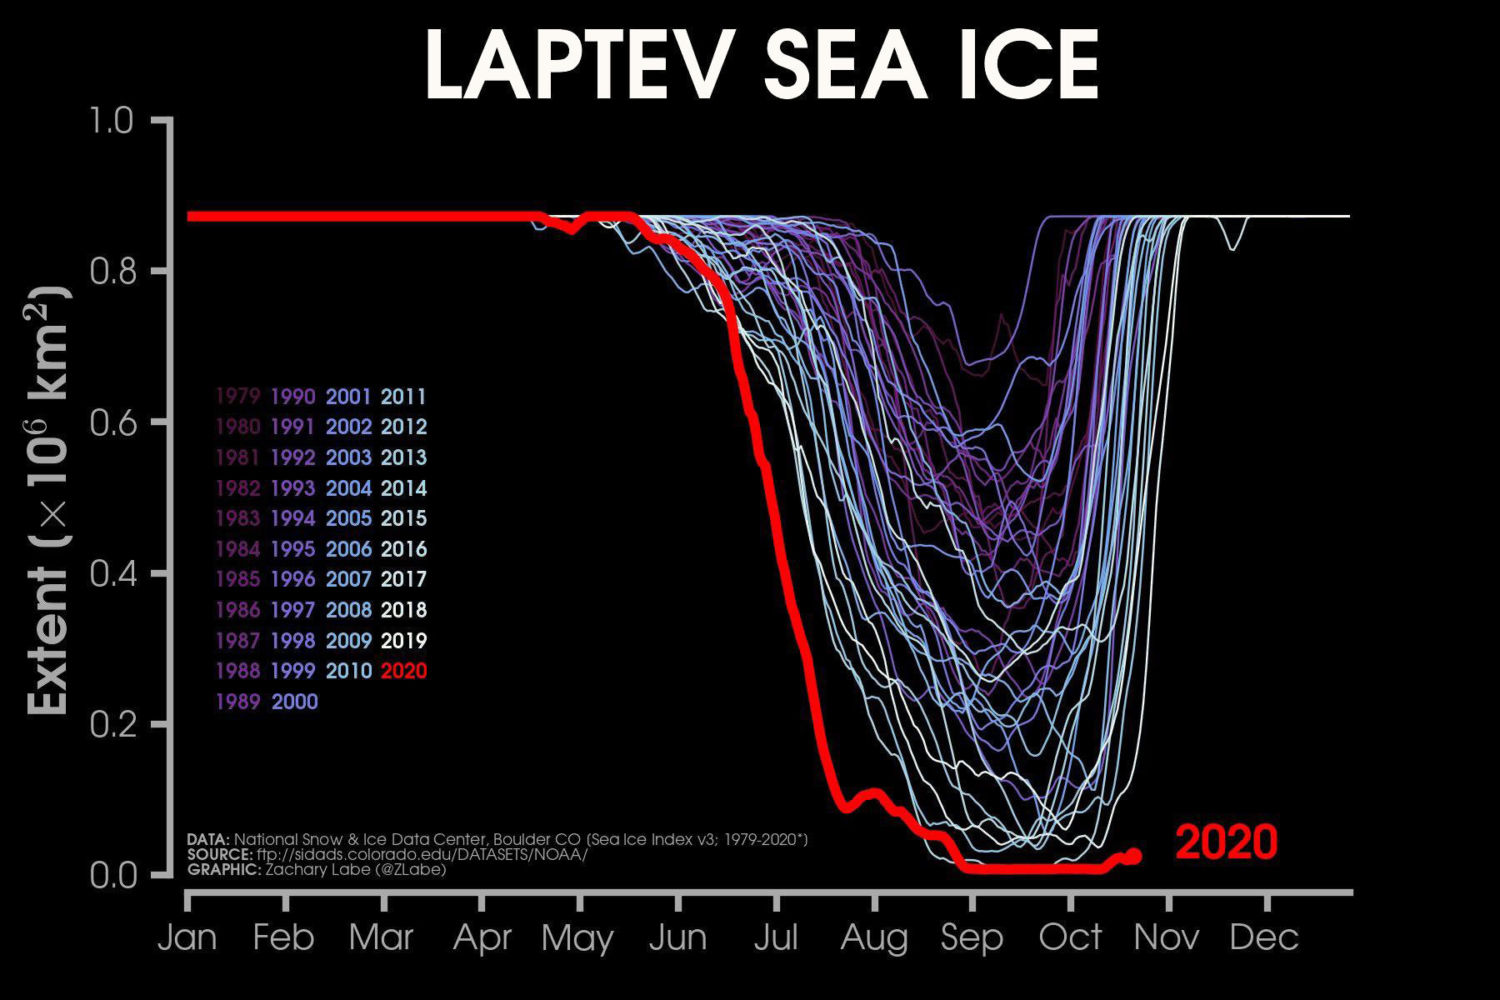
and unsurprisingly the Eurasian side sea ice reflects the thermal conditions.
Oops, time to change the subject.
So you ADMIT its a persistent WEATHER event,
Its certainly NOT global, and it certainly NOT caused by atmospheric CO2.
Fabricated data from GISS et al won’t help you either.
here are some ACTUAL Data series from several places all over the Arctic.
Yes we have THANKFULLY warmed out of the Little Ice Age
But as we all know, you have absolutely ZERO EVIDENCE that the highly beneficial warming has any human causation except Urban heating effects.
1… Do you have any empirical scientific evidence for warming by atmospheric CO2?
2… In what ways has the global climate changed in the last 50 years , that can be scientifically proven to be of human causation?
Run and hide…. or yap mindlessly in evasion.. your choice.
No mention of the FREEZING COLD inundating the USA , hey Loy,.. you dolt !
Remain clueless.. the only choice you seem able to make..
And of course, There has been no warming in the Arctic this century except from the 2015 El Nino
and the Arctic COOLED from 1980-1995…. then a step at the 1998 El Nino
Absolutely ZERO EVIDENCE of warming by atmospheric CO2
fred250
Here we go again Fred. Your chart marked UAH NoPol 2000-2020 actually starts in February 2000, not January. I would guess you dropped January 2000 because it was very cold in that series and including it would have spoiled the look of your trendline out to Dec 2015, giving it a slight but nevertheless noticeable warming slant.
Cherry-picking’s one thing Fred, but at least try labelling your charts properly if you’re determined to do it. Thanks.
Lets have a look at the actual temperatures in Siberia shall we
See that purple.. that’s NEGATIVE 30ºC
Off you trot, l enjoy the anomalous warmth, little child-mind. 😉
Your spittle-flecked, shouty rants are getting a bit crazy again, wipe your mouth and calm it down. I don’t want to see you kicked off again, you’re too useful.
Poor little Loy d’oh !
No facts to back up anything you say.
You are a JOKE….. and you make a mockery of AGW apostles.
You are cretinly useless.
Do you want to make a 1st attempt ???
1… Do you have any empirical scientific evidence for warming by atmospheric CO2?
2… In what ways has the global climate changed in the last 50 years , that can be scientifically proven to be of human causation?
Loydo
Please try to apply logic. My comment was that the unprecedented brutal record cold in the interior of the US is not a sign of climate turning colder. It is just a weather event. At the same time that was occurring last week, I had my bedroom window wide open all night because of the 25C weather in Connecticut. Also a weather event. It’s back to miserable cold rain here.
How can CO2 be driving record cold AND unusual warmth on the same continent at the same time?
Weather patterns in the Arctic circle have always been in flux, with very similar newspaper stories predicting the end of ice in the Arctic from a hundred years ago. Get a grip, don’t be griff.
Rich
Well said. When the sun is quiet, there are larger excursions of the jet stream north and south. The problem for humans is that when there is a southerly excursion of the Arctic air during growing season, it freezes all crops above ground. That only has to happen once a month to disrupt the entire food supply.
So even if the average temperature drops a degree or two, or rises or stays the same, the impact of a quiet sun can be extremely harmful to human well-being.
In 1816 there was a frost event every month all year. That destroyed the entire season and there was a terrible food shortage. The oft-cited observed link between the number of sunspots and the price of wheat is not useful as a temperature prediction, it is useful as an indicator of the growing conditions for farmers. That means not only temperature, but absence of frosts.
Frosts bracket the growing season, beginning and end. The number of degree days between them is important, but not critical. If doesn’t matter how hot is gets in July, it matters if the temperature drops to -3 C for two nights in a row.
It is really good to know what global warming really looks like.
Evidence such as this, from many particular areas of the world, was clearly one reason why the CAGW zealots changed their religion’s name from CAGW to Climate Change. The former, average global temperature increases, is recordable and determinable from direct and indirect, i.e. it can be tested and verified. The zealots were having increased difficulties and have failed to scientifically verify this theory, and too much hard contrary evidence was appearing. They then had to to ignore evidence such as is outlined here and start preaching their new named theory – Climate Change, i.e. something that everyone agrees with but but which cannot be tested but can mean anything to anyone!
Well, the IPCC was formed in 1988, and the CC stands for you know what. So they’ve been saying it for decades. But you’re somewhat correct when it comes to the media.
CC = Communist China?
Our clocks turned back last weekend.
As I read elsewhere, at some places it rained out of warm air above down to the cold air and a lot of ice rain came down, followed by broken powerlines and trees….
“Our clocks turned back last weekend.”
You’re lucky. Here, we mostly have to do that ourselves, which is a huge pain in the butte. And I’m not mesa-ing with you either.
Only two cklocks by hand, the rest or internet or radio unit or sat (TV etc)
And of course, according to the climate alarmist narrative, this is all happening because excessive CO2 levels in the atmosphere are disrupting and destabilizing the Earth’s normal climatic behavior. Amazing that they have transformed CO2 from a greenhouse gas into a climate destabilizing gas, isn’t it?
If kickers could move the goalposts in the NFL the way climate alarmists rewrite their narrative, the kickers would never miss a field goal or an extra point.
Two Linear Econometrists were deer hunting. One, the hunter, had the rifle, the other was spotting with binoculars. Lo and behold they saw a nice buck on a hillside quite some distance away. The hunter aimed and fired, kicking up dust three feet to the right of the buck, but with good elevation. “Three feet right!” exclaimed the spotter. The hunter compensated and fired again. This time the dust kicked up three feet to the left of the buck. “Got him!” exclaimed the spotter.
Climate ‘science’ is so bad that despite constantly moving the goal posts, they have never made a field goal!
They’re kicking in the wrong direction.
Climate Projecting is a 50/50 coin flip. They keep tripping on that pesky 50 Yard line.
They moved the goal post completely out of the stadium.
And into the Climate Zone™.
WARNING!! Climate change will make the world hotter, and colder, and wetter, and drier, and more hurricanes, and fewer hurricanes (and tornados) and…our climate models predicted all this very accurately!
Gavin Schmidt – 2008
And thus, all the “adjustments” that became necessary.
That was fixed by changing the data.
What a blessing homogenisation was for the faithful. It restored their hope that ‘science’ can achieve wonders when evil minds are exercised on the dilemma.
Since the development of Climate Change, the need to polish the turd the data has become is no longer relevant. We now have the Humpty Dumpty science of Climate Change that can be whatever the zealots choose it to be. So record cooling in the USA is simply further evidence of Climate Change – it is all around for those who want to see.
Global warming via man-made CO2 entering the atmosphere is an amazing thing:
— it causes flooding in the midwest
— it causes a massive increase in hurricanes making landfall along the Gulf of Mexico
— it causes massive wildfires in the West
— it causes early and intense cold to sweep from the Dakotas to Texas and west to the Rockies
— it causes the likes of Al Gore, James Hansen, Michael Mann, Thomas Karl, Al Gore, Greta Thunberg, Alexandria Ocasio-Cortez, Prince Charles, Bernie Sanders, Joe Biden and Kamala Harris to gain publicity (or is it notoriety?)
— it is responsible for giving mankind the IPCC and the Paris Accord
— and it may well lead to the destruction of the US as we know it today.
And the above is only the short list.
It’s only appropriate that you listed Al Gore twice.
Thanks for the catch . . . you’re right, it bears repeating!
Don’t you mean it ManBearPigs repeating?
What about Al Gore?
Do you mean beyond the fact that he’s an idiot?
I just thought you should include him more, since he’s the archetype of the climate-grifter politician. You only listed him twice.
Don’t forget, global warming means Louisiana will soon be too hot for humans to survive.
Bulletin of the Atomic Scientists: In 20-40 Years, Global Warming will Make Louisiana Uninhabitable
/sarc
Thermageddon delayed.
Indefinitely,
“One final note, this is the weekend to turn the clocks back as of early Sunday morning, November 1st.”
Ok…just rub it all in some more. They could of at least approved the legislation to keep the clocks permanently on Daylight Saving Time this year, just to give us some hope. Soon it will be dark at 5 Pm, and now the annual ice age has arrived a month early and there is foot of snow on the ground already. And it ain’t even Halloween yet. Now I know why the ancients were so terrified of winter and the loss of light. I am assuming some VEI 7 volcano is going to pop off somewhere, just to close out 2020 with a real chill well into 2021. And it will still be the 2nd warmest year on average, we were told just last month. Maybe somewhere else, but not central/northern NA.
Why the hurricane track almost exactly the same, plowing through pretty much the same waters time after time this year? You would think all that oceanic heat would have left the station, and that storm track would be off somewhere else. I know weather sometimes rhymes and we get the same pattern set-up for similar weather over longer time scales, but what is the cause of this similar hurricane track this year? Feeling sorry for Louisiana!
I don’t need to change my clocks this weekend. Only places where fools think they can save time do.
Petty of me, I know, but I get a smirk on my face twice a year when people in other States have no idea what time it is.
Actually, I think that Daylight Savings Time comes from the exact same mind set as Climate Control. It does not matter what time you set your clock for, the sun will come up and go down, the day will be just as long or short. Similarly, whether you drive a battery powered moped or a Hummer, it will rain when it rains, snow when it snows, get hot when it gets hot.
One person (I can’t remember who right now) said that the saying “Nature is a nasty b*tch” is entirely wrong. Nature is a completely uncaring b*tch.
The extra hour of sunlight caused curtains to bleach and milk to sour in the deep north, Queensland. So they abandoned daylight saving a long time ago. Now the curtains fade slower and the milk is always fresh.
Despite the dubious observations of the State’s famous leader, it is really not sensible for a region, the State of Qld, that spans tropics to sub-tropics to change clocks. The length of daylight over each day does not change that much. Getting up earlier means lights go on in the morning rather than at night – so no benefit. Really bad if the lights are left on after the sun rises.
Greetings, Earthling2; from a fellow Earthling:
I would respectfully request that if we are to keep our clocks on one setting all year long, please do not put us onto “Daylight Savings Time” for the whole year.
There is an astronomical aspect to Standard Time (look at the name: STANDARD), whereby within that time zone (yes, it spans some territory, but read on … ) at astronomical Noon, the sun is at, or very close to, the meridian. If you put us onto DST (which, in my part of the world, and my profession, also means ‘Drill Stem Test’), the sun will forever be about 15 arc degrees from the meridian.
I’m all for staying on ONE time system for the entire year, but I believe we’re better off if we keep to what the astronomical time tells us: when the sun crosses the meridian, you have local noon.
I know that in Ben Franklin’s day, DST might have had some justification, but the major consumer of electricity in the modern residence is NOT the lights; in some cases, especially with CFL’s and LED’s as the majority of your lighting, the electrical consumption of these types is minimal, and other things are your major users of electrical power. You have a refrigerator, TV, computer, oven, and a few thousand other things besides the lights.
I welcome your thoughts and comments, and wish you
Best Regards,
Vlad
Maybe if everyone agreed to reset to a standard time by splitting the difference and making it an additional 30 minutes of DST instead of a full hour, that would be a compromise. But everyone would have to agree to be on the same page. It does make more sense to have later daylight hours on the clock year round for many reasons, including health which is utilization of outdoor activity after work or school, instead of being dark so early. Splitting the difference makes it closer to astronomical noon, with a slight bias to later sunsets on our clocks. I could live with that year round.
There is obviously no more actual daylight in the solar day by doing this, but just how we utilize an artificial clock that we utilize to tell time and how we structure our waking hours around daylight. In summer, it means later daylight hours compared to the clock, and the sunrise not happening at 4 Am-5Am in the summer. Whatever we do, it should be a continental or a global standard, and not one that sees us changing the clock twice a year. That is clearly unproductive that is supported by all evidence. Whether it is DST or Standard Time, or my proposal to split it down the middle by 30 minutes, we should pick one and stick to it. I just hope it isn’t standard time we choose, as I think we benefit by having more daylight in the evening according to our man made schedules and clocks. I think the vast majority of people in most jurisdictions that change the clocks twice a year also wish to see later sunset times to take advantage of that additional daylight on the clock.
Didn’t the Brits experiment with year-round DST back in the early 1980’s?
Children walking to school in the dark killed that idea.
Absolutely, I remember it well, the experiment was very unpopular (it ran from 1968-71). Particularly in the north where it was thought of as yet another crackpot idea from the parliamentarians in the south.
Just realized that this debate may very well be meaningless. If the election goes the wrong way, all of us will be on Farmer Time.
There is only one ‘time’. Faking time just screws up schedules around the world, and twice a year makes people screw around with their clocks, in their houses cars, etc.
Much of the world goes by GMT. GMT doesn’t have ‘daylight savings time’. It is an idiotic concept to declare that time is not what it actually is. BILLIONS of clocks have to be reset twice a year. Why does this STUPID anachronism continue to exist? Because politicians won’t take a stand. It’s the same reason the US isn’t a metric country, along with 2 other tiny, meaningless countries, Algeria and Myanmar. Nice company. The US claims its populace isn’t ‘smart enough’ to be metric. What does that say about the other hundreds of countries? Like in my state, where you can’t pump your own gas…and New Jersey too. The other 48 seem to be able to pump their own gas, but in THESE two states, there is a political will to defy the other 48 states, making us wait to get our gas so some druggie can find time to pump our gas. It defies logic…
The US claims its populace isn’t ‘smart enough’ to be metric.
Have you looked around the country lately? I think they’re right.
MASSIVE cost to change over, @John.
ONE project – replacing speed limit and mileage signs along Interstate 19 between Tucson and Nogales (approximately 63 kilometers) – $1.5 million in 2009. That works out to around $1.85 BILLION just for all of the interstate system. (Most likely more – exits are far more dense on most other chunks of freeway). Then there are all of the other non-Federal highways, streets, etc.
This is just simple signage, which is just a fraction of a percent of everything that would have to be reworked. Not worth it just to get along with the rest of the world, sorry.
(While we’re at it – why not convert over to a metric time system, eh?)
I think you’ll find it’s Liberia not Algeria.
Dozing off to sleep last night, it occurred to me that if memory serves, Arizona stays on ‘Standard Time” all year long.
It seems that I’ve heard a few other US localities that do the same, but I’m not sure.
I hear enough complaining about changing the clocks twice per year, but as Mr. Shotsky says, there just doesn’t seem to be a lot of incentive to put us onto one time and stay there. I’d still vote to stay on ‘Standard’ time year-round, given the opportunity.
Regards,
Vlad
… but NOAA said just two weeks ago that this winter would be warmer, especially in Texas.
It will take one heck of a warm winter from here out to make up for all this cold.
They may be right, because the actual cold isn’t winter but fall cold.
I always think it’s funny when they give a “Winter Storm Warning” in the Fall or Spring.
I have a small booklet published by the Wyoming College of Agriculture in 1964 showing climate statistics from around the state during 1931 to 1960. We were -26F at KLAR yesterday morning. There is no entry at -2 or colder on any October day during that 1931-1960 period.
Weather continues to operate.
On Monday morning October 26th, Bozeman Yellowstone International Airport (BZN – which is actually in Belgrade, MT) set an all time record low at -18F (previous record +11F). My daughter lives not far from the airport. Butte was also at -18F which was 27F below the previous record of +9F.
Potomac up the Blackfoot hit -29F on Monday morning.
Tough conditions getting the cattle off the summer range and
ship calves this year.
That, in part, could explain why I live in TN and am not cattle ranching in MT. One of the B&W photos hanging up in my house is of Black Angus cattle feeding on alfalfa on a snow-covered pasture on my parents ranch. One of my cousins still ranches up near Choteau.
Good luck this winter.
Paul Dorian reports Bozeman was -20F. I had seen -20 earlier but used a news station report (7KBZK) which listed it as -18. When growing up in Bozeman and doing undergraduate at MSU, it got that cold periodically mostly in Jan or Feb.
I recall skiing Bridger Bowl, Christmas day 1972 and the temp was
-25F. I went with a buddy and his folks, we had the hill mostly
to ourselves while his folks stayed in the lodge by the fire. Not any lift lines
that day but it was a bit frosty riding the chairlift. Farm kids
didn’t seem to mind the cold back then so much. I remember
riding snowmobiles at night by my self back then in -20F temps
and thought nothing of it. The winter of ’78-79 we had 100 consecutive
days where the high temp failed to reach zero..often the high was -30F
worst winter in my memory. Started Thanksgiving weekend with a huge
storm.
Dan-O,
I took skiing as a PE class at Bridger during two winter quarters (’71 & ’72). Glad I was NOT skiing Christmas ’72. I really don’t care much for cold-weather skiing. +20 is fine with me for my age and comfort level. Bridger was a great place to ski.
I went to backcountry skiing years ago, I love the purist
adventure of it.
My dad’s side of the family homesteaded near Springhill
in the 1860’s. They were mostly grain farmers but also ran goats
and cattle. I have a photo of my granddad wearing a surplus
army buffalo hide coat that saved his life several times. He got
it while driving stagecoach in the park back when the army ran
the park . He would take a bobsled to town with a team for supplies
and it would take an 2 days to make it both ways..I’m always in awe
of those folks..
Pretty cool Dan-O
My grandad arrived in the US on a whaling ship in 1903 and in 1910 bought land on the other side of the Bridger ridge from Spring Hill. Cool to have such a history.
I have to wonder how much of this latest storm
was influenced by the present solar minimum.
The storm track is slow and wavy.
Here in W Montana we have had 4 yrs now of this
type of fall winterish weather activity. I had 18″ inches of
snowfall on the ground and -10F temp. Monday morning The
storm from a week earlier was 6″ snow but more moisture
and warmer temps.
No one can say I didn’t try to warn everyone in 2018 about long duration low TSI cooling…
Two years later now I’m thinking this situation could extend further past 2021…
The long-term F10.7cm running average I use is now 117.0 sfu/day today, bringing the set of curves down lower than depicted in this next image from a few months ago.
Expect a dramatic increase in Arctic sea ice this winter. Meanwhile the sun activity is slowly perking up, but it’s going to take some time to turn around the solar cooling already ‘in the pipeline.’
Maybe Albert Gore can assure us windmills and solar panels will get us through this ‘climate change’. He said once or twice “Sunspots, bullsh11t!” – well now we know who is full of it.
A dramatic INCREASE in Arctic sea ice? Oh, no!!! What will Griff do now!?!?!
A dramatic increase in Arctic sea ice would be surprising. Currently it is way below average
and is not increasing particularly fast. It is in fact setting records for record lows.
You aren’t paying any attention are you , Izzy.
The sluggish start was because of the less cold blob above Siberia.
The flip side is the freezing cold in the USA
That less cold blob has now dropped below 0ºC
The sea ice will probably now play “catch up”.. rather quickly.
And once that less freezing cold blob dissipates, will climb rapidly.
Fred,
Playing “catchup” is very different from “a dramatic increase”.
It is still very early days but the idea that there will be a dramatic increase in maximum sea ice extent seems far fetched.
YAWN
Playing silly games with words. You poor witless twerp.
It will have a rapid increase that allows it to catch up with previous years.
Izaak were you surprised over the increase in sea ice in 2019 after it was almost as low?
An increase in Arctic sea ice from the low where it is now will appear dramatic by comparison, like it did last year. Why is that so far-fetched? Did you expect the ice to keep melting and not recover?
Don’t worry, GISS will show this winter to be the ‘hottest on record’.
The smaller lakes in the Twin Cities have already frozen. At least 3 weeks early.
“Consistent with….”
A consequence of a warmer than usual arctic…
(just look at Siberia)
Warmer Arctic ??
Link correction
Or the opposite … or none of the two.
Correlation does not mean causation.
If you are referring to ‘lake effect snow’, ie unfrozen waters sourcing evaporation for a lot of snow into the now colder air then you are right for change.
Grope sez:
A consequence of a
warmernot as friggin’ cold as usual arctic.Fixed for ya.
Temperature in Irkutsk now is 1.0 degree C, vs. daily mean for October of 1.8 C.
You think Siberia is in the Arctic?
As always, an unfalsifiable hypothesis from Griffiepoo…
No kidding in MN we have had 7+ inches of snow in October. Global warming indeed.
Hey griff, if the Arctic is warmer than usual now, why isn’t it ice free? That was forecast to happen already by 2013 or 2014 or 2015 or 2016 or 2018.
https://cei.org/blog/wrong-again-50-years-failed-eco-pocalyptic-predictions
That warm anomaly over Northern Siberia is now below ZERO C.
Unfortunately , that means Arctic sea ice will start increasing very quickly over the next month or so..
Only benefit would be that it should shut up your mindless caterwauling.
Arctic ice volume however looks normal
http://polarportal.dk/fileadmin/polarportal/sea/CICE_curve_thick_LA_EN_20201027.png
There’s a lot of thick ice piled up on the north coast of Greenland.
And Greenland is gaining surface mass at above average rate.
“normal”, you think a 30% fall in a decade is normal?
You mean a return back slightly towards more normal Holocene extents after the EXTREME HIGH of the late 1970s..
Right loy-dope ! ?
You do know that Arctic sea life is now returning to the Arctic don’t you ?
Near extinct species starting to re-inhabit, thanks to the beneficial drop in sea ice…
Or are you like griff , who hates Arctic sea life with a vengeance, and wants to see it buried under seas of ice all year around. ?
According to the graph you linked it looks about 3,000 km^3 below normal?
look on the bright side – it’ll keep those “peaceful’ (rioting) protestors off the streets if it’s snowing and cold/adverse weather benefits voting Repubs…..
Maybe they will come out protesting about global warming ! 😉
Well, they DID say that global warming was going to cause a new little ice age…
Plenty of freezes already here in west Maryland, USA. Crepe myrtles were freeze-fried way back in late Sept. Admittedly, I’m in a frost hollow……
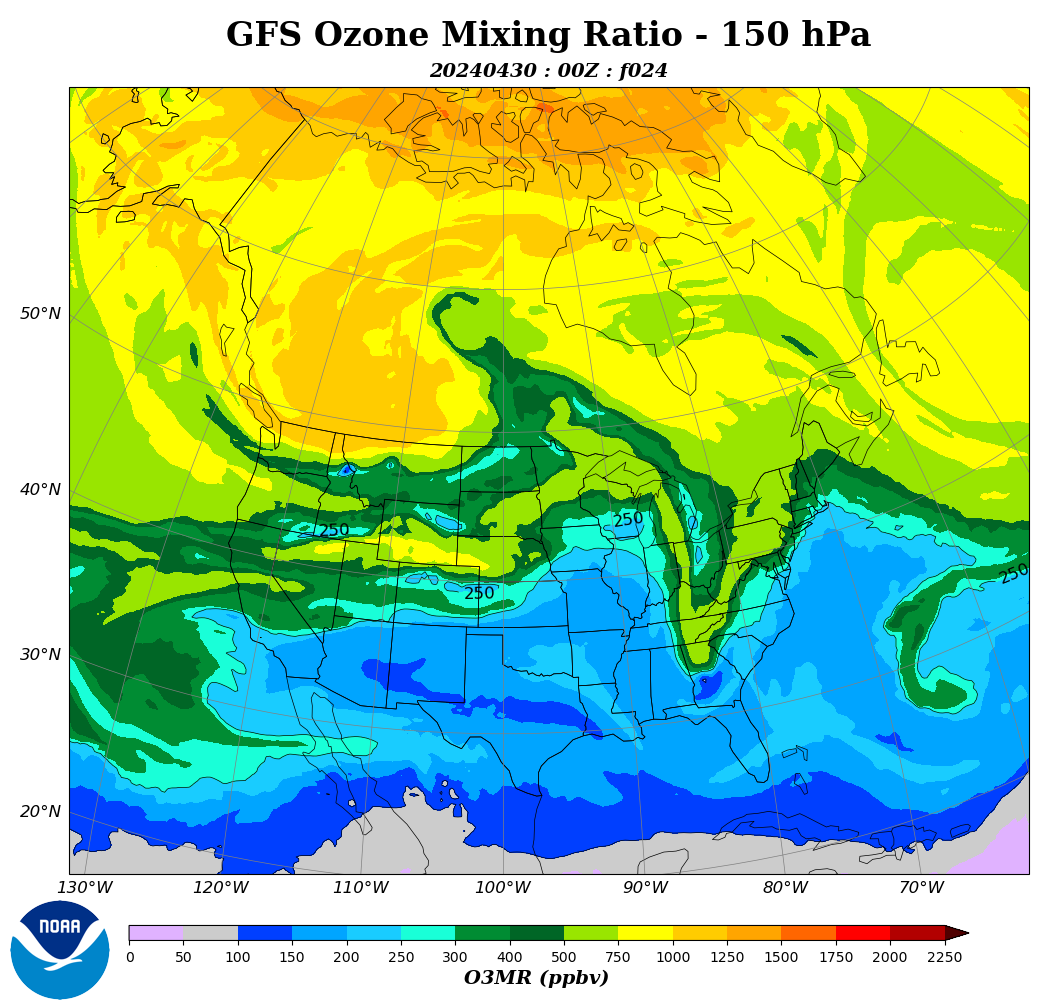
Stratospheric Intrusions are when stratospheric air dynamically decends into the troposphere and may reach the surface, bringing with it high concentrations of ozone which may be harmful to some people. Stratospheric Intrusions are identified by very low tropopause heights, low heights of the 2 potential vorticity unit (PVU) surface, very low relative and specific humidity concentrations, and high concentrations of ozone. Stratospheric Intrusions commonly follow strong cold fronts and can extend across multiple states. In satellite imagery, Stratospheric Intrusions are identified by very low moisture levels in the water vapor channels (6.2, 6.5, and 6.9 micron). Along with the dry air, Stratospheric Intrusions bring high amounts of ozone into the tropospheric column and possibly near the surface. This may be harmful to some people with breathing impairments. Stratospheric Intrusions are more common in the winter/spring months and are more frequent during La Nina periods. Frequent or sustained occurances of Stratospheric Intrusions may decrease the air quality enough to exceed EPA guidelines.
The upper low over Texas draws the Zeta to Louisiana.
https://www.tropicaltidbits.com/sat/satlooper.php?region=us&product=wv-mid
http://tropic.ssec.wisc.edu/real-time/mtpw2/product.php?color_type=tpw_nrl_colors&prod=namer×pan=24hrs&anim=html5
The maximum ice extent is pretty closely bounded. Anyway, the ice extent right now is below what it was at this time of the year in 2012. link We’ll need a dramatic increase just to get back to what has been the recent norm.
Apparently the cold air mass that came down from the arctic means that air mass has been replaced by a warmer air mass up there. link
The globe, as a whole, probably continues with the same slight warming trend it has been on since the end of the Little Ice Age.
The November low Arctic sea ice record was set in 2016, yet 2017 and 2018 were higher than average for years 2007-20.
If you go to my first link, you get an interactive chart where you can plot a bunch of dates. Right now 2020 is tracking way below 2016.
The arctic is where warm air goes to die. It seems reasonable to expect that if it’s abnormally warm there, much more heat than normal is heading for outer space. So, does that mean the polar cell is speeded up or slowed down or could it even reverse? On the other hand is it irrelevant?
True. But IMO it’s likely that there will be more Arctic sea ice next month, et seq than in 2016.
Index Nino 3.4 drops to -1.5 C and will drop further in November (the temperature of the Peruvian current drops).

