Reposted from Dr. Roy Spencer’s Blog
July 3rd, 2020 by Roy W. Spencer, Ph. D.
For the last 10 years I have consulted for grain growing interests, providing information about past and potential future trends in growing season weather that might impact crop yields. Their primary interest is the U.S. corn belt, particularly the 12 Midwest states (Iowa, Illinois, Indiana, Ohio, Kansas, Nebraska, Missouri, Oklahoma, the Dakotas, Minnesota, and Michigan) which produce most of the U.S. corn and soybean crop.
Contrary to popular perception, the U.S. Midwest has seen little long-term summer warming. For precipitation, the slight drying predicted by climate models in response to human greenhouse gas emissions has not occurred; if anything, precipitation has increased. Corn yield trends continue on a technologically-driven upward trajectory, totally obscuring any potential negative impact of “climate change”.
What Period of Time Should We Examine to Test Global Warming Claims?
Based upon the observations, “global warming” did not really begin until the late 1970s. Prior to that time, anthropogenic greenhouse gas emissions had not yet increased by much at all, and natural climate variability dominated the observational record (and some say it still does).
Furthermore, uncertainties regarding the cooling effects of sulfate aerosol pollution make any model predictions before the 1970s-80s suspect since modelers simply adjusted the aerosol cooling effect in their models to match the temperature observations, which showed little if any warming before that time which could be reasonably attributed to greenhouse gas emissions.
This is why I am emphasizing the last 50 years (1970-2019)…this is the period during which we should have seen the strongest warming, and as greenhouse gas emissions continue to increase, it is the period of most interest to help determine just how much faith we should put into model predictions for changes in national energy policies. In other words, quantitative testing of greenhouse warming theory should be during a period when the signal of that warming is expected to be the greatest.
50 Years of Predictions vs. Observations
Now that the new CMIP6 climate model experiment data are becoming available, we can begin to get some idea of how those models are shaping up against observations and the previous (CMIP5) model predictions. The following analysis includes the available model out put at the KNMI Climate Explorer website. The temperature observations come from the statewide data at NOAA’s Climate at a Glance website.
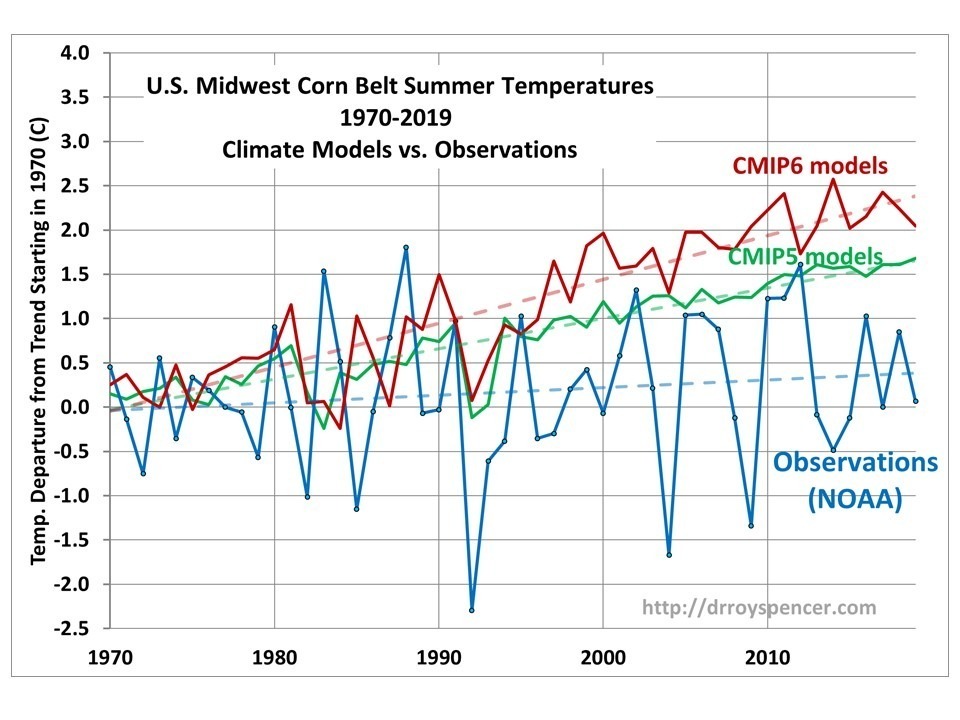
For the Midwest U.S. in the summer (June-July-August) we see that there has been almost no statistically significant warming in the last 50 years, whereas the CMIP6 models appear to be producing even more warming than the CMIP5 models did.

Fifty years (1970-2019) of U.S. corn belt summer (JJA) warming since 1970 from observations (blue); the previous CMIP5 climate models (42 model avg., green); and the new CMIP6 climate models (13 model avg., red). The three time series have been vertically aligned so their trend lines coincide in the first year (1970), which is the most meaningful way to quantify the long-term warming since 1970.
The observed 50-year trend is only 0.086 C/decade (barely significant at the 1-sigma level), while the CMIP5 average model trend is 4X as large at 0.343 C/decade, and the CMIP6 trend is 5.7X as large at 0.495 C/decade. While the CMIP6 trend will change somewhat as more models are added, it is consistent with the report that the CMIP6 models are producing more average warming than their CMIP5 predecessors.
I am showing the average of the available models rather than individual models, because it is the average of the models which guides the UN IPCC reports and thus energy policy. It is disingenuous for some to claim that “not all IPCC models disagree with the observations”, as if that is some sort of vindication of all the models. It is not. If there are one or two models that agree the best with observations, why isn’t the IPCC just using those to write its reports? Hmmm?
What I find particularly troubling is that the climate modelers are increasingly deaf to what observations tell us. How can the CMIP5 models (let alone the newer CMIP6 models) be used to guide U.S. energy policy when there is such a huge discrepancy between the models and the observations?
I realize this is just one season (summer) in one region (the U.S. Midwest), but it is immensely important. The U.S. is the world leader in production of corn (which is used for feed, food, and fuel) and behind only Brazil in soybean production. Blatantly false claims (e.g. here) of observed change in Midwest climate have fed the popular opinion that U.S. crops are already feeling the negative effects of human-caused climate change, despite the facts.
This is just one example of many that the news media have been complicit in the destruction of rational climate debate, which is now extending to outright censoring of alternative climate views on not only social media, but also in mainstream news sources like Forbes which disappeared environmentalist Michael Shellenberger’s op-ed in which he confessed he no longer believes in a “climate crisis”.
Post didn’t say Average or Maximum temperatures. Averages are misleading. If you want to know how hot it got, the average of the daily temperature isn’t going to tell you that. Having said that here’s a graphic
that shows that Maximum temperatures May through October for much of the Eastern United States has been cooling for 80 years. Many of those states show a cooling trend since the 19th century. Like this WUWT post the data comes from NOAA’s Climate at a Glance:
https://www.ncdc.noaa.gov/cag/national/time-series
Steve, I agree “average” temperatures are deceiving. Regional warming may have positive or negative impact. Avg Temp should be broken into components of daily high and lows to better assess Impact and risk.
If average warming is caused by increasing daily high temperatures, it may be very detrimental to agriculture. I expect many of those daily high records of the 1930’s to be exceeded which will cause a similar agriculture disaster.
If average warming is caused by increasing low (night) temperatures, agriculture benefits with longer growing seasons caused by fewer frost nights.
I am frustrated that climate scientists use “averages” and “anomalies” instead of “high/low” and “actual” temperatures. This makes it difficult to assess whether or not we should be concerned with regional temperature changes.
As a real scientist, Mr Spencer, you are assuming that goverment bureaucrat scientists care about making accurate predictions.
They care about keeping their jobs, which requires scary climate predictions every year.
Accuracy does not matter.
So that’s what we get — scary, inaccurate predictions.
Coronavirus models behave the same way. Science is settled.
Richard,
We now know that the climate models are based on the wrong dynamical system of equations (see post on this site). Thus there is no reason to be surprised that they cannot be relied on for any meaningful conclusions.
Jerry
Geral B,
Is this what you are referring to:
https://judithcurry.com/2020/06/20/structural-errors-in-global-climate-models/
I guess WUWT did an article on it too, yes, and I missed it, or overlooked it.
Robert,
Yes. That manuscript mathematical proves what the correct dynamical system should be and discusses
why the hydrostatic system used by current climate and weather models is.wrong.
Jerry
On the subject of accuracy, it would be Dr. Spencer, not Mr.
So much focus on climate model “accuracy” is tied directly to the global temperature anomaly.
Indeed, temperature anomaly results on a smaller scale are a joke. But if you add-up all of those mistakes, you get to a reasonable answer for the entire globe itself. And that’s before you start even looking into other parameters like clouds, precipitation, etc.
It’s indefensible.
The progress of the IPCC with their upcoming AR6 is now with their CMIP6 they are failing even faster. That is a real acceleration of the Climate Lemmings rush to the cliff.
Obviously, CHIMP 6 models would outperform the CHIMP 5 ones, since 6 chimps is better than 5.
How many chimps does it take to screw up a model? Apparently 6.
They’re going to need millions of chimps banging on calculators to eventually produce an accurate prediction.
But who wants an accurate prediction? (I mean projection of course, because that’s a totally different synonym).
Just wait for CMIP8. By then it should be telling us that the Arctic Ocean is already boiling. We’ll have no choice but to listen if the oceans are boiling (and we’re in the climate concentration camps).
Oh dem models–use one gigo to kill the economy short time, and a group of gigos to destroy the economy for the long haul
Dr. Roy, you snergatroid, here in Argentina/Chile (both sides complained about the cold yesterday on WATTS) it’s official: The Andes snowpack is 60% greater than normal, so would you please stop messing with Global Warming as we are waiting for it to kick in. Thank you. I hope it’s not too late.
Snergatroid?
When I search this on Google, your post is the ONLY match. I think that may be the first time I have ever seen that (congratulations).
Rick, snergatroid is a Martian word that means “weather wizard”.
Ron, I live far enough north (just below the WI/IL state line) to experience some REAL climate strange.
So when I note that I still have my furnace running up to and including June 16 – it WAS that chilly – and there were winter snow warnings in western states like ID/WY/MT/SD/ND, never mind MN/WI/UPMI, I think you can understand why people like those chart-generating, dollar-hungry desk jockeys aren’t much more than a joke to people like me.
For the Midwest U.S. in the summer (June-July-August) we see that there has been almost no statistically significant warming in the last 50 years, whereas the CMIP6 models appear to be producing even more warming than the CMIP5 models did. – Models belong on the runway, wearing size 0 clothing and simpering along wearing far too much makeup and bad hairdoos. Models, my fat Aunt Harriet!
There must be something more important to spend that grant money on, like building a better furnace or a more fuel-efficient rowboat. At some point, this all becomes laughable.
““global warming” did not really begin until the late 1970s. Prior to that time”…temperatures were going down
Go back to the 1930s or even 1950s and I think one will find that the Midwest is cooler today.
Dr. Spencer’s observations about CMIP6 average and the threatened midwest food supply reminded me Of my very first guest post here back in 2011, ‘NRC’s Midwest Climategate’. It dissected a provable gross NRC misrepresentation to Congress of a single study that was itself grossly intentionally flawed by deliberately omitting a crucial correlation variable from the regression (hint, Corn does fine in extreme heat with sufficient moisture, but not in extreme heat with drought).
very few people know that we grow corn in South Florida….zone 10
Regards, Latitude, from Ft.Lauderdale to the Keys.
I both knew that, and gave the reason why. Rains almost every day in Hot summer In South Florida. And that term was DELIBERATELY ( for a nonsensical reason) omitted from the multivariate regression in the flawed paper then misrepresented by NRC.
Unless I’m grossly misinformed, corn grows very well in hot Mexico (where it doesn’t rain every day). And it grows even in Quebec, Ontario, and Manitoba.
So how is it rational for anyone to be concerned about a few degrees change in average temperature affecting corn harvests? There must be a 20 degree C range across the regions where corn grows.
I remember back when it was called global warming, the alarmists were claiming that the so-called corn belt would move north to the less fertile lands up in Canada. There were two things the hand-wringers didn’t think about. First, corn is a tropical plant. It can grow anywhere from the Equator out to the temperate zones north and south–as long as there is sufficient moisture and nutrients. Second, corn is a hybrid. The varieties grown in the Pacific Northwest aren’t the same as the ones grown in the Midwest, in Florida, or Mexico. I doubt that a slow moving temperate zone will outpace the seed producers.
A more correct statement would be that the corn belt will expand to the north in a warming world–but that’s not as scary.
Jim
Running 5F – 10F below the historical mean so far, here in the Great NorthWet of western Washington state. My lawn is still squishy, as we are 20% above the historical mean rainfall for the year. Cool and wet, for the 4th of July? Ugh!
Send Global Warming… NOW!
J Mac & Sara: running normal T in South Cackalack and 92% above “normal” precip. Used the fireplace twice in June, was nice!
https://w2.weather.gov/climate/index.php?wfo=gsp
“the news media have been complicit in the destruction of rational climate debate”
They’ve been complicit in suppressing rational debate on every issue that divides the left from the right and almost without exception, promotes the left position as righteous and the right position as evil. This kind of juxtaposition can easily sway gullible minds, even when the exact opposite is true, which has become more and more frequent lately.
As a libertarian I don’t care for Democrats or Republicans both want big government.
Every night we watch two very different versions of the news — a half hour of ABC National News and a half hour of Fox News, usually Tucker Carlson.
If I disagree with a Republican they want to debate … But Democrats assert, and don’t debate anything they believe in for more than 30 seconds before ridicule and character attacks begin.
It is amazing how different the news is on the two TV channels.
As a libertarian since the 1970s, I been disappointed by how few Americans want a smaller government and more freedom.
And how easily Americans can be frightened by politicians, into demanding that government bureaucrats seize more power and solve the problem.
The alleged problem does not even have to be real, such as the coming climate crisis, coming since the 1970s, but it never shows up !
My climate science blog, with over 60,000 page views: http://www.elOnionBloggle.Blogspot.com
Cereal production in the US has doubled since the 7O’s.
Cereal yields nearly tripling.
Dam you climate change!
Here in central Virginia, the year has been slightly cooler than usual. The first three months were warmer by 3.1, 1.7, and 3.7 degrees F, while the succeeding three months were cooler by 4.6, 5.7, and 2.1 degrees respectively. Nothing was wildly off (such as a recent February that was about 9 degrees below the long-term average), but definitely the winter was a bit mild and the spring a bit cool. From all the hysteria, I would have expected some 100-degree days as early as May (actually, none yet this year). I am in Mechanicsville, which to my knowledge lacks an official weather station, and I compare the temps from my thermometer with those expected in Richmond, 12 miles southwest of here; obviously, the urban heat island effect is more pronounced there, which could explain part of the departure here. Just a tiny anecdotal note.
There is no discernible trend at all in the NOAA data there when accounting for time-series correlation and associated effects on effective sample size and degrees of freedom for determining significance. This is moot anyway if reporting a trend exists at 1 sigma; yikes.
Midwest has another more serious problem, it has the most rapidly declining magnetic field anywhere on the planet, loosing about 10% since 1980.
http://www.vukcevic.co.uk/USA-MF.htm
Whole of the USA has rapidly declining magnetic field intensity centred on the Midwest as shown on this map of annual rate of change of total intensity
http://www.geomag.bgs.ac.uk/images/igrf/dFcolourful.jpg
Vuk–does that mean that the USA will soon fly off the planet and solve much of the world’s problems??
Certainly not, however at the present rate of decline of 1 microTesla/decade in about two centuries (or could be sooner) the USA MF intensity would be on the par with that of the South Atlantic Anomaly which has and it is causing serious problems to satellite related technology.
Wikipedia: “The South Atlantic Anomaly is of great significance to astronomical satellites and other spacecraft that orbit the Earth at several hundred kilometers altitude; these orbits take satellites through the anomaly periodically, exposing them to several minutes of strong radiation, caused by the trapped protons in the inner Van Allen belt. The International Space Station, orbiting with an inclination of 51.6°, requires extra shielding to deal with this problem. The Hubble Space Telescope does not take observations while passing through the SAA.
Passing through the anomaly caused false alarms on Skylab Apollo Telescope Mount’s solar flare sensor. Astronauts are also affected by this region, which is said to be the cause of peculiar “shooting stars” (phosphenes) seen in the visual field of astronauts, an effect termed cosmic ray visual phenomena. Passing through the South Atlantic Anomaly is thought to be the reason for the failures of the Globalstar network’s satellites in 2007.
NASA has reported that modern laptops have crashed when Space Shuttle flights passed through the anomaly.
In October 2012, the SpaceX CRS-1 Dragon spacecraft attached to the International Space Station experienced a transient problem as it passed through the anomaly.
The SAA is believed to have started a series of events leading to the destruction of the Hitomi, Japan’s most powerful X-ray observatory. The anomaly transiently disabled a direction-finding mechanism, causing the satellite to rely solely on gyroscopes that were not working properly, after which it spun itself apart.”
well—my question was actually facetious, but I do appreciate your detailed response.
One thing that Dr. Spencer didn’t point out is that for for every region with little cooling there must be a region with extreme warming to make the average come out. It appears the Midwest is about 0.4°. There would need to be an equivalent area of warming at 2.6° to get an average of 1.5°. From my research, this simply isn’t happening.
CIMP6 is going to make this even worse.
Of course it gets pejoratively cast off as “anecdotal evidence,” an oxymoron, but I have heard first hand (mother-in-law) about evidence of the severity of the 1930s heat in Oklahoma, as in leaves in the few trees falling off in mid summer. The drought of the 1950s in Texas, which I experienced, was meteorologically [Bomar, Texas Weather and others] recorded as worse than the 30s. I remember the heat and heard first hand evidence, as in death of cattle, although some thought that they were the same drought just interrupted. A decade ago Texas had the first serious drought since the 50s, but didn’t last nearly as long, haven’t found a good comparable account yet. Texas seems wetter since the 50s, certainly more trees, and if recall is correct also verified. Stars at night may not be as good now, not entirely due to light pollution.
“A decade ago Texas had the first serious drought since the 50s, but didn’t last nearly as long”
That was a decade ago, wasn’t it! Time flies.
That drought and heatwave (2010-2011), which lasted about two years, was as severe as anything I have seen in my lifetime. The Alarmists were in hog heaven. But then it went away and we had some very heavy rains that took the whole area out of drought.
And then there was last year when Oklahoma had record-breaking rains as the storm fronts just kept coming one right after another, right over the same area.
Now western and central Oklahoma are in a little bit of a drought, that’s working its way east, barring some good rains. It’s getting hot here now, which is usual, but we still have moisture passing through so there are chances for rain. It used to be pretty unusual to have much rain in July in Oklahoma. It’s usually hot and dry, but the weather seems to be moderating after about 2011. It’s getting dry enough to start hoping for rain.
We have about a month and a half of real hot weather to go this summer, and then the heat should break around the middle of August.
Happy Fourth of July to all the Americans out there. People are already setting off fireworks here tonight.
I like the NOAA site Roy linked. Been playing on it a bit. Here in midwest MI (with trend displayed) we are only at +1.8°F (about +1.1°C) per CENTURY! Statistically significant? No way Jose.
https://www.ncdc.noaa.gov/cag/statewide/time-series/20/tavg/1/5/1895-2020?base_prd=true&begbaseyear=1901&endbaseyear=2000&trend=true&trend_base=100&begtrendyear=1895&endtrendyear=2020&filter=true&filterType=binomial
What would goofy GISS and balmy BEST say we are at? Some damn hockey stick value no doubt. GISS says +1.1°C per 3 decade span! There are no hockey stick graphs anywhere on NOAA’s Climate at a Glance site choices. NASA needs to get out of climate and concentrate on space… the sooner the better. Even NWS is more accurate.
Station data for the USA and Australia show warming in nighttime daily Tmin and not in daytime daily Tmax. Also the warming is found mostly in the winter months and not in the summer months. That seasonal pattern is also seen in the Central England temperatures.
https://tambonthongchai.com/2019/02/12/australia-climate-change-daily-station-data/
https://tambonthongchai.com/2018/04/05/agw-trends-in-daily-station-data/
+100
“Based upon the observations, “global warming” did not really begin until the late 1970s. Prior to that time, anthropogenic greenhouse gas emissions had not yet increased by much at all, and natural climate variability dominated the observational record (and some say it still does).”
wrong.
assertion with no evidence.
Well. OK. But, couldn’t that argument be made about every single paper ever produced based on the output of climate models?
”wrong. assertion with no evidence.”
Wrong. Plenty of evidence.
Fig 9 500hPa
https://agupubs.onlinelibrary.wiley.com/doi/full/10.1029/2004JD005753
Masher
20,000 years of global warming.
How much of that warming was from man made CO2?
If you have the answer, then show it to us !
4.5 billion years of climate change from natural causes.
When did natural causes stop … and man made CO2 suddenly became the “temperature control knob?
If you have the answer, then show it to us !
Without logical answers, your climate change beliefs, and most of what you post here, are unproven assertions with no evidence.
We plant and grow crops like corn in tightly packed rows that are now twice as dense as they were 40 years ago. This has resulted in a micro climate in the Midwest, several weeks after the majority of the corn plants have emerged. The massive increase in evapotranspiration from these plants, has increased low level moisture, with dew points in some situations, more than 5 deg. higher over several states.
This is affecting numerous other elements.
1. More daytime heating from the sun goes into evaporation and humid air masses have a higher heat capacity, so daytime Maximums are lower.
2. At night its just the opposite. Minimums are often set by how low the dew point is. If the dew point stays above 75, the lowest temperature will never drop to 75, for instance.
3. Increased low level moisture will increase instability of the air mass. More thunderstorms, potentially more severe/intensity.
4. Increased low level moisture from evapotranspiration will be provide additional water vapor for weather systems to generate rains more often, along with heavier amounts. This becomes part of a positive feedback loop. More rains=more soil moisture………..more soil moisture/corn=more evapotranspiration=higher dew points=more rains.
Then we start if all over again.
Here’s more:
Corn and climate change
https://www.marketforum.com/forum/topic/18987/
The positive feedback loop above should have started with………..more corn =more evapotranspiration=higher dew points=more rain=more soil moisture=more evapotranspiration……and so on.
In the good old days people producing this king of weather prediction would be tarred and feathered and run out of town.
Today we have a legal system .
The skeptics should sue the climate modelers non-scientists to be proven in the cord of law their models are invalid and the predictions are false . The problem is the skeptics, despite having all the evidence, are totally inept when it comes to confronting the alarmists.
Eben
There is now a mathematical proof that the climate models are based on the wrong dynamical system of equations ( and that is even before discussing continuum errors in the parameterizations and excessive dissipation). See thread on this site called “Structural Errors in Climate Models” and the associated peer reviewed manuscript. I was going to title it “Dubious claims by the IPCC based on flawed climate models”.
Jerry