Reposted from Dr. Judith Curry’s Climate Etc.
Posted on June 28, 2020 by niclewis |
By Nic Lewis
The course of the COVID-19 pandemic in Sweden is of great interest, as it is one of very few advanced nations where no lockdown order that heavily restricted people’s movements and other basic freedoms was imposed. As there has been much comment, some of it ill-informed, on how the COVID-19 epidemic has developed in Sweden, but relatively little detailed analysis published in English, it is worth exploring what their excellent publicly-available data reveal.
I present here plots of weekly new cases and deaths, with accompanying comments. I have been able to access detailed daily data from 2 April on.[1]
Overall development of the epidemic
Figure 1 shows the overall picture for confirmed weekly total new COVID-19 cases, intensive care admissions and deaths in Sweden. The dashed line normalises new cases by the dividing by the number of tests carried out each week, relative to those for the week to 10 April. Both actual and normalised weekly new cases have been divided by 10 in order to make their scale comparable to that for ICU admissions and deaths.

Fig. 1 Total weekly COVID-19 confirmed cases, intensive care admissions and deaths in Sweden
Several points are noteworthy:
- Recorded new cases continued rising until mid-April, and after gently declining from then until late May have doubled since then. All or most of that increase appears to have been be due to a decision on 5 June to expand testing. By the end of June testing was at about double the rate in May, which in turn averaged approximately 25% higher than in April.
- Allowing for the increase in testing over time, the incidence of COVID-19 appears to have declined by about 30% from mid-April until the late May and has since remained broadly stable.
- Deaths peaked in mid-April and have fallen by two-thirds since then.
- It follows that the infection fatality rate has fallen substantially since early in the epidemic.
- Deaths have been remarkably high in relation to confirmed cases. To a substantial extent this reflects Swedish policy of focussing testing in hospital, where the disease is severe, prior to June. It also reflects the spread of infections to care homes, where death rates are very high, relatively early in the epidemic.
- Far more people have died than have been put into an intensive care unit (ICU). This likely reflects a combination of deaths outside hospital and an apparent Swedish policy of not generally putting people aged 80+ into intensive care.[2] For admissions before late April, 49% of 70+ year old patients (who only comprised 15% of total ICU patients) died, and most of those were people in their seventies, for whom the prognosis is much better than for older patients.
Analysis by age group
The changing age composition of new cases over time is shown in Figure 2. The number of cases among people aged 70+ has been declining since mid-April. Until the end of May this more than countered gently rising infections in age groups younger than 60, with infections among 60-69 year olds broadly stable. But since then confirmed infections in people under 60 have rocketed, and there has also been a noticeable increase in infections among people aged 60-69.
It is likely that the bulk of these increases simply reflect the widening of testing in June. The total number of tests in the latest week was double that four weeks previously. The Swedish Public Health Agency estimates that the current reproduction number, Rt, in Sweden during mid- June was approximately 0.9, implying a decline of about 10% a week in the true number of new infections. However, comparing Figures 1 and 2 suggests that while infections in the oldest age groups are reducing steadily, this is being counterbalanced by an increase in infections among young people, resulting in little overall trend in the total number of infections.
Fig. 2 Weekly COVID-19 confirmed cases by age group in Sweden
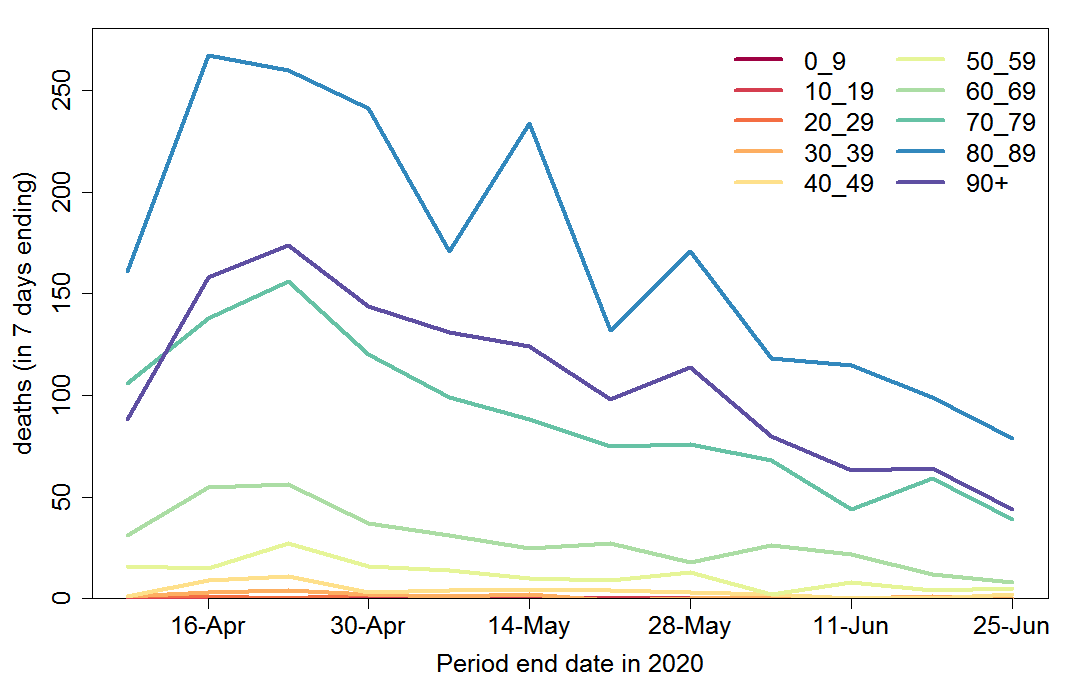
Weekly COVID-19 recorded deaths have declined very substantially since mid-April, across all age groups (Figure 3). The data show the number of people with confirmed COVID-19 who died, regardless of the cause of death.
Fig. 3 Weekly COVID-19 recorded deaths by age group in Sweden
Figure 4 shows weekly deaths by age group as a proportion of new cases two weeks previously. Since most cases are only confirmed after hospitalisation, the average delay from a case being confirmed to death occurring is around two weeks.[3] This ratio therefore should provide a reasonable estimate of the hospital case fatality ratio (CFR). It has declined substantially for all age groups, albeit proportionately less for ages 80+, where it remains very high, although not unusually so.
The estimated hospital CFR for ages 50–69 has declined by an order of magnitude, while that for ages 70–79 has declined by a factor of three. The reasons for this extremely welcome trend are not entirely clear. Much of the reduction over the last few weeks is very likely due to a widening of the testing regime to include milder cases of disease, with more cases now being found outside hospitals.[4] Nevertheless, a good part of the decline is likely real: most countries have seen a decline in the hospital CFR over time.

Fig. 4 Weekly COVID-19 deaths by age group in Sweden as fraction of new cases 2 weeks before
Infection fatality rate over time
The decline in total deaths (Figure 1) is to a fair extent due to the changing age composition of new cases, as well as a moderate reduction in total infections, with an increasing proportion of cases among younger age groups and a substantial decrease at ages 80+, which account for most deaths. But within some of the key older age groups, which account for the vast bulk of deaths, the number of deaths (Figure 3) appears to have dropped in relation to the number of cases as adjusted for the widening of testing – certainly for ages 60-69.
The Swedish Public Health Agency estimated the infection fatality rate (IFR), based on a selection of confirmed cases that have been tested in Stockholm County and who fell ill on March 21-30, 2020, after adjusting by the estimated proportion of infections that resulted in confirmed cases.[5] Of all people who they estimated to be infected with COVID-19 around the second half of March, 0.58% died.[6] In the group At age 70 and over, mortality was 4.3% (1.9% for ages 70-79) , while it was 0.09% for persons younger than 70 years.[7] [8] The overall deaths were pushed up by the spread of infections to care homes, residents of which accounted at that point for 40%–50% of total deaths.
The order of magnitude decline in COVID-19 CFR at ages below 70 since mid-April implies that, even assuming that all the change in confirmed cases between early April and mid June is due to the three-fold expansion of testing, the IFR below age 70 is now much lower than the previously estimated 0.09%. The data indicate a current level of circa 0.015%. Even for ages 60-69, where the IFR for infection in mid-March was estimated at 0.45%, the implied IFR is now little over 0.1%.
It is not clear what has caused such a large reduction in IFRs for COVID-19 at ages below 70 years. Sweden is not the only country in which the IFR appears to have declined. There is little evidence of the SARS-CoV-2 virus having mutated and become less damaging. However, treatment of serious cases has no doubt improved; less use of invasive ventilation could be one factor here. Seasonal factors may also play a role. The body’s ability to fight infections and heal damage appears to be affected by sunlight exposure, with vitamin D and nitric oxide pathways perhaps both being involved.
Another important factor in the decline in the IFR over time could be population heterogeneity in susceptibility to COVID-19 infection, in particular variability arising from biological rather than social connectivity factors. More susceptible individuals may not only be more likely to succumb to COVID-19, but more likely to die of the disease once infected. Since more susceptible individuals will tend to become infected earlier in the epidemic than less susceptible individuals, a correlation between susceptibility to infection and risk of death if infected would automatically lead to the IFR declining over the course of the epidemic.[9]
Regional analysis
I turn now to regional analysis. Figure 5 shows weekly confirmed new cases for each of the 21 regions in Sweden. Although widening of testing varied between regions, it is evident that Västra Götaland dominates the overall increase in cases over time. However, the increase in testing during the first half of June appears to have been much larger in Västra Götaland than elsewhere, so the true increase in disease incidence is likely far smaller than the increase in confirmed cases suggests. Cases in Jönköping also rose sharply in June, albeit from a much lower level. Cases in the Stockholm region remain high.
Tracking serious cases only, so as to adjust for the widening of the test regime, comparison of the latest analysed week (24 – week ending19 June) with the average of the previous three weeks shows an increasing number of cases in Västernorrland, decreasing numbers in Jönköping, Stockholm, Sörmland, Uppsala, Västra Götaland and Östergötland, and an unchanged number for other regions.[10]

Fig. 5 Weekly COVID-19 confirmed cases by region in Sweden
Regions have varying populations, so confirmed cases per 100,000 head of population give a better picture of relative disease incidence (Figure 6).

Fig. 6 Weekly COVID-19 confirmed cases per 100,000 head of population by region in Sweden
Deaths by region are shown in Figure 7. They are dominated by deaths in Stockholm region, which continue to be higher than elsewhere, although since mid-May deaths in Västra Götaland have become a much more substantial proportion of the total.

Fig. 7 Weekly COVID-19 recorded deaths by region in Sweden
The very large and almost monotonic decrease in deaths in Stockholm region, confirms that the less steep decline in cases from mid-April to the end of May (which occurred despite some increase in testing) is genuine. As already indicated, the sharp increase in confirmed cases in June is an artefact produced by the widening of testing; serious cases decline in Stockholm county.
Prevalence of COVID-19 infections
Analysis of samples collected at week 21 (late May) shows that antibodies were detected at 6.3% of the studied population. Seroprevalence remains lowest among adults 65-95 years (3.9%), compared to adults 20-64 years (7.6%) and children 0-19 years (7.5%). The Stockholm region had the highest proportion of antibody positive (10%) followed by Skåne (4.5%) and Västra Götaland (2.7%). The number of collected samples for other regions were less than 100 and therefore cannot provide reliable results.[11]
Cumulative confirmed cases as a proportion of population up to the end of week 19 (15 May), who would be expected to develop antibodies by early in week 21, were 0.32% for the whole of Sweden, 0.47% for Stockholm region, 0.11% for Skane and 0.29% for Västra Götaland. So, up to mid-May, if the foregoing prevalence estimates are correct then confirmed cases represented about 1 in 20 of people who had developed antibodies to the SARS-CoV-2 virus, but with an inter-region range of at least 1 in 40 to 1 in 10.
However, previous results showed higher prevalence, and prevalence cannot decrease over time. A fairly large sample study that sought response from a random sample of households in the Stockholm area obtained 446 valid results from tests on an average date of 11 April (week 16), reflecting infections up to late March. It found 10% prevalence.[12] And a study based on blood donors showed about 11% had developed antibodies in mid-April, although the sample size was only 100.
Moreover, the antibody tests used appear to have a sensitivity of only 70-80 percent, so 20-30% will test negative even though they have been infected. But the tests have 100% specificity – no one will test false positively.[13] There is no indication that any of these seroprevalence results have been adjusted for the relatively low sensitivity of the test used. So it seems likely that in all cases the true prevalence was 25-43% higher than that reported.
Many people with mild COVID-19 symptoms or asymptomatic infection probably do not develop antibodies in their blood, either developing antibodies only in their mucus or not at all. Antibodies are only one component of the adaptive immune system, and immunity conveyed by the development of SARS-CoV-2 specific T-cells may be more important; it is likely to be longer lasting.
Having regard to all these factors, it seems entirely possible that 20% rather than 10% would be a better estimate of the proportion of the population of Stockholm region that had been infected by late May.
Future outlook
It seems clear from the trend in cases since then that, as I intimated previously[14], by mid- April the herd immunity threshold had been reached in Stockholm county. Moreover, both there and in Västra Götaland, the two regions that have dominated deaths to date, deaths have been declining since mid-May. Regression of the logarithmic change in deaths over the last seven weekly data points gives similar results in both regions. The fits are good[15] and the slope estimates, averaging them, imply that each week’s death figure is only 81% to 86% ( at ± 1 standard error) of the previous week’s figure. Skåne, the next largest region by population, also has a downward trend in deaths, but the regression fit is less good and the slope estimate is not significant (p = 0.1). Those three regions make up 53% of Sweden’s population. For Sweden as a whole the fit is as good as for Stockholm country and Västra Götaland , with a slightly slower rate of decline: each week’s estimate deaths are 84% to 88% of the previous week’s. This range is slightly below the R value in mid-June estimated by the Swedish Public Health Agency, which has fluctuated around 0.9. The difference is likely to reflect the declining proportion of new cases made up by older age groups (Figure2) and the declining infection fatality rate for ages under 70.
If the estimated logarithmic rate of decline in weekly COVID-19 deaths in Sweden seen over the last six weeks continues, only about 1,100 further deaths would occur. That would bring total deaths up to approximately 6,400, or 0.06% of the total population. Of the first 4,500 deaths, some 40% involved people living in care homes,[16] a slightly lower proportion than earlier in the epidemic. To date, the average age at death was 82, and in only 6% of cases did a death not involve a co-morbidity (other health condition).
Conclusions
Notwithstanding that a month ago antibodies were only detected in 6.3% of the Swedish population, the declining death rate since mid-May strongly suggests that the herd immunity threshold had been surpassed in the three largest regions, and in Sweden as a whole, by the end of April.
In the absence of a change in trends, it seems likely that the epidemic will peter out after a thousand or so more deaths, implying an overall infection fatality rate of 0.06% of the population (0.04% excluding COVID-19 deaths of people in care homes). This is broadly comparable to excess deaths from influenza infections over two successive above-average seasons, such as 2016–17 plus 2017–18.[17]
The absence of a lockdown order, with the government largely trusting people to make their own individual decisions regarding their behaviour, informed by their particular circumstances, has enabled life to continue with less disruption and reduction of people’s autonomy in Sweden than in most other western European countries. While this has also meant that COVID-19 deaths to date have been higher than in some (but not all) other countries in which a lockdown was imposed, the wider spread of the epidemic in Sweden means that the future COVID-19 outlook there is better.
The herd immunity threshold is likely lower at present than it would be if people were behaving completely normally; it may also be seasonally lower. However, the continuing spread of infections since the peak of the epidemic, particularly among young people, should provide some margin of safety against its resurging when behaviour returns closer to normal and summer ends. That is, there is less risk of a second wave of the epidemic next winter. And if a second wave occurs, fewer measures should be needed to control it than in other countries.
Nicholas Lewis
Originally posted here, where a pdf copy is also available
[1]On 2 April 2020 the cumulative number of cases was only one-twelfth its current level, and only 5% of the deaths recorded to date had occurred. Updated data for 19, 20 and 21 June were not prepared. In order to avoid these days and plot as many weeks as possible, I use data for Thursday 2 April 2020 and each 7 days thereafter, ending 25 June. For consistency between the breakdowns by age and region, I use the data as originally reported on each date, not the final adjusted daily figures (which are not reported by age group). There is some lag in reporting, particularly for deaths.
[2] Such a policy would be understandable, as the prognosis for 80+ year-olds given invasive ventilation in ICUs is extremely poor, with many of those who do survive then having a poor quality of life.
[3] The average delay between a case being confirmed and death occurring is 12 days. (https://www.folkhalsomyndigheten.se/publicerat-material/publikationsarkiv/t/the-infection-fatality-rate-of-covid-19-in-stockholm-technical-report/) However, there is a significant delay between sickness arising and cases being confirmed. On average, it takes 11 days between sickness and the start of intensive care.
[4] The earlier increase in testing, from mid-April to mid-May, appears to have largely been targeted at, and detected more cases in, health and care staff. In week 20 (mid-May) the proportion of confirmed cases comprised of healthcare and care staff was as high as 74% in the Kronoberg region. https://www.folkhalsomyndigheten.se/globalassets/statistik-uppfoljning/smittsamma-sjukdomar/veckorapporter-covid-19/2020/covid-19-veckorapport-vecka-20-final.pdf
[5] They assumed that the estimated infections were spread evenly over the population of the Stockholm region, that is an age-independent atack rate.
[6] Measuring instead by the number of excess deaths in the relevant period over the estimated average number suggests a slightly higher overall mortality rate of 0.7%. However, mortality earlier in the 2019-20 winter period was lower than average, as it also was in the 2018-19 winter, so there were probably more than usual very old people likely to die from infection when COVID-19 struck. By week 23 (week ending 5 June 2020) the difference between the two measures was only about 10% (4,811 vs 5,353). (https://www.folkhalsomyndigheten.se/globalassets/statistik-uppfoljning/smittsamma-sjukdomar/veckorapporter-covid-19/2020/covid-19-veckorapport-vecka-25-final.pdf)
[7] https://www.folkhalsomyndigheten.se/globalassets/statistik-uppfoljning/smittsamma-sjukdomar/veckorapporter-covid-19/2020/covid-19-veckorapport-vecka-24_final.pdf
[8] https://www.folkhalsomyndigheten.se/contentassets/53c0dc391be54f5d959ead9131edb771/infection-fatality-rate-covid-19-stockholm-technical-report.pdf
[9] If much of the variability involved arose from whether and how many cross-reactive T-cells – such as arise from previous exposure to common cold coronaviruses – an individual possessed, the much smaller decline in IFR for 70+ age groups might perhaps be due to the T-cell senescence that occurs in old people.
[10] https://www.folkhalsomyndigheten.se/globalassets/statistik-uppfoljning/smittsamma-sjukdomar/veckorapporter-covid-19/2020/covid-19-veckorapport-vecka-25-final.pdf
[11] https://www.folkhalsomyndigheten.se/globalassets/statistik-uppfoljning/smittsamma-sjukdomar/veckorapporter-covid-19/2020/covid-19-veckorapport-vecka-24_final.pdf
[12] https://www.kth.se/aktuellt/nyheter/10-procent-av-stockholmarna-smittade-1.980727
[13] https://www.svt.se/nyheter/inrikes/11-procent-av-stockholmarna-har-antikroppar-mot-covid-19
[14] https://judithcurry.com/2020/05/10/why-herd-immunity-to-covid-19-is-reached-much-earlier-than-thought/
[15] The R-squared is close to 0.90 in both cases.
[16] https://www.folkhalsomyndigheten.se/globalassets/statistik-uppfoljning/smittsamma-sjukdomar/veckorapporter-covid-19/2020/covid-19-veckorapport-vecka-22-final.pdf
[17] https://www.folkhalsomyndigheten.se/contentassets/4b4dd8c7e15d48d2be744248794d1438/rapport-overdodlighet-vecka-23-2020.pdf
I am taking Vitamin D3 x 6 tablets & 1x K2 tablet plus 4x Vitamin C tablets daily. Haven`t had a cold or cough for a very long time. I am glad as you folk have written here, that it is a solid defense against COVID -19.
This data and Nick’s analysis is interesting. I would be careful about making any conclusions at this time, but I would say that the trends are encouraging. I believe that we can also say with high confidence that mere exposure to this virus is not a death sentence for most of the population and that long, severe lock-downs were not necessary. All of the long term economic and social harm that the lock-downs have caused will be blamed on the virus by many, but in actuality it is all due to the overreaction to the virus by our leaders.
the Swedish statistics authority cannot be trusted.
Statistics that are unpalatable in that country do not exist any more.
It’s the China of Europe, where censorship is so bad that it needs not be enforced. Researchers who do honest research on topics like immigration, get attacked by the media and politicians.
When journalists get attacked by migrant mobs, everyone comes out of the woodwork to attach and mock the victim of the assault.
What we are seeing with the pandering to BLM< well, take that and put it on steroids, that's Sweden
OK, for the sake of the argument let’s assume that’s true.
1) Which “authorities” can be “trusted” to supply “honest” mortality data for Sweden (or anywhere else) ?
NB : Please provide links to regularly updated data sources.
2) If the answer to question 1 is “Nobody”, how can you (second-person singular) possibly know how “bad” (/ “good”) the situation “really is” in Sweden (or anywhere else) ?
If you are an authoritarian dictatorship you just use your soldiers as guinea pigs:
https://www.reuters.com/article/us-health-coronavirus-china-vaccine-idUSKBN2400DZ?fbclid=IwAR3fDgDLWuApjIHvloKyFRhN9jPJiuo4qeTjusARfzggWw5_iIkxnOK1KFs
Thank you for an informative article. Some comments to date have been quite insightful. Not to lose sight of the principle point as to whether lockdowns imposed in countries, other than Sweden, have been more effective at containing the contagion I pass on this sad news from here in Ontario courtesy of the Toronto Star:
The National Institute on Aging says that as of May 6, 3,436 residents and six staff members of long term care settings had died of COVID-19, representing 82 per cent of the 4,167 deaths reported as of Wednesday.
Dr. Samir Sinha, research director at the institute, says it is a staggering figure, given the roughly 400,000 residents living in care homes represent just one per cent of Canada’s population.
And it is a much higher figure than was indicated in a study released days ago by the International Long-Term Care Policy Network.
It said people in long-term care accounted for 62 per cent of Canada’s COVID-19 deaths. It also found Canada has the highest proportion of deaths from COVID-19 in long term care settings among 14 countries.
Sinha’s team compiled data from long-term care residences, nursing and retirement homes, public health units and the provinces.
Ottawa has not released national data on the exact number of deaths in the long term care sector.
However, chief public health officer Dr. Theresa Tam confirmed Thursday that about 81 per cent of deaths are “linked to long term care facilities.”
Clearly the stable doors were locked down after all the horses had bolted so far as aged long term residents were concerned. I wonder if this is reflective of government actions in other jurisdictions and what it says about current government lockdown effectiveness.
This article is very misleading. The ONLY way to see if Sweden is doing well with no lockdown is to look at the other Scandinavian countries. Deaths per million for Sweden so far is 525, where as is Denmark 104, Finland 59, and Norway is 45. By this measure alone Sweden had killed 10 times more people than Norway who had strict lockdowns early.
Cases per million shows Sweden is the WORSE of all EU countries. Current as of today 6,700 per million. The next country down from them is Spain and Belgium at 5,300. Looking at a graph of cases per million over time, every EU country has leveled off, while Sweden continues to rise exponentially.
Looking at the rate of tests finding cases is very high for Sweden at 8.3%. Out of 100 tests they are finding 8 who test positive. Compare that to Finland, Norway and Denmark (0,5%, 0.4% and 0.2%). This means those latter countries succeeded, because of lockdown, in slowing the spread to a trickle.
One also has to be careful when using Swedish data. They have not been reporting on the weekends, catching up on Tuesday. Friday is the best day to see what the over all trend is.
As for herd immunity? Dont count on it.
https://hub.jhu.edu/2020/04/30/herd-immunity-covid-19-coronavirus/
Were COVID-19 Lockdowns Worth the Cost?
The evidence suggests Americans are right to wonder.
Jacob Sullum6.29.2020 4:40 PM
https://reason.com/2020/06/29/were-covid-19-lockdowns-worth-the-cost/?utm_medium=email
What would the cost have been for not locking down? Far far worse.
https://foreignpolicy.com/2020/04/01/coronavirus-pandemic-war-games-simulation-dark-winter/
Brazil is going to experience worse case.
Plus:
Lockdown and school closures in Europe may have prevented 3.1m deaths
https://www.imperial.ac.uk/news/198074/lockdown-school-closures-europe-have-prevented/
It shows that the professionals running Sweden are just that bit smarter than the fruit loops running the rest of the world. For people waiting to die in nursing homes dying from natural causes a bit earlier than they might otherwise have done is no crime – destroying the global economy to prevent that is, and amounts to anarchy.
How many years of early loss of one’s life does it take to be a “crime”? 2 years, 5 years, 10 years? By your logic we should just end elderly people’s lives at 80. What’s the point in keeping them alive consuming resources? #BoomerRemover right?
Isnt the role of medicine to preserve life as long as the patient wants? You think not one of these patients wanted to live longer?
Rather callous of you to not care what the patient wants.
This was supposed to be “spreading the curve” with the intention that when you reach the end of the curve you have “herd immunity” with a 60-70% recovery rate.
Instead, what we have is a curve that was starved to look like “spreading the curve” but we were left well short of “herd immunity”, so the curve continues.