Guest Post by Willis Eschenbach
Around the world, both state and local governments looked at wildly exaggerated computer model projections of millions of virus deaths, declared a “State Of Emergency”, and foolishly pulled the wheels off of their own economies. This has caused pain, suffering, and loss that far exceeds anything that the virus might do.
The virus hardly affects anyone—it has killed a maximum of 0.1% of the population in the very worst-hit locations. One-tenth of one measly percent.
Ah, I hear you saying, but that’s just deaths. What about hospitalizations? Glad you asked. Hospitalizations in the worst-hit areas have been about three times that, about a third of one percent of the population. Still not even one percent.
But on the other hand, more than thirty million workers in the US are unemployed. That’s about twenty percent of the number of full and part-time employees. And that job loss affects the entire household, not just the workers.
And that doesn’t count the loss of life from increased suicides and from delayed medical diagnosis and procedures. Nor does it count the fact that some 20% of the lost jobs are not expected to return. And we have calls to mental-health hotlines skyrocketing, and domestic violence through the roof. In a most ironic outcome, we have hospitals and doctors going bankrupt, and thousands of nurses being furloughed, because “non-essential” medical procedures are forbidden. Then there are the huge financial losses, both to the economy and to the government.
And in a beautifully circular process, we have trillions and trillions of dollars borrowed by the government to try to offset some of the damages that the government just caused … these lockdowns are far, far more destructive than the virus. The virus damage is short-lived, but we and our children will be paying for decades for our stupidity in killing the economy.

It’s like … it’s like … well, about the only example I can think of which has equivalent idiocy is if a mosquito were to land on your head and you grabbed a sledgehammer to get rid of it …
So the first lesson of the emergency is, don’t kill your economy to try to delay or avoid a few deaths. It is possible to slow the spread of the virus without pulling the wheels off of the economy.
The next lesson of the emergency is, don’t put much trust in computer models.
The next lesson of the emergency is, don’t put doctors in charge of economic decisions. Especially Dr. Fauci. He’s been wrong about most aspects of this whole process. If you want someone to run a hospital, as a general rule you shouldn’t hire a doctor …
The next lesson of the emergency is the extreme importance of the ancient medical maxim of Hippocrates, a maxim that our dear Dr. Fauci apparently never heard of—“Primum non nocere”, which means “First, do no harm”.
The next lesson of the emergency is, quarantine the sick, protect the vulnerable, but do NOT quarantine the healthy. That’s madness.
Let me set aside what we’ve learned to return to the COVID19 emergency. The emergency everyone feared was exemplified by the reality that in some countries, the medical system was overwhelmed by the number of COVID-19 cases. The cause of this was that the cases came on too fast—the peak hospitalizations and deaths were packed into a week or two. Early on in the pandemic, this peak in the load on the medical system in Italy caused parts of the system to collapse under the weight of cases.
To prevent that peak load from crushing the medical system, it was decided in many countries to try to “flatten the curve” by slowing the spread of the virus. Note that the stated intention of flattening the curve was not to stop the virus. The declared goal was to decrease the number of new cases per day, not to decrease the total number of new cases.

Figure 1. The theoretical effect of “flattening the curve”.
In that manner, rather than having a sharp peak in medical need, the curve would be flattened out and hopefully the medical system would not be overwhelmed.
So … did this work? Hard to tell at this point. However, we do have one example of a modern country that did NOT shut down and kill their economy to fight the virus, which is Sweden. How are they doing? Here’s the comparison:

Figure 2. Deaths per ten million over time, for the hardest-hit countries.
As you can see, Sweden is in the middle of the pack—a bit better than the UK and Switzerland, same as the Netherlands and Ireland, and a bit worse than the US and France.
So if the lockdowns and the “shelter-at-home” orders are having an effect, you couldn’t tell it by looking at Sweden.
And to return to the question of lowering the peak and flattening the curve, here are the results from a number of countries. I’ll start with Sweden and the Netherlands, since per Figure 2 they are on the same path. I’m using the Complete Ensemble Empirical Mode Decomposition (CEEMD) method to remove the fluctuations due to incomplete data reporting on the weekends. See here and here for a discussion of the CEEMD method.

Figure 3. Daily deaths. The black/yellow line is the CEEMD “residual”, which is the value of the data with the weekly and other regular fluctuations removed.

Figure 4. Daily deaths. The black/yellow line is the CEEMD “residual”, which is the value of the data with the weekly and other regular fluctuations removed.
Both the Netherlands and Sweden are past the peak load on the medical system. Neither one was overwhelmed by that load. The difference is … Sweden did not pull the wheels off of its economy and drive millions into joblessness and despair. I know which path I prefer …
Here are the daily deaths of a number of other countries. I’ll start with Belgium, which is the hardest-hit country, and roll on down from there.


OK, so much for the countries. All are about a month past their peak. How about the US states? Here you go.

The spike in the New York data is from a single day’s reporting of a bunch of “overlooked” deaths in nursing homes. Bizarrely, Governor Cuomo ordered nursing homes to accept COVID-19 patients … so as you might imagine, the totally predictable nursing home deaths were concealed until their hand was forced.
I also note how resistant the CEEMD residual is to that single outlier data point of nursing home deaths. A better-guess solution would be to spread those deaths out over the earlier time, distribute by the number of non-nursing home deaths.


(In passing, let me note that Georgia started loosening the lockdown on April 20th, and there’s no sign of a “second peak” of deaths.)
Those are the hardest-hit states. However, not all of the hardest-hit states are past their peak. Here are the two states of the hardest-hit that are not past their peak.


Finally, to close the circle before discussing all of this, here are two views of the world deaths, one with and one without China. I left out China in one of them to see how much difference it made, because a) China’s numbers are big, and b) I don’t trust them one bit. Here are those two charts. It turns out that leaving out China makes very little difference.


So … given all of that, what can we conclude?
Well, first in importance, if medical care was outpaced by the virus in some location and there was an emergency, the peak of the emergency is over now. Yes, there are some states and countries yet to pass the peak. But by and large, and in particular for the hardest-hit countries as well as for the world as a whole, the peak of the medical load from the pandemic passed about a month ago.
And that means that in those states and countries, whatever chance we had to “flatten the curve” is GONE. The opportunity has passed. For most of the world, curve flattening is history.
And since we were sold this bill of goods on the basis of “flattening the curve”, and since we’re now well past any opportunity to do that, let’s remove the restrictions. Or as I’ve said for weeks, “End The American Lockdown Now”.
Of course, the local petty tyrants who have vastly expanded powers under the “emergency” want to hold on to them. So they’re now saying that we have something new to fear, a “rebound” or a “second peak” … me, I’ve said before that I think we will see very little in the way of any second peak, for a simple reason:
As Sweden has shown, the virus laughs at our pathetic western-style “shelter in place” regulations.
Too many people in “essential” jobs, too many deliveries, too many people coming and going from the households. Combine that with a very infectious virus, and the shelter in place will have little effect … and since it has had little effect when it was there, I say it will have little effect when it is removed.
Now, here’s my argument. The various local instant totalitarian rulers derive their power from the State of Emergency. But the emergency is past, we can’t flatten the curve now. We’re past that, which means there is no further emergency. So them holding onto that power now that the emergency is ended is illegitimate and illegal. It’s also in some cases unconstitutional.

Here’s what I’d do …
• In those countries and states that are past the peak, declare the emergency is over and open everything back up. Acknowledge that the chance to flatten the curve is gone, and revoke each and every emergency order. They are only valid for the duration of the emergency.
• Maintain some approximation of social distancing, on a voluntary basis.
• There are flareups in certain locations now, even with all of the regulationss. There will be flareups after the regs are removed. Get used to it. A flareup is not a second peak.
• Maintain personal sanitation on a voluntary basis. Wear a mask, wear gloves, wash hands, and for goodness sake, if you’re ordering bat soup, tell them to hold the bats …
• Once the majority of the pandemic deaths are over, establish a testing and contact tracing process to keep track of the virus.
• Test people entering the country. As far as I know, I get tested more going in to get my blood drawn than do people entering the US.
• Keep a close watch on the numbers to see if there is some kind of “second peak” developing. If and where that might happen, then in those areas that had trouble with the first peak, push policies that don’t kill the economy, and for heaven’s sake, quarantine the sick rather than the healthy.
• Encourage the vulnerable population (elderly with co-morbidities, immunocompromised, etc.) to self-isolate to some comfortable extent, to be extra vigilant in avoiding crowds, and to maintain a high level of personal sanitation.
Folks, the ugly reality is that every day we keep the now-useless lockdowns in place is another day of misery for a large chunk of the population. COVID-19 is now a part of the virus landscape. Let’s reclaim the power from the Federal, state, county, and city megalomaniacs who are issuing diktats and expecting everyone to obey.
END THE AMERICAN LOCKDOWN NOW!
Here, the unusual late rains have returned. We didn’t get one drop in February, which is usually wet, so these late rains are most wonderful.
Best to all, stay well,
w.
AFTERWORD: I note today that Matt Briggs, Statistician To The Stars, has a new post up entitled “There Is No Evidence Lockdowns Saved Lives. It Is Indisputable They Caused Great Harm“. His posts are always worth reading, and he actually is a statistician to the stars.
PS—When you comment, please quote the exact words you’re referring to. This prevents much misunderstanding and useless argumentation.
How come there are no results from November or December?
I’d argue the CDC has managed the curve by controlling the number and availability of tests.
The lies and BS are very thick. There are so many things that just don’t make sense.
The people who are dying of covid are the same people who have a high risk of death normally. All the virus does is push them over a bit sooner. The pandemic is a fraud and the response is a fraud.
It is even worse. No numbers from 2019, 2018, or 2017. A conspiracy, maybe?
Do check out some of the many lectures and videos (they are even cited by NIH) in the scientific journals, and on YouTube and many other platforms. D-lightful by renowned endocrinologist Michael F. Holick MD., PhD. He is probably the Worlds foremost expert in vitamin D and its relationship to holistic Human cellular biology.
I didn’t give a specific example of his work, because there are so many versions on so many platforms, and you may choose whatever suits your timescale, and availability in your locus. See Google/YouTube/ Bing/Elsevier or whatever.
I am D-lighted to point out, especially in this forum that once again “it’s The Sun wot did it !” Willie Soon in particular will be pleased about that for sure, that his “old pal Sol” could help eliminate the Covid Panic-demic !!!
Willis,
I am a bit late, and I saw there was a lot of comments about Sweden. As you mention Sweden are not dense and not homogenic, but not to the extent you mention. Right now we actually have a lot of cases up in the north and even in the mountain area where people go skiing. (The problem, after ski).
What else to mention.
From January 1st to March 15th death by date and total was 7.08% below the five year average.
From March 15th to May 1st it was 25% above average.
The Swedish government officially noted 2300 deaths to WC-19 during this period, but at the same time there was 4.300 death more than average. That is a misrepresentation of 43%. Numbers from SCB, responsible for statistics in Sweden.
Officially the health department has made very few tests. They know very little from how the spread actually has been advancing in Sweden. In my area, it’s one of the areas mostly populated of elderly people ! the spread has so far not reached but a very few cases. If it really get loose here it will be devastating. We don’t live by the coast !
From the outside comparing Sweden to other countries you need to also use the density. If you do you will see that no country is playing in the same league. I have my own rating, first deaths / million. Then devide by density and you get a fair rating how every country perform. a Low number is better. So where do we stand.
UK < 2, USA < 3, Spain 6, France < 4, Italy < 3, S. Korea 0.01, Hong Kong 0, Netherlands 0.8, Denmark 0.7, Finland 3, Norway 3, and Finally Sweden 13. Why is this a fair number ? Because the more dense the worse the spread. Even if you take the mountainous area in the north into account Sweden is about 9. Still in the bottom.
Swedish people actually do a lock down by themselves. They are more clever than their government. We have one person leading the Swedish governments response to this pandemic. His name A Tegnell. My neighbor are a friend of his old classmates. They say "He was the one with the worst performance in class all the time". "How the h-l can he have that position". "We don't believe one word he is saying". Well, you don't need to be a top performer to make a career in Swedish government. Point is ordinary people in Sweden are used to take care of them self. At least the over 50 and we really do. I bought my P100 Organic Vapor mask back at the beginning of Feb ! With organic filter. The one our doctors now are asking for and using. They are just 3 month's late.
If you want to compare Sweden, Compare with Portugal. They have the same population, smaller country and probably the same kind of spread but higher density. Still Sweden so far is at least 3 times worse. Should be the other way around !
Sweden now faces the consequences of bad leadership. Denmark, Norway and Germany. Will Open the borders and admit entrance from each other, but not Swedish people. We will be isolated because of the spread here !
You want a good example. New Zealand !
+10000
He wouldn’t listen to me and I doubt if he will listen to you, even though you live there.
Sweden aren’t the 9th worst in the world for deaths/million popultion for no reason.
My best guess was the Covid-19 virus was causing deaths in China in November 2019 and struck Europe and North America by December2019. It could even be earlier. The Covid-19 illness was confirmed as a pandemic by World Health Organization on March 11, 2020 – far too late to have any real effect. I think that is why Sweden Is no worse than many other countries. We will know more as the post-mortem of this disease unfolds.
AUTOPSIES REVEAL ‘STUNNING’ VIRUS NEWS
FIRST KNOWN US CORONAVIRUS DEATHS OCCURRED FAR EARLIER THAN PREVIOUSLY THOUGHT
By Evann Gastaldo, Newser Staff
Posted Apr 22, 2020 4:44 AM CDT
Updated Apr 22, 2020 6:42 AM CDT
https://www.newser.com/story/289905/autopsies-reveal-stunning-virus-news.html
Santa Clara County Public Health Department Director Dr. Sara Cody speaks during a news conference in San Jose, Calif., on Friday, Feb. 28, 2020. (Anda Chu/Bay Area News Group via AP)
(NEWSER) – Up until recently, the first COVID-19 death in the US was thought to have occurred in Washington state on Feb. 29. But autopsies have revealed two earlier coronavirus deaths in California, one on Feb. 6 and the other on Feb. 17, the AP reports. The San Francisco Chronicle calls it “a stunning discovery” that radically changes the timeline of the virus in the country and adds to other recent evidence that it was circulating in the US earlier than previously believed. “We know there was a person diagnosed in late January with the virus—but to have at least three people right around the beginning of February and late January already have the infection and two of them pass away means the virus has been around for a while,” Santa Clara County Executive Jeff Smith says, per the Mercury News.
There were reports of an unusual pneumonia in Lombardy, Italy at the end of last year
EG https://www.scmp.com/news/china/society/article/3076334/coronavirus-strange-pneumonia-seen-lombardy-november-leading
Thank you for this article!
Is this UK government graph meaningless propaganda (I suspect I already know)
 ?resize=634%2C357&ssl=1
OR
https://tinyurl.com/yatw433f
What does ‘R = 1’ mean. I mean, it is the rate, R0, but surely on this graph, if R=1 is the value at the top of the curve, then values either side must by R1….and according to the text, we’ll be reducing measures as R increases.
I’m stumped
Apologies but the last post seemed to get garbled…hmmm
So, this government graph
https://tinyurl.com/yatw433f
If R=1 is at the top of the curve, and if R is on the Y-axis, then surely everything left and right of the dashed line, or the top of the curve, *must* represent R being less than 1…..in which case the question is, why does the curve rise so quickly and fall so quickly when R1….and the further to the right we go the higher the R value goes…..in which case the question is, according to the text, as R increases fewer measures will be used.
OR
Is it just meaningless propaganda, saying “we’re in control of this”
I read R as a function of how many people one infected person can infect in a given population, normalized to 1 at the top of the curve, in order that each country sets the values according to its particular distributions.
” why does the curve rise so quickly and fall so quickly when R1….and the further to the right we go the higher the R value goes…”
R is a variable that is useful, but it represents an integration of many other health related variables of the population (numbers, density,population age,when lockdown happened …). In the beginning of X for a given population, when very few people are infected, it is low.
For rapidly transferred diseases, as is this corona virus, the virus spreads like fire , that is why R rises fast. Then governments impose measures to limit contacts in the population, it starts falling. The figure shows figuratively how the imposed measures should be slackened , so as to control the spread of infection, in order that the population reaches a controlled herd immunity. There are steps, in order to tighten again if it gets out of hand.
In Greece they use Rho0, which is exactly the current number for how many people one person can infect, and started relaxing the lockdown when the number was controlled to be way below 1 new infection by a new infection. It is like opening and closing a faucet, they are trying to control the rate of infection in order to preserve the health system . With the steps they advise, it will depend on each country’s peculiarities in real time.
Thanks for the explanation, I have a similar understanding but what does the line in the graph actually represent ?
What is the graph a graphical representation of ?
To my eye, everything below the top of the graph is R<1
How can R increase in the way shown in the graph up to 1 ?
How did R start at 0 and rise to 1 ? .
We know when the virus arrived here that R must have been very high, and that is not represented by this 'apparent graph'. If the data to the left of the R=1 line is supposed to represent historical cases, then the line needs to start higher up the Y-axis, certainly well above R=1
CDC revisited the Wuhan data and have a real world median R0 for C19 of 5.7 (3.8 – 8.9 real range)
According to the UK graph the R has not been above 1
Measles has an R of 10-12, Chicken pox has an R of upto 18. I'm not trying to argue that chicken pox is 'a much worse disease' because of the R number alone, we still need to consider the lethality. Influenza has an R of 0.9 to 2.1, again just another comparison, but flu kills people and flu mutates every year, just like this virus seems to be able to mutate (accepted this is only it's first year)
So can we assume the graph is not a real graph, that it is a graphic (albeit a bit Soviet era) , designed to make people focus on an R of 1, saying that an R with a value of less than 1 is the most desirable outcome ?
Certainly the area to the left of R=1 line is drawn incorrectly, because prior to lockdown the R value must have certainly been higher than 1
And regarding R, isn't it actually meaningless ?
The R could be the median value of 5.7, and kill nobody at all. If R = 5.7 and the average age of those who it spreads to is 20 years old it is unlikely that any deaths will occur. Likewise R could be 0.7, but enter into a care home and kill everyone who is susceptible.
Unlike the flu, C19 has a long incubation period and a long period of being contagious prior to symptoms showing.
Also it is very contagious when there are no or few symptoms.
Holding on to the mantra of 'R<1 is good' seems naive at best. The R could be 4 and kill nobody
What difference does it make if I catch the virus when R = 9 or R = 1, if I am young, healthy, get plenty of sun and have no comorbidities the chance of death is probably unchanged between both different R value situations.
It seems to me that now we know that the virus does not affect all of us equally, that we know there is such a massive difference in susceptibility when you consider even just a person's age group membership (not even considering personal health, skin colour or existing comorbidities), that we need to get off the idea of using R to represent a level of safety among the population. Because actually, it is not the fact that you get the virus which decides if you die or not, but which risk group you belong to that is far more important. And is that any different to any other virus ? I don't think so
R0 (R-naught) is a measure of the replication rate. Answering the question: How many others does an average infected person infect. When this is greater than 1 the case count is exponentially increasing. When it is exactly 1 the case count is constant. When it is less than 1 the case count is exponentially decreasing.
R is a rate of change. In a graph of case count it is the slope of the curve.
Yes but, as I pointed out in a round about way. when does average become average ?
There is no average person we can run a double blind placebo controlled study is there.
I maintain that the importance of ones own key risk factors still outweigh the importance of R0.
Even the BBC is confused https://www.bbc.com/news/health-52473523 calling R the
“it’s the number of people that one infected person will pass the virus on to, on average”. That is why I interpret the R in the figure given by Chris Baron as a normalized replication curve, so that each reagion that will have a developing plot like this can adjust it to the pea of their Rho0.
I’m not surprised the BBC is confused if it uses Imperial College infographics like the one on that page, here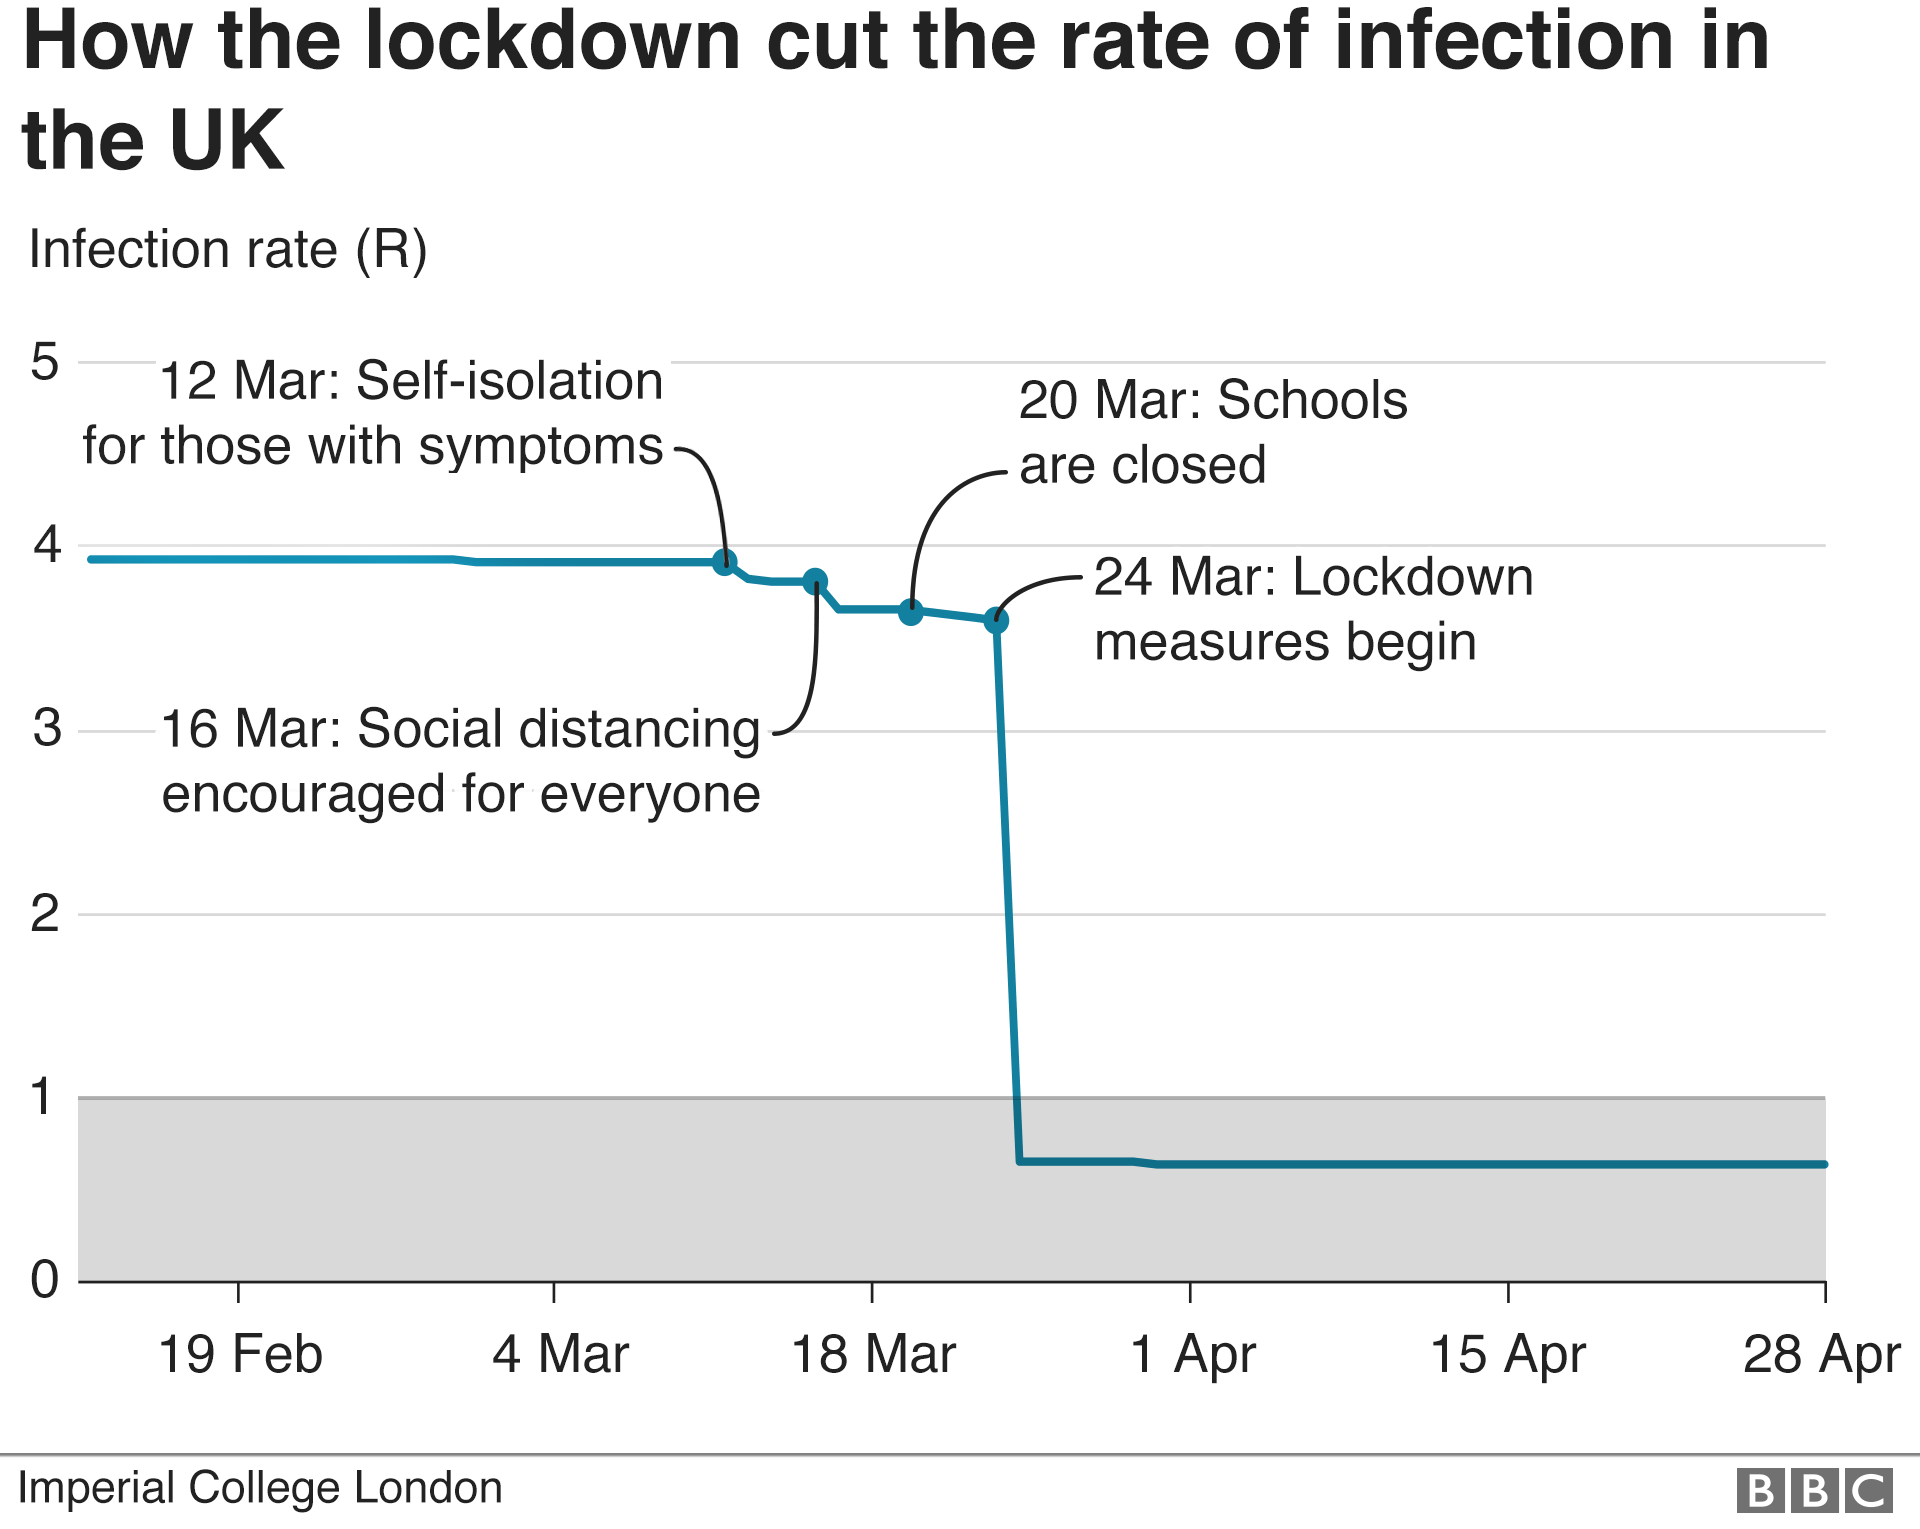
Apparently the R value has been below 1, and stayed at about 0.7, with no change. It contradicts the government’s data.
I don’t think the average member of public is so stupid that they couldn’t understand a factual graph instead of this made up one….
R is not Rho0. They have made a blanket plot that regions can apply to decide whether to relax the lockdown and when, by using their own numbers.
Take the peak R=1 equal to the highest value for Rho0″ the number of people that one infected person will pass the virus on to, on average”. At R=1 every country put a lockdown (except sweden and some others)
Before an infected person arrived, the Rho0 number was zero , the first one infects a number and there is an exponential growth until measures were taken by lockdowns, that is why measures were taken, to stop the rate of infections.
R does not represent a level of safety, just data. Before R=1 the infection was uncontrolled, then governments got scared and lockdown is imposed at R=1. Because of the control of the flow of infections after the lockdowns, the rate falls, and the graph is to be continually monitored during the step wise unlocking, to check that it is still falling, otherwise the governments have to impose again measures; for each region with its own pecuiiarities.
The graph is a guide for how to relax the lockdowns without increasing infections.
I’ve got an engineering degree so I suppose I should have done better with something which the average layman is expected to understand. Maybe education is a hindrance after all !
Still I can’t ignore the fact that in an area with lots of young people the R could be 3 or 0.3 but it makes no difference to the chance of them dying.
The lower the R number the slower the spread, so the value of 1 is a bit slower than the value of 1.1, and 0.9 is a bit slower than 1.0………as 1.1 is slower than 1.2 and 0.8 is slower than 0.9…..all we’re talking about is a rate of spread. There’s no real magic about the figure of 1….we know that R can’t reach infinity, because we know it has a maximum of 8.9….and the idea that ‘1 person infects 1 person’ is a key to this only works when the mythical average actually exists
Even with an R of 0.2 one person can infect 15.
Perhaps I’m just exposing a hole in my knowledge but from my point of view I think “so what if one person infects 2, it’s what happens to you when you get it which makes more of a difference than the R0”.
Why keep hoping for the lowest possible number of infections as if that will improve the chances of surviving if you catch it ?
We’re getting to the point we have what look like reliable treatment protocols coming. End of panic
Chris please,, if you allow an 80 year old grandmother to call you by your first name, try to understand my statements, which may not be in very clear english.
1) the R in the plot is not the Rho0 of the infections propagated from one infected. It is a NORMALIZED version of Rho0, normalized to 1 at the peak of the number of infections for each country/region. The peak started dropping AFTER the lockdwons were imposed.
2)The lockdowns were imposed because governments got scared from the rapidity of the infection and deaths of older people, and from the FAILURE OF THE HEALTH SYSTEMS , which in several regions ( search for Lombardy horror videos) had dead in the corridors and used effective euthanasia. The lockdowns were imposed to STOP THE RATE of infection so that the health system could respond reasonably.
3) Once the rate started decreasing consistently, they made the normalized plot with R (normalized Rho0) so that each region could fit it to their own rate, and the plot you linked is an instruction on HOW TO OPEN the lockdown in steps, so that the rate does not increase out of control. People will get infected at a rate that the Health system and Funeral systems can cope with.
You say:
“Why keep hoping for the lowest possible number of infections as if that will improve the chances of surviving if you catch it ”
Hoping for a low number of infections will not save people infected if they are in the vulnerable groups, but it will save the HEALTH SYSTEM.
The logic behind the lockdowns is to try and save the health and funeral services.With those collapsed chaos reigns, as was found experimentally in the Lombardy region.
The logic behind the plot is to show a path for regulating the rate of infection by opening the lockdown in steps. It is not to help the average Joe to feel safe, but to show how the rate of infection can be controlled and the economy opened while having a working health system. The lives saved are not the lives of those elderly who will die anyway if infected, but all the rest of the population emergencies, heart attacks,embolisms ….. which also died in the corridors in Lombardy from lack of health care.
Whatever people claim is inside the number R0, the number is generated by people’s behaviors, the biological properties of the virus and the immunity inside the population.
While the biological properties of a virus are fixed immunity level changes by every person that survived the virus and people’s behavior could/should change during an epidemic. So R0 changes into Rt.
But therefore R0 in a population that sleeps under a roof with twenty people and gives each other french kisses as a greeting is different from a society where 50% live alone and people bow to each other in 1m distance.
The immunity against smallpox is way higher in a community when the cowpox are circulating. If there is, in a subpopulation, a mutation in the receptor the virus requires for cellular entry that changes the susceptibility of the whole population.
So R0 is never fixed though the properties of the virus are.
The Swedes are very sensible people, and have behaved accordingly in the face of a pandemic. They are people who don’t need to told to take precautions, avoid subways and crowds, to work from home where possible, and to keep a reasonable social distance:
https://www.theaustralian.com.au/commentary/sweden-takes-the-big-coronavirus-risk-for-none-of-the-economic-gain/news-story/e8981b9c2f49086278e9ace1719ee67a?fbclid=IwAR2qS8-mCZl0jmLm8BryYXk1iGG_-EfaXUTkwsEnfFLYUcR2rDuyU2IgWiQ
Right on, Willis.
One quibble; you said “If you want someone to run a hospital, as a general rule you shouldn’t hire a doctor …”
My first decade working in healthcare I worked at hospitals run by doctors. The second decade was at a hospital run by a nun. The remaining 25 years I was “led” by a series of MBA’s. The doctors and the nun were unquestionably better leaders than the MBA’s, and ironically had better business sense.
Just an anecdotal observation, but I’ll bet it is shared by others who have spent a long career in hospitals.
This “anecdotal observation” may very well confirm Willis’ position. If your job was of the medical kind that is. In that case your perspective on what is the right kind of leadership will to a high probability be biased by a medical perspective. A fellow citizen in Holland calls what is going on a “medical dictatorship” caused by the tunnel vision of the medical professionals and the politicians bowing to their advice. I myself would say it is a big mistake is to apply a medical regime suited for a hospital – an organization you can control to a high degree – to a whole society. It is not possible, it doesn’t work, and it has devastating negative consequences. To think this is something healthy to do is an abomination. It is sad to see otherwise bright minds to get lost in this hopeless direction. The folly of that approach becomes clearer by the day.
I’m pleased to see I wasn’t the only one to find the UK government’s propagan…..I mean infographic to be less than acceptable.
https://www.thelondoneconomic.com/news/school-teacher-hilariously-marks-governments-lockdown-chart/12/05/?fbclid=IwAR0FbBRmvepadw1sOSXAFh5t-TGbSbZL1qoRQpFdb1HX2i3MvcnYkpsHtdc
Have anyone asked your doctor about Hydroxychloroquine? (plus Zinc and optional antibiotic)? Specifically if you become sick will your MD write a script for you? Will their pharmacist fill it?
Many Dr are saying that if you get fever in first week of illness, this Rx can help. The current standard (Ontario Canada) is to isolate, and only enter hospital if you get worse (not sure when).
I suggest that people ask their MD what their treatment options are. Ask ahead of time. Screening is needed (particularly, cardiac issues), but this can be checked based on your medical history.
Whether to do this is not is a personal choice, but it has been obstructed by some states and also Alberta in Canada:
https://www.albertahealthservices.ca/assets/info/ppih/if-ppih-covid-19-recommendations.pdf
Quoting: “Recommendations that HQ be taken off order sets for COVID management in AHS outside the setting of monitored randomized controlled trials have been made to reflect changes to major
national guidelines (Association of Medical Microbiology and Infectious Diseases Canada, Infectious Diseases Society of America, American Thoracic Society) in Canada and the US.”
What exactly is the point of a slow reopening?
I agree with the article about too many “essential” workers (But all American workers are truly essential-bar none).
What is it that is trying to be rolled out that needs this time?
re: “What is it that is trying to be rolled out that needs this time?”
The avoidance of volatile, debilitating reactions from ‘the press’.
_Jim: “The avoidance of volatile, debilitating reactions from ‘the press’.”
That, my friend, is a great Mic’ Drop answer. It’s really that simple.