Reposted from Dr. Roy Spencer’s Blog
February 5th, 2020 by Roy W. Spencer, Ph. D.
Note: What I present below is scarcely believable to me. I have looked for an error in my analysis, but cannot find one. Nevertheless, extraordinary claims require extraordinary evidence, so let the following be an introduction to a potential issue with current carbon cycle models that might well be easily resolved by others with more experience and insight than I possess.
Summary
Sixty years of Mauna Loa CO2 data compared to yearly estimates of anthropogenic CO2 emissions shows that Mother Nature has been removing 2.3%/year of the “anthropogenic excess” of atmospheric CO2 above a baseline of 295 ppm. When similar calculations are done for the RCP (Representative Concentration Pathway) projections of anthropogenic emissons and CO2 concentrations it is found that the carbon cycle models those projections are based upon remove excess CO2 at only 1/4th the observed rate. If these results are anywhere near accurate, the future RCP projections of CO2, as well as the resulting climate model projection of resulting warming, are probably biased high.
Introduction
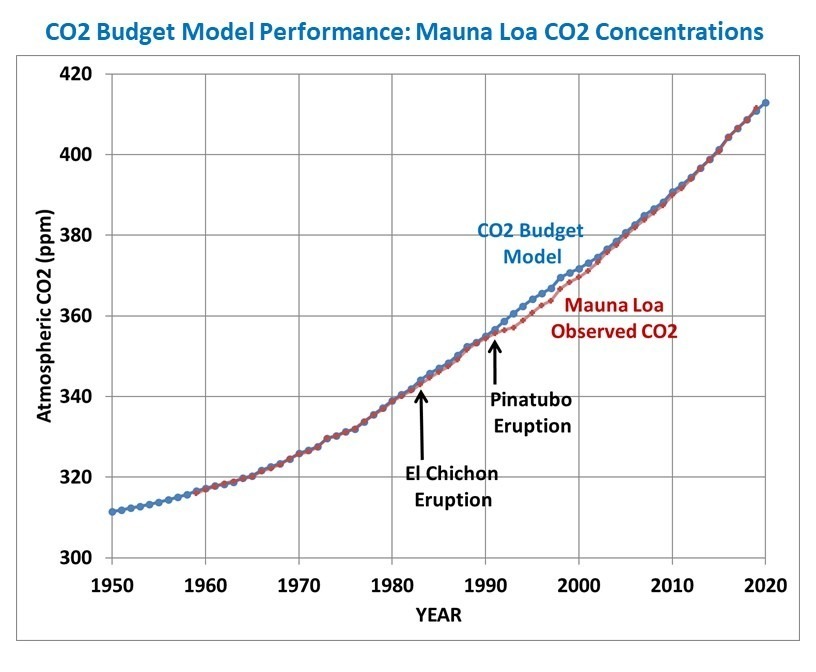
My previous post from a few days ago showed the performance of a simple CO2 budget model that, when forced with estimates of yearly anthropogenic emissions, very closely matches the yearly average Mauna Loa CO2 observations during 1959-2019. I assume that a comparable level of agreement is a necessary condition of any model that is relied upon to predict future levels of atmospheric CO2 if it is have any hope of making useful predictions of climate change.
In that post I forced the model with EIA projections of future emissions (0.6%/yr growth until 2050) and compared it to the RCP (Representative Concentration Pathway) scenarios used for forcing the IPCC climate models. I concluded that we might never reach a doubling of atmospheric CO2 (2XCO2).
But what I did not address was the relative influence on those results of (1) assumed future anthropogenic CO2 emissions versus (2) how fast nature removes excess CO2 from the atmosphere. Most critiques of the RCP scenarios address the former, but not the latter. Both are needed to produce an RCP scenario.
I implied that the RCP scenarios from models did not remove CO2 fast enough, but I did not actually demonstrate it. That is the subject of this short article.
What Should the Atmospheric CO2 Removal Rate be Compared To?
The Earth’s surface naturally absorbs from, and emits into, the huge atmospheric reservoir of CO2 through a variety of biological and geochemical processes.
We can make the simple analogy to a giant vat of water (the atmospheric reservoir of CO2), with a faucet pouring water into the vat and a drain letting water out of the vat. Let’s assume those rates of water gain and loss are nearly equal, in which case the level of water in the vat (the CO2 content of the atmosphere) never changes very much. This was supposedly the natural state of CO2 flows in and out of the atmosphere before the Industrial Revolution, and is an assumption I will make for the purposes of this analysis.
Now let’s add another faucet that drips water into the vat very slowly, over many years, analogous to human emissions of CO2. I think you can see that there must be some change in the removal rate from the drain to offset the extra gain of water, otherwise the water level will rise at the same rate that the additional water is dripping into the vat. It is well known that atmospheric CO2 is rising at only about 50% the rate at which we produce CO2, indicating the “drain” is indeed flowing more strongly.
Note that I don’t really care if 5% or 50% of the water in the vat is exchanged every year through the actions of the main faucet and the drain; I want to know how much faster the drain will accomodate the extra water being put into the tank, limiting the rise of water in the vat. This is also why any arguments [and models] based upon atomic bomb C-14 removal rates are, in my opinion, not very relevant. Those are useful for determining the average rate at which carbon cycles through the atmospheric reservoir, but not for determining how fast the extra ‘overburden’ of CO2 will be removed. For that, we need to know how the biological and geochemical processes change in response to more atmospheric CO2 than they have been used to in centuries past.
The CO2 Removal Fraction vs. Emissions Is Not a Useful Metric
For many years I have seen reference to the average equivalent fraction of excess CO2 that is removed by nature, and I have often (incorrectly) said something similar to this: “about 50% of yearly anthropogenic CO2 emissions do not show up in the atmosphere, because they are absorbed.” I believe this was discussed in the very first IPCC report, FAR. I’ve used that 50% removal fraction myself, many times, to describe how nature removes excess CO2 from the atmosphere.
Recently I realized this is not a very useful metric, and as phrased above is factually incorrect and misleading. In fact, it’s not 50% of the yearly anthropogenic emissions that is absorbed; it’s an amount that is equivalent to 50% of emissions. You see, Mother Nature does not know how much CO2 humanity produces every year; all she knows is the total amount in the atmosphere, and that’s what the biosphere and various geochemical processes respond to.
It’s easy to demonstrate that the removal fraction, as is usually stated, is not very useful. Let’s say humanity cut its CO2 emissions by 50% in a single year, from 100 units to 50 units. If nature had previously been removing about 50 units per year (50 removed versus 100 produced is a 50% removal rate), it would continue to remove very close to 50 units because the atmospheric concentration hasn’t really changed in only one year. The result would be that the new removal fraction would shoot up from 50% to 100%.
Clearly, that change to a 100% removal fraction had nothing to do with an enhanced rate of removal of CO2; it’s entirely because we made the removal rate relative to the wrong variable: yearly anthropogenic emissions. It should be referenced instead to how much “extra” CO2 resides in the atmosphere.
The “Atmospheric Excess” CO2 Removal Rate
The CO2 budget model I described here and here removes atmospheric CO2 at a rate proportional to how high the CO2 concentration is above a background level nature is trying to “relax” to, a reasonable physical expectation that is supported by observational data.
Based upon my analysis of the Mauna Loa CO2 data versus the Boden et al. (2017) estimates of global CO2 emissions, that removal rate is 2.3%/yr of the atmospheric excess above 295 ppm. That simple relationship provides an exceedingly close match to the long-term changes in Mauna Loa yearly CO2 observations, 1959-2019 (I also include the average effects of El Nino and La Nina in the CO2 budget model).
So, the question arises, how does this CO2 removal rate compare to the RCP scenarios used as input to the IPCC climate models? The answer is shown in Fig. 1, where I have computed the yearly average CO2 removal rate from Mauna Loa data, and the simple CO2 budget model in the same way as I did from the RCP scenarios. Since the RCP data I obtained from the source has emissions and CO2 concentrations every 5 (or 10) years from 2000 onward, I computed the yearly average removal rates using those bounding years from both observations and from models.

Fig. 1. [fixed] Computed yearly average rate of removal of atmospheric CO2 above a baseline value of 295 ppm from historical emissions estimates compared to Mauna Loa data (red), the RCP scenarios used by the IPCC CMIP6 climate models, and in a simple time-dependent CO2 budget model forced with historical emissions before, and assumed emissions after, 2018 (blue). Note the time intervals change from 5 to 10 years in 2010.
The four RCP scenarios do indeed have an increasing rate of removal as atmospheric CO2 concentrations rise during the century, but their average rates of removal are much too low. Amazingly, there appears to be about a factor of four discrepancy between the CO2 removal rate deduced from the Mauna Loa data (combined with estimates of historical CO2 emissions) versus the removal rate in the carbon cycle models used for the RCP scenarios during their overlap period, 2000-2019.
Such a large discrepancy seems scarcely believable, but I have checked and re-checked my calculations, which are rather simple: they depend only upon the atmospheric CO2 concentrations, and yearly CO2 emissions, in two bounding years. Since I am not well read in this field, if I have overlooked some basic issue or ignored some previous work on this specific subject, I apologize.
Recomputing the RCP Scenarios with the 2.3%/yr CO2 Removal Rate
This raises the question of what the RCP scenarios of future atmospheric CO2 content would look like if their assumed emissions projections were combined with the Manua Loa-corrected excess CO2 removal rate of 2.3%/yr (above an assumed background value of 295 ppm). Those results are shown in Fig. 2.

Fig. 2. Four RCP scenarios of future atmospheric CO2 through 2100 (solid lines), and corrected for the observed rate of excess CO2 removal based upon Mauna Loa data (2.3%/yr of the CO2 excess above 295 ppm, dashed lines).
Now we can see the effect of just the differences in the carbon cycle models on the RCP scenarios: those full-blown models that try to address all of the individual components of the carbon cycle and how it changes as CO2 concentrations rise, versus my simple (but Mauna Loa data-supportive) model that only deals with the empirical observation that nature removes excess CO2 at a rate of 2.3%/yr of the atmospheric excess above 295 ppm.
This is an aspect of the RCP scenario discussion I seldom see mentioned: The realism of the RCP scenarios is not just a matter of what future CO2 emissions they assume, but also of the carbon cycle model which removes excess CO2 from the atmosphere.
Discussion
I will admit to knowing very little about the carbon cycle models used by the IPCC. I’m sure they are very complex (although I dare say not as complex as Mother Nature) and represent the state-of-the-art in trying to describe all of the various processes that control the huge natural flows of CO2 in and out of the atmosphere.
But uncertainties abound in science, especially where life (e.g. photosynthesis) is involved, and these carbon cycle models are built with the same philosophy as the climate models which use the output from the carbon cycle models: These models are built on the assumption that all of the processes (and their many approximations and parameterizations) which produce a reasonably balanced *average* carbon cycle picture (or *average* climate state) will then accurately predict what will happen when that average state changes (increasing CO2 and warming).
That is not a given.
Sometimes it is useful to step back and take a big-picture approach: What are the CO2 observations telling us about how the global average Earth system is responding to more atmospheric CO2? That is what I have done here, and it seems like a model match to such a basic metric (how fast is nature removing excess CO2 from the atmosphere, as the CO2 concentration rises) would be a basic and necessary test of those models.
According to Fig. 1, the carbon cycle models do not match what nature is telling us. And according to Fig. 2, it makes a big difference to the RCP scenarios of future CO2 concentrations in the atmosphere, which will in turn impact future projections of climate change.
So if that’s the case, a sudden stop in fossil fuel burning would leave us with 97.7% of the excess CO2 after 1 yr, then 97.7%x97.7%=95.5% after 2 yrs, and so on, right?
If 350ppm is supposed to be the “safe” level (according to Bill McKibben and 350.org), we would hit that after about 32 years. If we drive CO2 up to 560ppm before we perfect thorium reactors (or whatever), then we will take about 68 years to get back to 350ppm. But at 2.5ppm/yr increase, it would take us until 2080 to reach 560ppm. So we would have 60 years to perfect nuclear. By 2148 when we would be back at 350ppm, we’d need to start burning fossil fuels again to keep agriculture working smoothly.
If ECS is around a lukewarmist’s 1.8K and the transient response is half of that, then at 560ppm (doubling from 280) we’d be about 0.9K hotter than 1850. How can that possibly be a problem? It’s a benefit in every regard, slightly milder winters and nights, much higher crop yields, better water utilization.
On the other hand, let natural cooling set in and agricultural output plummets. That’s the real problem, folks, and there’s not much we could do about it.
In fact, it’s not 50% of the yearly anthropogenic emissions that is absorbed; it’s an amount that is equivalent to 50% of emissions.
≠=========
Agreed. I made that same point years ago when studying this question. As i recall it has a huge impact on the underlying math, because it throws cause and effect into question.
How can the absorption remain at 50% of human emissions, when nature has no way to distinguish between human and natural emissions.
Coincidence is not a good explanation.
Ferd, the coincidence is in the fact that human emissions increased linear per year. That means a (slight) exponential increase in the atmosphere and thus a slight exponential increase in sink rate, which again is linear in the sink rate/year.
In the years before the 2016 El Niño, there was no increase in emissions and the growth rate did sink, as the increase in the atmosphere did not stop.
If we would halve the emissions, there was zero increase in the atmosphere left…
In the years before the 2016 El Niño, there was no increase in emissions and the growth rate did sink
=≠======
That was also “The Pause” in global temperatures. Cause and effect depends on the choice of assumptions.
The belief that A causes B is based on the assumption that C is true. But C remains unproven. The notion that we can decide C based on logical argument is what held science back for nearly 2000 years. It is the question of whether heavier objects fall faster, or the speed of light and gravity.
The usefulness of a model lies in its ability to correctly predict the future. Whether the model correctly implements the underlying physical process is largely irrelevant and uninteresting outside of academia.
We use Newton because it correctly predicts the future for low energy systems. But we know from Einstein that the Newtonian model is incorrect. It does not represent reality.
And the same is true for CO2. The question is: what model best predicts the future. The question of whether the mechanism is correct is quite frankly the wrong question.
As history shows, our understanding of reality has never been correct. It is incomplete and must always remain such.
People should note that Fig. 1 (the main plot) was incorrect, and Charles has put the correct one in there now. It is the key figure, and most people here commented before the figure was corrected.
A link to the correction post would also be useful. The discrepancy claimed in the heading here no longer exists.
So, more CO2 in ocean, more phyto, more pyramid…
The Oceans are not just Base, they are BUFFERED Base.
Me too, but I bet dimes for Dollars that they make some unsubstantiated assumptions about the rate of CO2 absorption at ocean surfaces and other air-water interfaces.
The rate of CO2 absorption and conversion to aqueous carbonate/bicarbonate is actually quite a slow reaction. This is why the enzyme carbonic anhydrase is truly ubiquitous in nature, typically speeding up the chemical reaction by a factor of a million or more(*). It makes for a quite interesting undergraduate teaching/demonstration experiment.
The bulk of ocean surfaces are quite probably covered by a bacterial biofilm acting as one enormous catalytic layer, maybe only ~one cell thick. Depending on the presence or absence and effectiveness of this catalytic biofilm the actual observed absorption rates may (or may not) be governed by mass transfer and not necessarily the expected rates based upon simple chemical thermodynamics. As far as I am aware carbon cycle modelers may consider direct CO2 sequestration by photosynthesis, but ignore such possible effects of biology upon “inorganic” carbon dioxide pathways.
(* One paper I read some years ago undertook a study of gene expression by E. Huxleyi under conditions of increased carbon dioxide. The biggest change they found was, unsurprisingly to me, a change in the amount of expressed genes coding for carbonic anhydrase.)
The test for Fig. 1 has “the RCP scenarios used by the IPCC CMIP6 climate models”. In the article at drroyspencer.com, it says these are the RCPs used by the CMIP5 models.
Let’s say humanity cut its CO2 emissions by 50% in a single year, from 100 units to 50 units. If nature had previously been removing about 50 units per year (50 removed versus 100 produced is a 50% removal rate), it would continue to remove very close to 50 units because the atmospheric concentration hasn’t really changed in only one year. The result would be that the new removal fraction would shoot up from 50% to 100%.
I have been saying this since years ago, although certainly not often enough. If currently only the equivalent of 45% of our emitted CO2 is being added to the atmosphere every year, then for CO2 to stop rising we do NOT need to cut our emissions 100%. Just reducing them to half the current ammount will make the CO2 levels stop rising (and plants will not be very happy about it, although they should still thank us for the increased levels compared to preindustrial).
Thanks, folks, for a very interesting discussion, conducted politely, and with some interesting new-to-me science.
Anthony, Charles and all: keep up the good work! Science does self-correct, even if frustratingly slowly. Recalling Richard Feynman: “Reality must take precedence over public relations, for Nature cannot be fooled.” Likewise, environmental politicians. I think there are signs that the worm turns. I hope so!
Regarding “Note that I don’t really care if 5% or 50% of the water in the vat is exchanged every year through the actions of the main faucet and the drain; I want to know how much faster the drain will accomodate the extra water being put into the tank, limiting the rise of water in the vat. This is also why any arguments [and models] based upon atomic bomb C-14 removal rates are, in my opinion, not very relevant. Those are useful for determining the average rate at which carbon cycles through the atmospheric reservoir, but not for determining how fast the extra ‘overburden’ of CO2 will be removed.”:
This is the difference between C14 dioxide removal rate after the end of “the bomb tests” (half life about 10 years) and either the Bern model or a competing exponential decay model, such as one with a half life of 41 years (time constant “tau” or “e-folding” time of 59 years), mentioned in https://wattsupwiththat.com/2015/04/19/the-secret-life-of-half-life/
Dr. Spencer’s model appears to me as similar to the model by Willis Eschenbach, apparently same type model (exponential decay of short term pulses / injections of CO2 into the atmosphere, constant percentage per year of “excess” over some “pre-industrial baseline” being absorbed from the atmosphere with moderate differences in numbers: Spencer’s model is annual removal by nature being 2.33% of “excess” above 295 PPM, and Eschenbach’s model was 1.695% of “excess” above 283 PPM (that I worked out from Eschenbach’s statement of time constant of 59 years). Spencer’s model has a somewhat shorter time constant of about 43 years and half life around 29.4 or 29.7 years (with discrepancy being from using time two different calculation methods, at least one of them assuming a time step of one year).
It’s not a vat or a bucket. It’s a river. Not of water, but of CO2, transported along with the waters that make up the vast flows of the THC.
CO2 levels in the atmosphere follow the levels in the upper oceans. The oceans are continually draining CO2 laden waters through downwelling at the poles, and replenishing it via upwelling at the equator. CO2 content of the surface waters can increase two ways: 1) increased upwelling content, and 2) decreased downwelling content.
The upwelling waters were set in motion perhaps 1,000 years ago, and they cannot be stopped or modulated. But, downwelling transport can be modulated by surface temperatures. This begets a temperature dependency in the rate of change of CO2 concentration. This dependency is starkly observable in the data:
http://woodfortrees.org/plot/esrl-co2/mean:12/from:1979/derivative/plot/uah6/scale:0.18/offset:0.144
Bart, some time ago…
The problem with your plot is that the variability is not caused by the temperature of the sinking waters, which is rather constant at the edge of the polar ice, but by the influence of temperature and drought/rain on vegetation in the tropics. That is reflected in the opposite CO2 and δ13C variability in the derivatives. If the oceans were the main variable, CO2 and δ13C would change in parallel, here for the 1991 Pinatubo and 1998 El Niño period:
http://www.ferdinand-engelbeen.be/klimaat/klim_img/temp_dco2_d13C_mlo.jpg
No. The plot is not happenstance.
Bart, do you have a plot of local seawater temperatures at the THC sink place?
The only plots I have seen which match the variability in sink rate are from the tropics (and mainly of the Niño areas of the equatorial oceans) or even the SH, not from the THC area.
The way data is being moulded by humans lead me to name the current era not the Anthropocene, but the Plasticine..
It would be a simple matter to make a table with global warming factors, including the contribution from CO2, from 1979 to present, and list CO2 ppm for each year. This would give factor change and PPM change for each year. That can be compared with global temperature change.
If CO2 removal rates are 4X higher, then a new table could be constructed, with a new value for contribution from CO2. This would give a NEW factor change and the same PPM change for each year. That can be compared with the same global temperature change.
The table would show the CO2 contribution increases VERY SLOWLY with PPM, much slower than IPCC, etc., are claiming.
That should lead to much less fear-mongering regarding CO2 and banning fossil fuels.
“Nature Has Been Removing Excess CO2 4X Faster than IPCC Models”
How fast do models remove CO2?
Depends on whether you use AA or AAA batteries in the models.
“Let’s assume those rates of water gain and loss are nearly equal, in which case the level of water in the vat (the CO2 content of the atmosphere) never changes very much. This was supposedly the natural state of CO2 flows in and out of the atmosphere before the Industrial Revolution, and is an assumption I will make for the purposes of this analysis.”
There is the whole problem, in a nutshell. The whole notion that “we” are responsible for atmospheric CO2 changes is based on nothing more than an ASSUMPTION.
Assumptions are not facts. The simple FACT is that we don’t know what the “drivers” behind changes to the atmospheric CO2 level are, because we’re not measuring the vast majority of the “sources” and none of the “sinks.”
And there IS NO “excess” CO2; the present levels are barely sufficient, given how they are likely to plummet with the next glaciation, and given how close we are to reaching a level that is so low that it would mean the end of photosynthesis and with it, all life as we know it. More is better; let’s stop acting like the supposed “pre-industrial” level (which is likely a falsehood since it is based on poor proxies) is some kind of “ideal.”
AGW is Not Science ,
You don’t need to know any individual CO2 flux, what you need to know is the historical level/temperature ratio, which is about 16 ppmv/K for at least the past 2 million years and confirmed by over 3 million seawater samples over the past centuries, including several continuous monitoring stations over the past decades.
And you need to know the inventory of human emissions (with reasonable accuracy, thanks to taxes) and the increase in the atmosphere with high accuracy, thanks to 10 base stations all over the oceans.
What nature has done is simply the difference between human emissions and increase in the atmosphere. No matter if an individual flux doubled or halved or another stream turned from a net contributor to a net sink or reverse: the whole nature was a net sink for CO2 in the past 60 years.
With that knowledge, Dr. Spencer could show that the base equilibrium between the current ocean (surface) temperature and the atmosphere is around 295 ppmv and that the net sink rate still is linear in ratio with what is measured in the atmosphere and the 295 ppmv equilibrium.
No assumptions at all, only observations…
That lowermost RCP model curve insists that the levels would try to return to the preindustrial levels from the Little Ice Age. The math might try to do so, but it seems like an unwarranted assumption for warmer periods.
Anonymoose,
The difference is quite small: a change of about 16 ppmv/K, as measured in over 3 million seawater samples over the past centuries.
Thus with 1 K temperature increase, that is 16 ppmv above the average 280 ppmv in the LIA:
http://www.ferdinand-engelbeen.be/klimaat/klim_img/law_dome_1000yr.jpg
Thus the 295 ppmv Dr. Spencer used is right on track…
One also needs to consider that when CO2 rises, conditions become more favorable for plant growth. This leads to an increase in planetary vegetation, which consumes more CO2 to sustain itself. This is the part of the equation that is not adequately addressed, and may explain the shortcomings of the climate model “predictions”.
RB, – I want to suggest you read my comment way upthread [responding to MCHENRY, on the night of Feb 5], which specifies some recent data that clearly shows the paradigm (CO2 rises … consumes more CO2) you suggest is not linear, nor one directional; at least in a researched temperate zone tree. The source cited is free to read on-line & not as technical as many scientific reports – it reads fairly readily.
Update: Dr. Roy Spencer found his error. Natural removal rate of CO2 from the atmosphere from 2000 to 2020 is consistent with the RCPs, not 4 times what is indicated by the RCPs. It is also consistent with both Spencer’s simple model. Spencer’s update is at
http://www.drroyspencer.com/2020/02/corrected-rcp-scenario-removal-fractions/
“Natural removal rate of CO2 from the atmosphere from 2000 to 2020 is consistent with the RCPs, not 4 times what is indicated by the RCPs.”
Huh?
From spencers post:
“But now, the RCP scenarios have a reduced rate of removal in the coming decades during which that same factor-of-4 discrepancy with the Mauna Loa observation period gradually develops. More on that in a minute”
“Now, if I reduce the model specified CO2 removal rate value from 2.3 to 2.0%/yr, I cannot match the Mauna Loa data. Yet the RCP scenarios insist that value will decrease markedly in the coming decades.
Who is correct? Will nature continue to remove 2.0-2.3%/yr of the CO2 excess above 295 ppm, or will that removal rate drop precipitously? If it stays fairly constant, then the future RCP scenarios are overestimating future atmospheric CO2 concentrations, and as a result climate models are predicting too much future warming.”
I think you should have read spencer’s *entire* post.
“Huh?”
Huh? The statement quoted is exactly correct. Observed CO2 (2000-2020) is consistent with RCP estimates, not 1/4x.
What you have quoted is a divergence between RCP future values and those of Spencer’s model future values.
If Spencer’s model is correct, that the NET CO2 removal rate from the atmosphere is 2.3%/yr of the excess CO2 concentration over 295 ppm, then at 410 ppm, the removal rate should be 0.023 * (410 – 295) = 2.645 ppm/yr. A mass balance on the atmosphere shows that 1 ppm CO2 corresponds to about 8 gigatons (8 * 10^12 kg) of CO2, so that the current NET removal rate would be 2.645 * 8 = 21.2 GT/yr.
Spencer’s model assumes that the NET removal rate varies linearly with concentration, but what is the significance of the X intercept of his straight line at 295 ppm? If the processes removing CO2 from the atmosphere (such as photosynthesis) were first-order reactions, where rate is proportional to CO2 (reactant) concentration, then the total CO2 removal rate at 410 ppm should be 0.023 * 410 = 9.43 ppm/yr = 75.4 GT/yr. This would be partially counteracted by a natural CO2 emission rate of 0.023 * 295 (the X intercept of Spencer’s line) = 6.79 ppm/yr = 54.3 GT/yr (which could be due to animal respiration, volcanos, rotting vegetation and animals, and net emissions from the oceans).
Current human CO2 emissions are running about 37 GT/yr, which means that according to Spencer’s model, total CO2 input is 54.3 (natural) + 37 (human) = 91.3 GT/yr, with absorption of 75.4 GT/yr, for a net gain of 15.9 GT/yr, or about 2 ppm/yr increase in CO2 in the atmosphere.
According to this model, if human emissions remained constant at 37 GT yr, the equilibrium concentration X, at which human emissions = net removal rate, could be calculated as 37 = 0.023 * 8 * (X – 295), from which X = 295 + 37 / (0.023 * 8) = 496 ppm. If human emissions increased beyond 37 GT/yr, the equilibrium concentration would be higher, by about 5.4 ppm per additional GT/yr emitted. In order to reach an equilibrium concentration of 600 ppm, human emissions would have to rise above 56 GT/yr, or about 51% above current emission rates.
While your math is sensible from the pov that the annual atm. CO2 vector is directed into the ocean from MME driving the total, it is entirely plausible the CO2 vector (net) is outward from the ocean, growing in magnitude from biological and geological marine sources, with the resultant natural upward atm CO2 trend being mistaken for MME.
This idea precludes a static equilibrium for CO2 at any value, like 280-295ppm as is often cited.
CO2 is the ‘exhaust’ from the sun supplying the energy, the ocean buffering it, and life making CO2.
Today’s CO2 theory implies the exhaust fuels the system horsepower; it’s backward.
Bob,
if the oceans were a net emitter and humans are a one-way emitter and vegetation is a small absorber (of about 1/4 of human emissions) how than is it possible that the increase in the atmosphere is less than what humans alone emit?
Can you show that mass balance over a year?
The oceans have been a net absorber of CO2 since burning of fossil fuels became a significant source of CO2.
That’s kinda a loaded question requiring a lot of detailed analysis just to verify your assumptions were solid, such as where does the conclusion come from that vegetation is a small absorber of ‘about 1/4 of human emissions’?
What we should recognize is the increased plant productivity since the 1980s during a time of increasing CO2, precipitation, and warmth.
Does your mass balance account for the large increase in leaf area since 1982?
I don’t have an annual mass balance – but let’s agree to start with annual cycles:
Bob,
The annual cycle is driven by seasonal temperature changes and, while somewhat increased due to increased biomass, that doesn’t say anything about the more or less permanent deposit of C in humus, peat and (brown)coal.
Fortunately, there is an escape route: humans are burning a lot of fossil fuels, thus using some oxygen out of the atmosphere. Vegetation uses CO2 and produces O2 while vegetation decay/feed/food uses oxygen and produces CO2.
If one makes that oxygen balance by calculating the fossil fuel use x O2 use per type of fuel, one knows the decline of O2 caused by fossil fuel burning.
By measuring the O2 decline over the years, that gives you the net O2 use or production by the biosphere.
Since about 1990, the biosphere as a whole (land and sea plants, molds, insects, animals, humans) produces more O2 than it uses. That is where one can find the CO2 uptake by the same biosphere over the years.
The main problem for that approach is the needed accuracy of a few tenths of a ppmv in 210.000 ppmv O2. See Bender e.a.:
http://www.bowdoin.edu/~mbattle/papers_posters_and_talks/BenderGBC2005.pdf
Who found 1.0 +/- 0.6 GtC/year net uptake/year by vegetation in the period 1990-2002.
Donald L. Klipstein February 7, 2020 at 8:50 am
The oceans have been a net absorber of CO2 since burning of fossil fuels became a significant source of CO2 –> The oceans have been a shock-absorber of CO2 since burning of fossil fuels became a significant source of CO2
Bob Weber’s theory that CO2 is the “exhaust” from the sun’s energy is only partially true. CO2 is effectively an exhaust gas from the combustion of hydrocarbons or coal. But CO2 is a reactant in photosynthesis, an endothermic reaction which requires energy input from the sun (and water as a reactant) to produce sugars and free oxygen in plants.
Le Chatelier’s Principle in chemistry states that any change in the environment around a chemical reaction tends to shift the equilibrium in the opposite direction. Increasing the concentration of a reactant (such as CO2) will tend to increase the rate of reaction (photosynthesis) to destroy CO2 and convert it to sugars and oxygen. This theoretical prediction has been borne out in experiments which have shown that artificially increasing CO2 concentrations in greenhouses increases plant growth rates, which is why florists are currently injecting CO2 into greenhouses to produce nice fresh roses for Valentine’s Day, when natural sunshine and warm weather are in short supply.
If photosynthesis is a first-order reaction (reaction rate = constant times reactant concentration), it would stand to reason that the rate of removal of CO2 would be linearly proportional to CO2 concentration, as Dr. Spencer proposes. Of course, there may be other sources and/or sinks whose reaction rate may not be linearly proportional to atmospheric CO2 concentration, which would have to be experimentally verified.
Thank you Steve Z.
I think the main overlooked source of natural CO2 is from the natural growth of coral reef bases via increasing calcification, which has CO2 as a by-product according to the equilibrium equation, which results in increased dissolved CO2 over time, increasing the partial pressure of the CO2 at the surface, increasing the outgassing, as ocean temperature rises, according to Henry’s Law, which if you think about it is another expression of Le Chatelier’s Principle, quantified for CO2
Ca + 2HCO3 CaCO3 + CO2 + H2O.
Over the centuries, higher energy solar activity warmed the ocean and provided more light energy for zooxanthellae photosynthesis, the food population for corals that grew as ocean temperature climbed, enabling more coral reef base growth, calcification and CO2 outgassing, all according to natural biological laws and physical laws.
Zooxanathallaes are at the very foundation of life on earth because their biological outputs feed coral growth and outputs that recycle back to nature the primary compound terrestrial organisms need to thrive, CO2, thanks to photochemistry.
From all that it’s hard to say whether nature has been removing ‘excess’ CO2 4x faster than IPCC models.
Bob,
The CO2 release from the calcification of coral reefs (and Ehux calcified plankton) is part of the biosphere, which is a proven sink of CO2.
The total sink of CO2 is the difference between human emissions and increase in the atmosphere and that is in direct ratio to the extra CO2 pressure in the atmosphere above the long time equilibrium governed by the ocean surface temperature. Currently around 295 ppmv…
Roy,
From a chemical exchange and equilibrium viewpoint, I give some thoughts about the atmospheric (Atm) CO2 removal rate, which likely has steadily increased over time.
If Atm CO2 were suddenly increased in one step and nothing changed in the characteristics of those CO2 uptake reservoirs (e.g., oceans, plants & soil), then the two concentrations would be out of equilibrium. An increased amount of CO2 would then flow from Atm to these other reservoirs until a new equilibrium was established.
But this simple scenario does not consider either the rate (kinetics) of the CO2 exchange process nor of changes in the uptake reservoirs. Here is one example. Increasing Atm CO2 is not immediately absorbed by the oceans. Rather, as Atm CO2 gradually increases, the rate of CO2 uptake into the oceans likely falls further behind. Most CO2 uptake into oceans occurs near-surface, whereas decades to centuries are required for the surface ocean to transfer that CO2 to the deeper ocean. The potential for oceans to absorb more Atm CO2 is there, but the kinetics (rate) of the transfer process cannot accommodate the much faster rate Atm CO2 is increasing.
This implies that as Atm CO2 increases, the amount by which the CO2 concentration difference between Atm and ocean grows larger and the equilibrium condition falls further and further behind. An increasing rate of Atm CO2 would therefore bring the Atm–Ocean exchange further and further out of equilibrium and would steadily increase the rate that CO2 is removed from the Atm.
This view also has implications if CO2 addition to the Atm were to totally stop (not just slow to a zero rate increase). The exchange rate of Atm CO2 into the ocean would continu at a slowly decreasing rate for many years. Changing the rate of Atm CO2 increase (now positive) to zero (i.e. a constant, not increasing rate of CO2 addition), would require even more time to achieve a new reservoir concentration equilibrium.
One ought to see today a higher rate of Atm CO2 removal compared to decades ago, and a higher rate of Atm CO2 removal in future years compared to today.
donb,
The main absorption by the oceans is not in the mixed layer, which is very fast in equilibrium with the atmosphere (exchange rate less than a year). the main ocean sinks are in at the deep ocean sink places like the THC in the N.E. Atlantic, where there is an enormous pCO2 difference between the atmosphere (410 μatm) and the cold sinking waters (150 μatm) at the edge of the ice fields.
Thus while the bulk of the surface is rapidly saturated at about 10% of the change in the atmosphere and thus the Bern model of the IPCC is right, there is no sign of saturation of the deeop ocean sink in the nearby future and until now, the Bern model is wrong – or at least not applicable.
Neither for vegetation, where the optimum growth for many (C3 cycle) plants is around 1500 ppmv in the atmosphere.
In addition:
The ocean surface (the “mixed layer”) in direct contact with the atmosphere contains about 1000 PgC. The 35% increase of CO2 in the atmosphere has increased that with about 3.5% or about 35 PgC, that is all.
On the other hand, if all human CO2 until now would be mixed into the deep oceans, that increases the content of the deep oceans (38.000 PgC) with some 1%, or 3 ppmv in the atmosphere when in equilibrium…
Instead of a drain at the bottom of the vat, assume that there is a vertical slot cut in the side of the vat. Initially no water will run out until it reaches the level of the slot. And then as the water rises further, the water will run out faster and faster until it reaches equilibrium.
Now increase the rate of water flowing in. The level will rise, more will flow out of the slot until a new equilibrium is reached.
In such a case, the sink rate lags the source rate. But the sink does not stop increasing immediately after the source stops increasing. Rather the sink will continue to increase until a new equilibrium is reached.
Ferd B
That analogy works, and so do a couple of others: A vee-notch weir is used to determine the flow in a stream with a large capacity in terms of variation with a simple device. Another is that the outlet is at the bottom of the vat (simulating the continual removal by rock erosion which continues in the absence of vegetation). As the depth grows the flow out of the bottom hole increases by pressure change. There is a formula for that based on the shape of the entrance to the hole.
As the choice of baseline is sort of arbitrary, 295 ppm, there is an extraction rate that gives the “correct” answer. One could have used a different baseline, say 220 ppm, and the answer would be different. I think it is important for readers to understand that there is nothing magical about the number, it is about the principle. It establishes that the absorption (or sequestration) rate it is higher than the expectation of the IPCC.
I think it is worth mentioning that the absorption rate of the biosphere can be determined from the winter-to-summer change in the NH CO2 concentration, say north of 20 latitude (because the tropics aren’t much changed during that time). The rapid draw-down of CO2 in spring is amazing. Very rapid. If there is a continuous release of CO2 by the oceans from upwelling deep water, and there was a prolonged cold period in the NH, for whatever reason, we should expect the CO2 concentration to rise significantly.
Looking at the level claimed for the early 1800’s, this seems verified. After the little ice age, why would the CO2 level be low when plants were struggling to grow beyond 55N? It should be higher. The CO2 does not COME FROM the plants, it GOES INTO the plants. Anything that cools the planet would drive up CO2 which is not powerful enough to overcome all the cooling.
The idea that the oceans are warming and releasing CO2 has to be matched with some proof that the deep oceans are warming, because what rises is not warm, though it is replete with absorbed CO2. Perhaps we need to put on the thinking hat where copious amounts of CO2 from the deeps is released continuously, and the plants absorbing it wax and wane with the global temperature, that variation being driven by non-CO2 effects.
It is by now obvious that the temperature effect of CO2 is not very powerful. The rest has to be explained by something else. If we are heading into a cooling period (as the USA has been for 100 years) we could expect a rise in CO2 resulting from less absorption by living biomass. That would stave off at least some of the temperature drop, resulting in what we observe – a remarkably stable climate over long periods of time.
If we reached the condition where the oceans cool significantly, the CO2 would drop inexorably, in spite of the loss of living biomass, until a new equilibrium was established.
it is found that the carbon cycle models those projections are based upon remove excess CO2 at only 1/4th the observed rate –> it is found that the carbon cycle models’ projections are based upon remove of excess CO2 at only 1/4th of the observed rate
a comparable level of agreement is a necessary condition of any model that is relied upon to predict future levels of atmospheric CO2 if it is have any hope of making useful predictions of climate change –> a comparable level of agreement is a necessary condition for any model to get relied upon predicting future levels of atmospheric CO2 having any hope of making useful predictions of climate change
/ sheer mikado
where I have computed the yearly average CO2 removal rate from Mauna Loa data, and the simple CO2 budget model in the same way as I did from the RCP scenarios –> where I have computed the yearly average CO2 removal rate from Mauna Loa data, and have computed the simple CO2 budget model in the same way as I did from the RCP scenarios
which produce a reasonably balanced *average* carbon cycle picture (or *average* climate state) will then accurately predict –> which produce a reasonably balanced *average* carbon cycle (or *average* climate state) picture will then accurately predict
Donald L. Klipstein February 7, 2020 at 8:50 am
The oceans have been a net absorber of CO2 since burning of fossil fuels became a significant source of CO2 –> The oceans have been a shock-absorber of CO2 since evah !