Reposted from Dr. Roy Spencer’s Blog
February 5th, 2020 by Roy W. Spencer, Ph. D.
Note: What I present below is scarcely believable to me. I have looked for an error in my analysis, but cannot find one. Nevertheless, extraordinary claims require extraordinary evidence, so let the following be an introduction to a potential issue with current carbon cycle models that might well be easily resolved by others with more experience and insight than I possess.
Summary
Sixty years of Mauna Loa CO2 data compared to yearly estimates of anthropogenic CO2 emissions shows that Mother Nature has been removing 2.3%/year of the “anthropogenic excess” of atmospheric CO2 above a baseline of 295 ppm. When similar calculations are done for the RCP (Representative Concentration Pathway) projections of anthropogenic emissons and CO2 concentrations it is found that the carbon cycle models those projections are based upon remove excess CO2 at only 1/4th the observed rate. If these results are anywhere near accurate, the future RCP projections of CO2, as well as the resulting climate model projection of resulting warming, are probably biased high.
Introduction
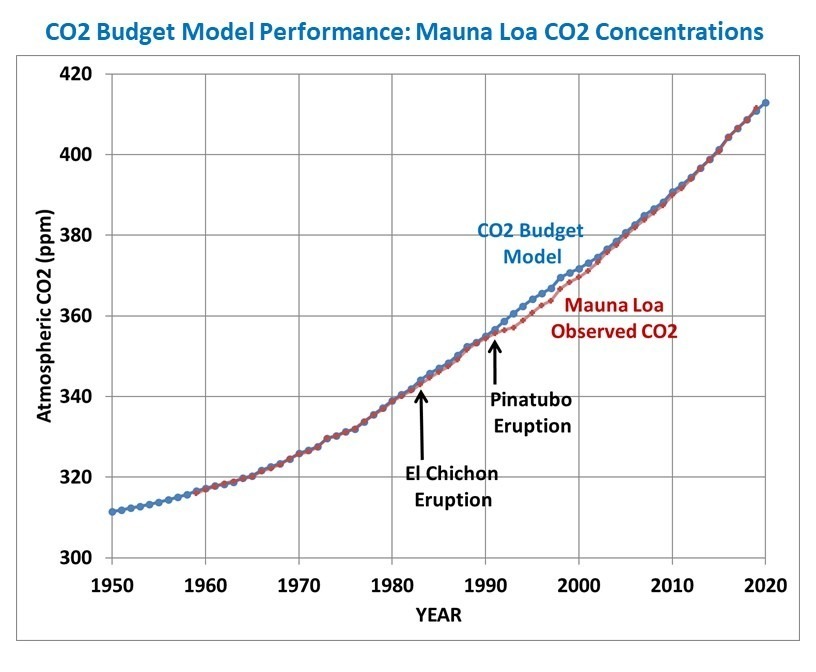
My previous post from a few days ago showed the performance of a simple CO2 budget model that, when forced with estimates of yearly anthropogenic emissions, very closely matches the yearly average Mauna Loa CO2 observations during 1959-2019. I assume that a comparable level of agreement is a necessary condition of any model that is relied upon to predict future levels of atmospheric CO2 if it is have any hope of making useful predictions of climate change.
In that post I forced the model with EIA projections of future emissions (0.6%/yr growth until 2050) and compared it to the RCP (Representative Concentration Pathway) scenarios used for forcing the IPCC climate models. I concluded that we might never reach a doubling of atmospheric CO2 (2XCO2).
But what I did not address was the relative influence on those results of (1) assumed future anthropogenic CO2 emissions versus (2) how fast nature removes excess CO2 from the atmosphere. Most critiques of the RCP scenarios address the former, but not the latter. Both are needed to produce an RCP scenario.
I implied that the RCP scenarios from models did not remove CO2 fast enough, but I did not actually demonstrate it. That is the subject of this short article.
What Should the Atmospheric CO2 Removal Rate be Compared To?
The Earth’s surface naturally absorbs from, and emits into, the huge atmospheric reservoir of CO2 through a variety of biological and geochemical processes.
We can make the simple analogy to a giant vat of water (the atmospheric reservoir of CO2), with a faucet pouring water into the vat and a drain letting water out of the vat. Let’s assume those rates of water gain and loss are nearly equal, in which case the level of water in the vat (the CO2 content of the atmosphere) never changes very much. This was supposedly the natural state of CO2 flows in and out of the atmosphere before the Industrial Revolution, and is an assumption I will make for the purposes of this analysis.
Now let’s add another faucet that drips water into the vat very slowly, over many years, analogous to human emissions of CO2. I think you can see that there must be some change in the removal rate from the drain to offset the extra gain of water, otherwise the water level will rise at the same rate that the additional water is dripping into the vat. It is well known that atmospheric CO2 is rising at only about 50% the rate at which we produce CO2, indicating the “drain” is indeed flowing more strongly.
Note that I don’t really care if 5% or 50% of the water in the vat is exchanged every year through the actions of the main faucet and the drain; I want to know how much faster the drain will accomodate the extra water being put into the tank, limiting the rise of water in the vat. This is also why any arguments [and models] based upon atomic bomb C-14 removal rates are, in my opinion, not very relevant. Those are useful for determining the average rate at which carbon cycles through the atmospheric reservoir, but not for determining how fast the extra ‘overburden’ of CO2 will be removed. For that, we need to know how the biological and geochemical processes change in response to more atmospheric CO2 than they have been used to in centuries past.
The CO2 Removal Fraction vs. Emissions Is Not a Useful Metric
For many years I have seen reference to the average equivalent fraction of excess CO2 that is removed by nature, and I have often (incorrectly) said something similar to this: “about 50% of yearly anthropogenic CO2 emissions do not show up in the atmosphere, because they are absorbed.” I believe this was discussed in the very first IPCC report, FAR. I’ve used that 50% removal fraction myself, many times, to describe how nature removes excess CO2 from the atmosphere.
Recently I realized this is not a very useful metric, and as phrased above is factually incorrect and misleading. In fact, it’s not 50% of the yearly anthropogenic emissions that is absorbed; it’s an amount that is equivalent to 50% of emissions. You see, Mother Nature does not know how much CO2 humanity produces every year; all she knows is the total amount in the atmosphere, and that’s what the biosphere and various geochemical processes respond to.
It’s easy to demonstrate that the removal fraction, as is usually stated, is not very useful. Let’s say humanity cut its CO2 emissions by 50% in a single year, from 100 units to 50 units. If nature had previously been removing about 50 units per year (50 removed versus 100 produced is a 50% removal rate), it would continue to remove very close to 50 units because the atmospheric concentration hasn’t really changed in only one year. The result would be that the new removal fraction would shoot up from 50% to 100%.
Clearly, that change to a 100% removal fraction had nothing to do with an enhanced rate of removal of CO2; it’s entirely because we made the removal rate relative to the wrong variable: yearly anthropogenic emissions. It should be referenced instead to how much “extra” CO2 resides in the atmosphere.
The “Atmospheric Excess” CO2 Removal Rate
The CO2 budget model I described here and here removes atmospheric CO2 at a rate proportional to how high the CO2 concentration is above a background level nature is trying to “relax” to, a reasonable physical expectation that is supported by observational data.
Based upon my analysis of the Mauna Loa CO2 data versus the Boden et al. (2017) estimates of global CO2 emissions, that removal rate is 2.3%/yr of the atmospheric excess above 295 ppm. That simple relationship provides an exceedingly close match to the long-term changes in Mauna Loa yearly CO2 observations, 1959-2019 (I also include the average effects of El Nino and La Nina in the CO2 budget model).
So, the question arises, how does this CO2 removal rate compare to the RCP scenarios used as input to the IPCC climate models? The answer is shown in Fig. 1, where I have computed the yearly average CO2 removal rate from Mauna Loa data, and the simple CO2 budget model in the same way as I did from the RCP scenarios. Since the RCP data I obtained from the source has emissions and CO2 concentrations every 5 (or 10) years from 2000 onward, I computed the yearly average removal rates using those bounding years from both observations and from models.

Fig. 1. [fixed] Computed yearly average rate of removal of atmospheric CO2 above a baseline value of 295 ppm from historical emissions estimates compared to Mauna Loa data (red), the RCP scenarios used by the IPCC CMIP6 climate models, and in a simple time-dependent CO2 budget model forced with historical emissions before, and assumed emissions after, 2018 (blue). Note the time intervals change from 5 to 10 years in 2010.
The four RCP scenarios do indeed have an increasing rate of removal as atmospheric CO2 concentrations rise during the century, but their average rates of removal are much too low. Amazingly, there appears to be about a factor of four discrepancy between the CO2 removal rate deduced from the Mauna Loa data (combined with estimates of historical CO2 emissions) versus the removal rate in the carbon cycle models used for the RCP scenarios during their overlap period, 2000-2019.
Such a large discrepancy seems scarcely believable, but I have checked and re-checked my calculations, which are rather simple: they depend only upon the atmospheric CO2 concentrations, and yearly CO2 emissions, in two bounding years. Since I am not well read in this field, if I have overlooked some basic issue or ignored some previous work on this specific subject, I apologize.
Recomputing the RCP Scenarios with the 2.3%/yr CO2 Removal Rate
This raises the question of what the RCP scenarios of future atmospheric CO2 content would look like if their assumed emissions projections were combined with the Manua Loa-corrected excess CO2 removal rate of 2.3%/yr (above an assumed background value of 295 ppm). Those results are shown in Fig. 2.

Fig. 2. Four RCP scenarios of future atmospheric CO2 through 2100 (solid lines), and corrected for the observed rate of excess CO2 removal based upon Mauna Loa data (2.3%/yr of the CO2 excess above 295 ppm, dashed lines).
Now we can see the effect of just the differences in the carbon cycle models on the RCP scenarios: those full-blown models that try to address all of the individual components of the carbon cycle and how it changes as CO2 concentrations rise, versus my simple (but Mauna Loa data-supportive) model that only deals with the empirical observation that nature removes excess CO2 at a rate of 2.3%/yr of the atmospheric excess above 295 ppm.
This is an aspect of the RCP scenario discussion I seldom see mentioned: The realism of the RCP scenarios is not just a matter of what future CO2 emissions they assume, but also of the carbon cycle model which removes excess CO2 from the atmosphere.
Discussion
I will admit to knowing very little about the carbon cycle models used by the IPCC. I’m sure they are very complex (although I dare say not as complex as Mother Nature) and represent the state-of-the-art in trying to describe all of the various processes that control the huge natural flows of CO2 in and out of the atmosphere.
But uncertainties abound in science, especially where life (e.g. photosynthesis) is involved, and these carbon cycle models are built with the same philosophy as the climate models which use the output from the carbon cycle models: These models are built on the assumption that all of the processes (and their many approximations and parameterizations) which produce a reasonably balanced *average* carbon cycle picture (or *average* climate state) will then accurately predict what will happen when that average state changes (increasing CO2 and warming).
That is not a given.
Sometimes it is useful to step back and take a big-picture approach: What are the CO2 observations telling us about how the global average Earth system is responding to more atmospheric CO2? That is what I have done here, and it seems like a model match to such a basic metric (how fast is nature removing excess CO2 from the atmosphere, as the CO2 concentration rises) would be a basic and necessary test of those models.
According to Fig. 1, the carbon cycle models do not match what nature is telling us. And according to Fig. 2, it makes a big difference to the RCP scenarios of future CO2 concentrations in the atmosphere, which will in turn impact future projections of climate change.
That might explain:
https://phzoe.wordpress.com/2020/02/05/pressure-change-and-real-standard-pressure/
Interesting link. The part that said sea level pressure was decided by a committee, made me remember the old adage that the Camel is a Horse that was designed by a committee 🙂
A camel is well suited to its environment while a horse would struggle to survive in that environment. One can not make the same statement about models that are used in
Climate Science™.
Climate Science is trademarked? Always about the $$
Grant Willetts…perhaps you misunderstood that “Climate Science™” is intended as joke, which itself is meant to indicate “climate science” is a brand and not real science.
rip
Strangely, the camel originated in Arctic areas and its feet developed to deal with snow. Climate altered and the camel adapted itself somehow to deal with deserts and sand. Camels are ferociously adaptable.
Evidence? Sources?
Mid-Pliocene warm-period deposits in the High Arctic yield insight into camel evolution
https://www.nature.com/articles/ncomms2516
warm-period
MarkW February 6, 2020 at 7:43 am
warm-period. hothouse.
Hey, you can’t use Climate Science® without paying a licence fee!
I encourage everyone to read Zoe’s blog. Rare bold thinking coupled with clear logic and distilled mathematical essentials.
Serious – have a read.
Ok, I did that, specifically the post linked to. She says “atmospheric pressure obviously should be going up along with temperatures.”
I disagree. It would be true if the atmosphere were confined, but it is not. If the atmospheric temperature rises, the atmosphere will expand, but the total mass (weight) of the air column above sea level doesn’t change, which is what determines pressure. (I suppose one could argue that the top of the expanded atmosphere would be further from the center of gravity of the Earth, so in principle the pressure should actually decline a bit with temperature, maybe, but the effect would be infinitesimal given the small thickness of atmosphere relative to the planet’s radius.)
How about ocean evaporation?
How about converting O2 (32g/mol) into CO2 (44 g/mol)?
You don’t think higher temperatures leads to more evaporation?
Also, mass is not the only factor. Temperature increase causes molecular velocity increase, which increases pressure.
” (I suppose one could argue that the top of the expanded atmosphere would be further from the center of gravity of the Earth, so in principle the pressure should actually decline a bit with temperature, maybe, but the effect would be infinitesimal given the small thickness of atmosphere relative to the planet’s radius.)”
Yes I have argued this (kind of) But it is not just the upper part of the expanded atmosphere that would be further from the centre of gravity but the whole of that atmosphere would thinner (less dense) too. Pressure should reduce. (or stay the same?) but not increase unless it had a lid on it.
Yes infinitesimal but then so are the increments of the rise in temp.
A gas at absolute zero has no pressure, no matter what its mass.
Zoe Phin,
atmospheric pressure is the same for 1 mol CO2, O2, N2 or Ar,… Thus converting one mol O2 in CO2 or reverse doesn’t change the atmospheric pressure of the sum of all molecules.
For the solubility of any gas at sea level only the partial pressure of that gas at sea level is important, not the total pressure of all gases…
(@phoenix)
If the temperature of the atmosphere were reduced to absolute zero, each molecule would have zero kinetic energy, and its weight would make it fall to the surface of the Earth, where it would be stopped by contact forces. The upward normal reaction would still have to equal the weight of the atmosphere, so “atmospheric” pressure would be unchanged.
Ferdinand,
For an ideal gas, true.
For a real gas, false.
Van der Waal forces differ by gas.
Zoe Phin is correct in saying that increasing temperature will tend, indirectly, to increase atmospheric pressure. (Via extra water vapor increasing the weight of the air column.) Also, Diogenes and Mike are correct that it will tend to decrease atmospheric pressure by lifting the atmosphere to positions with lower values of g. It’s hard to say which effect would predominate.
She is also correct in saying the increased molecular velocities that come with increased temperature will tend to increase pressure (as force equals rate of change of momentum). I haven’t seen her mention it, but increased velocity would also increase the frequency of collisions between each molecule and the ground. So, other things being equal, this double effect means pressure should increase in proportion with velocity squared, i.e. with temperature. But, on her blog, she accepts that other things will not be equal — increased temperature will cause thermal expansion. This will cause decreased density, and so decreased frequency of collisions, and so decreased pressure.
Below the line at her blog, Diogenes, GallopingCamel and I are arguing that the three effects of increased temperature on atmospheric pressure must cancel out (as the pressure must equal the weight of the atmospheric column), while Zoe insists that the effects increasing the pressure will predominate. I don’t understand her arguments.
“How about ocean evaporation?”
Water vapor is only 18 g/mol, much lighter than both O2, N2 and CO2.
Nikolov and Zeller made an excellent case for how T and P are intertwined.
Unfortunately they got causality wrong.
I don’t need to prove my statement, it’s already well established.
I’m surprised no one pointed out that perhaps the method of deriving sea/surface pressure may be slightly wrong? And so the decreasing pressure is a methodology problem.
tty,
“Water vapor is only 18 g/mol, much lighter than both O2, N2 and CO2.”
Yes, but it’s still an addition.
That’s what I was thinking. Adding a significant mass of hydrogen to the atmosphere would still increase the total mass (& I assume the atmos pressure). Of course, hydrogen would escape to space quickly….
And an elephant is a horse built to a military specification.
Zoe Phin,
The removal of CO2 by the oceans (and vegetation) is in direct ratio with the difference in CO2 pressure in the atmosphere (pCO2atm which is ~ppmv) and the pCO2aq in the ocean surface. That is about the partial pressure of CO2, not the full atmospheric pressure and depends of Henry’s law which says that for a given temperature there is always the same ratio between gas in solution and atmosphere for any gas, no matter if that gas is in near full vacuum or surrounded by other gases with much higher pressure…
The average pCO2(aq) pressure for the average ocean surface temperature is around 290 microatm, which is about the same as ppmv in the atmosphere.
As 410 ppmv is about 0.00041 bar CO2 pressure at this moment, that presses some extra CO2 in the oceans and vegetation.
Calculated over the past 60 years that is indeed a change rate of over 2% or an e-fold decay rate of ~50 years or a half life of ~35 years.
That means that without further emissions, the extra 120 ppmv CO2 in the atmosphere would halve in 35 years, 1/4 in 70 years, 1/8 in 105 years, etc. Or if humans would halve their CO2 emissions, there was no further increase in the atmosphere.
What is the difference with the IPCC? The IPCC uses the Bern model (and similar models) which assume a saturation of the oceans and vegetation as sinks. Until now, that is only the case for the ocean surface, which has a limited buffer capacity and only absorbs some 10% of the change in the atmosphere.
That is not the case for the deep oceans, which show no sign of saturation at the sink places near the poles and certainly not for vegetation which can use much higher CO2 levels…
Ferdinand,
The point was to get 750 smart people to visit my site so they can learn the real pressure standard and pressure change over time.
We have had this discussion before.
The ocean reservoir for holding CO2 is vast, but it its non-linear, governed by reaction-rate chemistry and not by Henry’s law.
There is something called the Revelle Constant, where a 10-part increase in bulk atmospheric CO2 concentration, at equilibrium, results in a 1-part increase in CO2 in the “inorganic carbonates” in ocean water. It is the Revelle Constant and the 10th-power coefficient in the chemical equilibrium equations in multi-link chain of reactions in the carbonate species that accounts for this behavior, and this is what Murry Salby is missing in his claim that very little of the increase in atmospheric CO2 is the fault of humans.
The ocean holds 50 times the CO2 of the atmosphere, but even with the Revelle Constant, emitted CO2 should partition into 1 part in the atmosphere and 5 parts in the ocean. Emitted CO2 appears (emphasis on appears as claimed by Dr. Spencer’s post) to be partitioning into 1 part atmosphere, .5 parts inorganic compounds in ocean water and .5 parts photosynthesis. The lower sinking by the ocean is attributed to the slow mixing between a shallow surface layer and the much larger deep ocean. This partitioning is consistent with accurate measurement of atmospheric O2, which gives the split between inorganic CO2 sinks that don’t emit O2 and the organic photosynthetic CO2 sinks that do.
By the way, you have been arguing with anyone who will listen that the rapid C14 extinction of bomb-test radiocarbon is not the same as the residence time of bulk CO2 additions to the atmosphere. You are right, but you are wrong about Henry’s Law. The linear Henry’s law model will not give a difference between the two times, only the non-linear Revelle Constant (actually the 10th-power exponent in the chemical equilibrium equations does that).
That half of the human-caused CO2 emissions end up in the atmosphere, half of the those emissions end up in sinks, with half of the sink being ocean water (not governed by Henry’s Law but by reaction-rate exponents) and half being green plants all ties together with most of the Keeling curve increase in CO2 being the human-caused emissions not going into sinks.
It all ties up until you consider the large-in-comparison-to-the-putative-anthropogenic year-to-year fluctuations in the rate-of-increase in atmospheric CO2 — what Murry Salby along with the Wood for Trees Web site points out. This fluctuation is correlated with rear-to-year fluctuations in global temperature anomaly, suggesting that there is a temperature-stimulated natural CO2 emission.
You, Ferdinand Engelbeen, have claimed here on WUWT that the source of the temperature-stimulated emission is the shallow leaf litter in the world’s tropical forest. I believe you told us that this is what Pieter Tans is telling us, the carbon-cycle expert at NOAA.
What if the source of the temperature-stimulated emission includes temperate-zone soils that store several atmospheres-worth of carbon in compared to the fraction-of-an-atmosphere held in the much thinner tropical soils? What if another source of the temperature-stimulated emission includes upwelling ocean water as part of the ENSO? In order to match the Keeling curve, the CO2 emission being fed from much deeper, longer-acting sources needs to be balanced by a sink. There is increasing evidence that this sink is CO2 uptake by increase plant growth — “greening.”
Salby’s mantra is “natural emissions proportional to temperature, photosynthetic sink proportional to atmospheric concentration.” Salby is right, actually, about half right. If you have a deep enough carbon store where the temperature-stimulated emissions act over time, to get the Keeling curve to match requires the increase in atmospheric CO2 to be about half human-caused, half the temperature-stimulated (or temperature-correlated in the case of upwelling ocean water) emission, and the green plant uptake needs sufficient sensitivity to increase atmospheric CO2 concentrations to balance the carbon model.
Paul,
A few remarks:
1. In first instance, Henry’s law still stands even for seawater, thus a doubling of CO2 in the atmosphere doubles free CO2 in water. For fresh water there it end, because fresh water contains 99% pure CO2/H2CO3 in solution. For seawater CO2 in solution is only 1%, the rest is (bi)carbonates. Due to chemical equilibria, that makes that about 10 times more CO2 is dissolved than in fresh water, but 10 times less than expected from the increase of CO2 in the atmosphere.
For the about 1000 PgC in the mixed ocean layer that is about 40 PgC for the 35% increase in the atmosphere, hardly a sink. The main sink in the oceans therefore is in the deep via the cold sink places like the THC in the N.E, Atlantic.
2. The faster removal of some excess 14CO2 than for some excess 12CO2 is not the effect of the Revelle factor or the slight differences in solution speed, but of the deep ocean circulation,
What did go into the deep oceans in 1960 at the peak of the bomb tests was the isotopic composition of that moment (minus the shift at the air-water border)
What did come out of the deep oceans in 1960 was the isotopic composition of ~1000 years before, thinned with the 14C/12C ratio of the deep oceans and the shift at the water-air border.
For the 12CO2 increase in 1960, of the 12CO2 mass that did sink that year into the deep, some 97.5% as 12CO2 mass returned in the same year, but for 14CO2 that was only 45%. That made the 14CO2 level return to equilibrium much faster than for 12CO2. See:
http://www.ferdinand-engelbeen.be/klimaat/klim_img/14co2_distri_1960.jpg
3. Year by year variability is just noise with for the extremes (Pinatubo, El Niño) maximum +/- 1.5 ppmv around the 90 ppmv trend 1960-current and after a few years gets back to zero.
Both the oceans (DIC) and vegetation (greening, O2 balance) are proven sinks for CO2 and their contribution to the increase in the atmosphere is negative with only 1998 (El Niño) within the margins of error for any positive contribution in the past 60 years.
You are ignoring blooms and whitings. Volcanic explosions, inputs of minerals from rivers , especially Ca, Sillica, Fe, slight warming etc, produce massive blooms in phytoplankton and precipitation in CaCO3 which produces organic and carbonate rich marine sediments. The growth is exponential. As several factors are required to produce exponential growth, it is difficult to model. Think of algal blooms from too much fertilisers. The Paleocene/Eocene Thermal Thernal peak produced organic rich marine sediments. Photosynthesis is an endothermic reaction, it produces cooling. Phytoplankton are a few mms across so can ions can rapidly pass into them when needed for growth. Phytoplankton will respond quickly to increase in temperature must faster than large plants, several metres in height. Vast explosions such as Krakatoa not only kept heat out of the earth but the mineralisation of the oceans would have produced phytoplankton blooms whose photosynthesis would have cooled the oceans.
The mistake is is to think that the Earth undergoes uniform and slow change. Yes it does but there are periods of massive change; heating , cooling and volcanic explosions. Aererobic biological and photosynthesis will slow down heating.
With setting ranges
set y2range [101.24 to 101.12];
there’s data arbitrary excluded.
OTOH the “Committee” equal arbitrary presented data.
____________________________________
In order to rule out these procedural errors, actually differences that have already been calculated, should be transferred instead of absolute values.
I’ve seen stats that the equivalent land area of the USA in new green leafs have been added to the planet since ~1959. I wonder if anyone has tried to balance the biomass against the removed excess CO2 mass.
It’s not only land plants but also algae and bacteria sucking up the CO2. I don’t think anyone has true grasp of what’s going on the oceans
Then there are sea shells, growth of coral reefs, deposition of carbonaceous sediments and deposition of calcareous sediments to name four more natural factors sequestrating carbon dioxide.
MCHENRY and Barcoo, both good comments, and the processes you mention tend to lead to the generation of Black Gold, which some profit-motive individuals tend to extract and recycle into the whole process! Is this a great deal or what?
Does bio-turbidity make it impossible to take cores of recent decades (upper) sediment to estimate the amount of additional biomass the CO2 might be contributing to?
Thomas Mark Schaefer February 6, 2020 at 7:16 am
Does bio-turbidity make it impossible to take cores of recent decades (upper) sediment.
___________________________
No, in the name of objective balanced unbiased science it hasn’t to be made “impossible”.
Maybe next year.
Surely the largest source of photosynthesis is phytoplankton? we cannot measure this mass accurately as it changes yearly, so how can we measure the absorption of CO2? Growth of bacteria and small organisms tend to be exponential when the conditions are right , hence various algal blooms when too much fertliser enters water. A volcanic explosion depositing minerals on seawater combined with an increase in CO2 and a decadal increase in warming would produce a massive increase in phytoplankton mass and also the rate at at which it photsynthesis takes place.
Complex systems have inherent regulation features. Very little in nature is static in terms of how systems operate. Basic characteristics — speed of light, atomic weights, the gas pressure laws, etc. — are unchanging, but they serve as fundamental building blocks and only participate in dynamic interactions as energy flows through systems.
“the gas pressure laws,”
That statement reminded me of my qualification training in Submarines 60 years ago. I and other class members questioned how the LiOH “CO2 absorber canisters” could help us breath if they only got rid of CO2 and did not make O2. The answer was “Because of partial pressure rules of the CO2 and O2 on your lungs. There is still O2 left you just not get enough into your blood. High CO2 prevents you from getting the O2 you need. Lowering the CO2 level increases the partial pressure of the O2 and allows your lungs absorb the O2 you need. ” [Paraphrased from my 60 year old relocation.]
Not a botanist, however, I would assume that an increased partial pressure of CO2 would be absorbed better, easier and thuss aid plant growth. Which would explain the monstrous plants on Earth when the CO2 levels were much higher. And models should take that into account.
Hemoglobin’s affinity for oxygen is pH dependent. Too much CO2 and it can’t easily absorb O2. The fact that hydroxide doesn’t generate O2 is of little consequence because O2 is about 21% of air and CO2 at 5000 ppm is only 0.5% of air.
Eventually, however, O2 must be replenished.
Also CO2 levels control breathing. Hyperventilating into a bag stops hyperventilation because CO2 levels rise.
It will also affect your breathing, since the breathing reflex is completely controlled by the amount of CO2 in your lungs, not the amount of O2.
This is why hypoxia is so insidious, you do not really notice anything much, you just “fall asleep”.
How surprising!
Life is not a static system. It’s defining physical characteristic is that poisonous element, carbon, and its defining functional characteristic is adaptability.
Salute!
Great point, Richard.
Reminds me of the politicians and some government clerks that use “static” economic conditions to calculate the “cost” of a tax reduction, when the real world exhibits significant changes in behaviour due to changes in taxation. Laffer curve is one of the best examples to use IMHO.
Likewise, I have a hard time with any climate model that ignores changes in the behaviour of nature’s CO2 emitters and absorbers.
Gums sends…
“What is the chatelier’s principle? Alex.”
Dajake See “Le Chatelier’s Principle”
Interesting.
I never thought about applying Le chatelier’s principle outside of chemical equilibrium. Might be more complex but no reason it shouldn’t apply to bio-geo-chemical equilibrium issues.
chemman February 5, 2020 at 3:01 pm
Interesting.
I never thought about applying Le chatelier’s principle outside of chemical equilibrium. Might be more complex but no reason it shouldn’t apply to bio-geo-chemical equilibrium issues.
Because chemman said so.
Instead chatelier’s principle seemingly extends chatelier’s principle to any equilibrium systems.
https://www.google.com/search?q=stable+unstable+indifferent&oq=stable+unstable+indifferent+&aqs=chrome.
Ol’ George Orwell would be mightily chuffed at how his ‘1984’ literary legacy is being implemented by the IPCC et al –
The reality situation properly described as “Oh fudge, this is really not a problem at all” is now routinely announced as “It’s worse that we thought!”
On this graph I have used Dr. Spencer’s UAH data, it would suggest that that high solar activity cools atmosphere, which is contrary to what might be expected
http://www.vukcevic.co.uk/UAH-SSN.htm
It’s most likely to be just a coincidence; however a comment from Dr. Spencer will be appreciated.
The sunspot cycle goes from solar maximum at the beginning of the period to solar minimum at the end, which makes the slope negative (upward to the right using your inverted Y axis.) The best way to get the sunspot trend is to only look at complete solar cycles.
Here it is as requested, three complete cycles trend
http://www.vukcevic.co.uk/UAH-SSN-2.gif
trend-lines equations are
Now: peak to peak y = -2.2109x + 4482.7
Before: max to min y = -2.2018x + 4464.7
as you can see almost identical.
When I said cooling, I was having in mind more the impact of the SSN cycles’ peaks.
Is it likely that there is a half cycle lag in the temperature? Just thinking.
Could be, in which case the heat is due to oceans back radiation rather than absorption directly from TSI, since the atmosphere has low heat capacity to provide for few years delay.
I would think that spectral analysis of the radiation collected by satellite sensors should be able to determine contribution from direct and indirect heat content. If Dr Spencer and his team have such data it would be a useful addition to climate change debate.
Alternatively:
During high solar activity there might be a lower atmospheric humidity (GCR etc) which may have not much effect on the day time temperatures but it would make night time temperatures lower (less vapour GHG effect), making the daily average somewhat lower than it would be the case in an identical situation at the low part of the sunspot cycle.
Is it likely that there is a half cycle lag in the temperature? Just thinking.
Vuk February 6, 2020 at 1:15 am
Could be, in which case the heat is due to oceans back radiation rather than absorption directly from TSI, since the atmosphere has low heat capacity to provide for few years delay.
___________________________
Too, sunspot cycles lasting the crude amount of 2 times ~11.3 years over quasi biennial oscillation
yields some cycles occurring unnoticed while others show more than 1 El Niño events.
What’s seen as lags may be just uncertainty.
How dare She! That said, sampling between the lines is a well known problem, mitigated through deductive in lieu of inferential processes, observation in lieu of hypotheses (e.g. models), or reducing the frame of reference.
Fantastic to shine a light on this! If the current history at Mauna Loa really does prove that modeled CO2 absorption rates are too low, it it really big news!
On the down side, I would be stunned if even the Bern Model hadn’t been tweaked to match history well – it does have ?9 parameters – 5 half lives applying to 5 variable sized ‘buckets’ of CO2. (Might be 4 of each). The last bucket has an infinite half life. This is maybe coding the assertion stated in comments to your previous post that some CO2 just never gets absorbed. That kind of effect seems likely to bias the results up in the long term and give the kind of discrepancies you are talking about compared to a single-half-life model.
How nature knows which CO2 to leave in the atmosphere always puzzled me…
As I said in a comment at Dr. Spencer’s article at his website, the models (more specifically the RCPs which is what the CMIP5 models use) actually agree with Spencer’s model during 2000-2020. I left a comment with details including my mathematical work and citations below, that is not a response to anyone else’s comment, and I expect it will show up soon.
russell robles-thome :
“How nature knows which CO2 to leave in the atmosphere always puzzled me…”
Nature doesn’t know, it just reacts on the extra CO2 pressure in the atmosphere, whatever the source of that extra CO2 or whatever the composition of what is removed.
That nature is removing about half the human input of each year (as mass, not the original human induced molecules!) is just coincidence: humans emitted a slightly linear amount of CO2 over the years, which caused a slightly linear increase in the atmosphere and as result a slightly linear sink rate increase each year and therefore a near constant ratio between human emissions and removal.
If humans would halve their emissions, emissions and removal are equal and no further increase in the atmosphere would occur…
The explanation of how nature distinguishes between buckets of CO2 is in the non-linear Revelle buffer/constant of the net reaction rate exponent of the inorganic carbonate chemical system in ocean water.
Individual CO2 molecules are swapped back and forth at the atmosphere/ocean surface interface, diluting “bomb carbon” in the atmosphere. A bulk increase of 10 units of CO2 in the atmosphere results in only a 1 unit increase in CO2 in the mixed layer of ocean water near the surface because of the 10th power exponent in the chemical equilibrium equation. Hence the residence of a CO2 pulse added to the atmosphere is longer than the residence of the bomb-carbon C14 concentration subject to the 2-way exchange.
Were CO2 solubility in ocean water governed by Henry’s Law, however, a 10 unit increase of atmospheric CO2 would be accompanied by a 10 unit increase in ocean water, and the extinction half-life of radiocarbon would be exactly the same as the relaxation of a bulk pulse of atmospheric CO2.
In the Bern Model, if I am remembering correctly, there is a chunk of emissions with an atmospheric half-life of infinity, i.e. is never absorbed. That is probably best viewed as a mathematical device for getting the absorption v time they want, because it is on its face nonsensical, because there is no way for the physics to identify which part of the atmosphere is going to refuse to be absorbed.
The Bern model originally was was based on a one-time release of 3000 and 5000 PgC, that is all (the then) available gas and oil and the second one also with a lot of coal. In such a case, one can expect a saturation of even the deep oceans (for vegetation even probably not). And a lot of CO2 remaining in the atmosphere even after full equilibrium with the deep oceans.
For much smaller quantities, there is only saturation of the ocean surface, not in the foreseeable future for the deep oceans and certainly not for vegetation, but still they use the Bern model for that purpose, which makes no sense.
20 years ago there was already a discussion between Peter Dietze and Fortunat Joos, the man behind the Bern model and others on the blog of the late John Daly:
http://www.john-daly.com/dietze/cmodcalc.htm
No, no, NO!
It can’t be nature, it just can’t be.
It HAS to be carbon taxes doing this, right?
I mean, here in Canada, Prime Minstrel Zoolander’s government just announced that, indeed, our carbon taxes are WORKING*.
* well, tax-wise, that is. No measurement on how much its actually lowering CO2, but that’s the hard stuff. EVERYONE GETS FREE MONEY!!!!
The carbon cycle is poorly understood and essentially a void when it comes comes to usable metrics that measure what is actually happening. Never mind why.
The lack of carbon cycle metrics makes AGW a speculative endeavor. You can call it speculative science if you want to, but it is not experimental science.
EIA.gov says the global annual CO2 emissions have nearly doubled since 1980. Yet the Mauna Loa graph is pretty linear. That tells me something is responding to keep it that way.
I’m fairly certain Mauna Loa is not recording CO2, but simply uses a pre-programmed increase algorithm. I don’t even think I’m joking.
Your guess is incorrect. There are several Earth Monitoring Stations, one at the tip of Sea Point south of Cape Town. They are calibrated hourly or something like that, and largely automated, though have one or two volunteer scientists on hand all year. They measure CO2 and mercury and man other trace gases in the atmosphere.
The data is publicly available and it shows interesting variations that were unexpected, such as the rapid rise and fall of mercury in the air over a period of hours. It had previously been assumed it was virtually constant everywhere in the world – not so.
There is a station on the North short of Canada and you can log on to see the readings and history. The mercury rises and falls there too. No one has any idea why. It means there is some biological process going on in the atmosphere that “eats'” mercury.
Bacteria in the ocean water column is “eating” the mercury most probably. They make methyl mercury which winds up in the food chain
Zoe Phin,
Tens of stations from many different organizations in a lot of different countries and a lot of different people involved over many decades… Impossible to manipulate the data without one whistle blower to bring that out (and near impossible to implement that either), See a part of the many stations all over the world here:
https://www.esrl.noaa.gov/gmd/dv/iadv/
science is settled..
From a layman’s perspective – I don’t see a lot of carcasses go to waste on the Savannah – I don’t imagine all that plant-food would go to waste either.
This all assumes that the sinks are constant.
If the sink is growing independently of the atmospheric concertation then the amount removed from the atmosphere is not only proportional to the total atmospheric concentration. It is more than that.
And if the sink is shrinking independently of the atmospheric concertation then the amount removed from the atmosphere is not only proportional to the total atmospheric concentration. It is less than that.
This is important as the natural emissions and re-absorption dwarf anthropogenic emissions. Also because the oceans ability to absorb CO2 is temperature dependant with a 800 year lag (according to Antarctic ice cores).
So you might be trying to guess a dog’s bark by its colour. It might be completely irrelevant.
Yes. While i applayd all work in CO2 understanding, the fundamental premises are not examined.
As I said in a comment that I left at the Dr. Spencer article, at http://www.drroyspencer.com/2020/02/nature-has-been-removing-excess-co2-4x-faster-than-ipcc-models/#comments
I had a look at the graphs on the sixth page (“Page 138”) of https://science2017.globalchange.gov/downloads/CSSR_Ch4_Climate_Models_Scenarios_Projections.pdf
I look at RCPs 2.6 and 4.5, which are nearly the same thing as each other from 2000 to 2020. (According to the upper right one of 8 graphs.)
My eyeball estimate of emissions over that time is average of 9.4 GtC per year. That times 20 years is 188 gigatonnes of carbon. That times 44/12 (the molar masses of CO2 and carbon respectively) is 689 gigatonnes of CO2 emitted into the atmosphere from 2000 to 2020 according to RCPs 2.6 and 4.5 (approximately).
Earth’s atmosphere has a mass of approx. 5,150,000 gigatonnes. 689 gigatonnes is 133.8 PPM of that by mass. The PPM normally used for atmospheric CO2 is PPMV or PPM by number of molecules. A CO2 molecule has 44/29.1 of the mass of an average air molecule, so 133.8 PPM by mass is 88.5 PPMV or PPM by number of molecules.
The lower right one of the eight graphs on “Page 138” shows atmospheric CO2 concentration projected by the RCPs. (This is PPM CO2, not the “equivalent PPM CO2” shown in a similar graph at some other sources.) My eyeball estimate is that all RCPS and especially RCPs 2.6 and 4.5 have atmospheric CO2 at about 370 PPM at 2000 and about 415 PPM at 2020. This means that during 2000-2020 when enough CO2 to raise its atmospheric concentration by 88.5 PPM was emitted into the atmosphere, the atmosphere gained 45 PPM and 43.5 PPM was removed from the atmosphere by nature.
These numbers are only approximate, I achieved them in part from eyeballing graphs. They are consistent with natural removal of CO2 from the atmosphere being equal to about half of anthropogenic emissions. And using 392.5 PPM (average of 370 and 415 PPM for average CO2 concentration over 2000-2020 which is slightly off because the increase is not linear) and average annual removal rate of 2.175 PPM per year (43.5/20), I come up with removal per year being about 2.23% of the excess over 295 PPM. This means that I see (during 2000-2020) the RCPs, especially RCPs 2.6 and 4.5, being close to agreeing with Dr. Spencer’s simple model.
Very small self-correction: I should have used 29 instead of 29.1 as the average molar mass of air molecules. I was remembering a value that worked for me in past calculations of speed of sound and resonance in loudspeaker enclosures.
The simple analogy of a water tank with a hole in it is useful in a purely simple explanation, however nature is rarely simple.
A better analogy is to imagine a water tank shaped as a cylinder and very high. In the side of the cylinder someone has cut holes – some are narrow triangles, some inverted triangles, some circular and substantial and others pinpricks. Feeding into this water tank is the sum of water from many small pipes, many of which are linked to the holes found in the side of the tank (the water is raised by an imaginary pump to feed back in). Some represent volcanoes or underwater vents, some represent random large forest fires. They are all variable over time.
Now imagine adding a small pipe dripping water into this tank which represents anthropogenic CO2. What will happen? Remember there are a lot of cuts in the side of the cylinder, some already below waterline, some at the waterline, and some above. If the slits and holes are small enough at the waterline, the waterline will start rising, but without actually knowing the shapes of the cuts at and above the waterline one cannot predict the future. This is a better thought image of the Earth’s natural system concerning the emission and absorption of CO2 – it isn’t some silly one input, one tank, one output. That’s where the general public just imagines all this wrong.
I for one have NEVER believed in a linear simple response to CO2. The richer the air becomes with CO2, the more complex I will expect the response to be. It would not surprise me one bit if the IPCC has silly, over-simple and completely wrong projections of future CO2 in the atmosphere – its just not something we know enough about.
Yup – the basic assumption is simply wrong. Atmospheric CO2 has varied naturally from about 180 to 7000 ppm, and they are trying to sell “it was all in balance,” based on highly questionable proxies (ice cores) when “we” started adding to the mix our 3-4% pittance. Sorry, that just doesn’t wash.
Thanks for the plankton.
===================
Moderator, The graph in Figure 1 posted here doesn’t match the one in Dr. Spencer’s blog.
I can easily accept the main ideas of this story like this: “In fact, it’s not 50% of the yearly anthropogenic emissions that is absorbed; it’s an amount that is equivalent to 50% of emissions.” Of course, the sinks do not react to the yearly emissions but on the real concentrations of CO2 in the atmosphere.
I have used the same kind of super-simple model like Dr. Spencer has done, link:
http://www.journalrepository.org/media/journals/PSIJ_33/2015/Jul/Ollila812015PSIJ18625.pdf
My own more complicated model with 26 equations starts to deviate from this simple model after the year 2040-50. The reason is that the mixing layer of the oceans becomes gradually more saturated with the CO2, and therefore more CO2 flows back from the oceans into the atmosphere. Please note that there are huge fluxes from the atmosphere into the oceans and backward – the magnitude being about 85…90 GtC/yr.
The RCP8.5 is totally unrealistic. If it would become true, the CO2 increase rate should increase from the present rate of 2.3 ppm/yr to about 6.3 ppm/yr. By common sense we can estimate that it will never happen.
The carbon cycle models approved by the IPCC – Bern2.5CC and Joos et al. (2013) – show that the increase of the atmospheric CO2 amount is totally anthropogenic by nature. It would mean the permille value of about -13‰ but the observed value is about -8.5‰. The missing comments – against or in favor of my research study results – show that even the climate contrarians and skeptics do not know anything about this issue. I doubt that only a handful of real climate scientist is aware of this.
Antero Ollila,
A few remarks:
1. The ocean surface is rapidly exchanging CO2 with the atmosphere (exchange rate less than a year) and simply follows the CO2 in the atmosphere with a small lag.
While there is a 100% change in dissolved CO2 in seawater for a 100% change in the atmosphere, per Henry’s law, free CO2 in solution in seawater is only 1%. 90% is bicarbonate and 9% is carbonate.
If free CO2 increases, (bi)carbonate also increases, but also H+. pushing the equilibria back to free CO2. The net result is that all C species together (DIC: dissolved inorganic carbon) increases with about 10% in the ocean surface for a 100% increase in the atmosphere. As the ocean surface contains about 1000 PgC and the atmosphere about 830 PgC, the 35% extra CO2 in the atmosphere caused not more than some 40 PgC (4%) extra DIC in the ocean surface.
For that “reservoir” the IPCC’s Bern model is right, but not for the deep oceans or vegetation. The deep oceans receive their extra CO2 from waters sinking near the poles where temperatures are low and a lot of CO2 sinks with the waters to get isolated from the surface for about 1000 years. There is no sign of saturation of the polar waters…
2. The -13‰ is only if all human emissions would remain in the atmosphere. The exchanges with ocean surface ans seasonal with vegetation are rapid and any change in 13C/12C ratio is rapidly distributed over these three reservoirs, that plays little role.
The important “thinning” of the human “fingerprint” is from the exchange with the deep oceans: what goes into the deep oceans is the isotopic composition of today, what comes out is the composition of ~1000 years ago. Plus the changes in the deep from dissolved rock and dropouts from the surface.
One can estimate the amount of deep ocean exchange with the atmosphere, based on the isotopic “dilution” of the human emissions:
http://www.ferdinand-engelbeen.be/klimaat/klim_img/deep_ocean_air_zero.jpg
Which shows about 40 PgC/year as exchange flux, independently confirmed by the rapid decay of 14C from the 1950-1960 nuclear bomb tests.
The discrepancy before 1990 was probably from vegetation which was a slight source before 1990 and an slight, but growing CO2 sink after 1990.
Roy,
The IPCC model is based on a dead concept. The recycle theory of water and CO2 which assumes the only new source of water and CO2 that is coming into the biosphere is from volcanic eruptions. That assumption is not correct.
You need a second scenario and some help understanding conceptual analysis for a constrained physical problem where there are piles and piles of paradoxes/anomalies.
Salby and others in a dozen different peer reviewed papers using completely different analytical techniques have shown that atmospheric CO2 is tracking temperature changes not anthropogenic CO2 emissions.
That is only possible if there is another large source (faucet) of CO2 that is entering the biosphere in addition to the CO2 that is emitted by volcanic eruptions.
We have discovered there is another CO2 drain, particulate matter is falling to the bottom of the ocean where it is sequestrated.
The Bern model assumes that ocean circulation (with hundreds of years delay) is the only method for deep sequestration of CO2 in the ocean.
As this review summary points out, the particulate organic pool in the ocean is estimated to sink 130% of the atmospheric CO2 pool in a year.
Carbon cycle modelling and the residence time of natural and anthropogenic atmospheric CO2: on the construction of the “Greenhouse Effect Global Warming” dogma.
https://www.co2web.info/ESEF3VO2.pdf
The alleged long lifetime of 500 years for carbon diffusing to the deep ocean is of no relevance to the debate on the fate of anthropogenic CO2 and the “Greenhouse Effect”, because POC (particular organic carbon; carbon pool of about 1000 giga-tonnes; some 130% of the atmospheric carbon pool) can sink to the bottom of the ocean in less than a year (Toggweiler, 1990).
We have discovered that C14 from the bomb test is making it the deep oceans. This disproves the IPCC assumption that there is zero particulate matter being sequestrated in the deep ocean.
https://www.livescience.com/65466-bomb-carbon-deepest-ocean-trenches.html
Bomb C14 Found in Ocean Deepest Trenches
‘Bomb Carbon’ from Cold War Nuclear Tests Found in the Ocean’s Deepest Trenches
Bottom feeders
Organic matter in the amphipods’ guts held carbon-14, but the carbon-14 levels in the amphipods’ bodies were much higher. Over time, a diet rich in carbon-14 likely flooded the amphipods’ tissues with bomb carbon, the scientists concluded.
Ocean circulation alone would take centuries to carry bomb carbon to the deep sea. But thanks to the ocean food chain, bomb carbon arrived at the seafloor far sooner than expected, lead study author Ning Wang, a geochemist at the Chinese Academy of Sciences in Guangzhou, said in a statement.
This study indicates that three times more water is being dragged down into the mantel than previously estimated.
Seismic study reveals 3 times more water dragged into Earth’s interior
https://www.sciencedaily.com/releases/2018/11/181114132013.htm
Slow-motion collisions of tectonic plates under the ocean drag about three times more water down into the deep Earth than previously estimated, according to a first-of-its-kind seismic study that spans the Mariana Trench.
“Salby and others in a dozen different peer reviewed papers”
Where is there a peer-reviewed paper from Salby on this? I’ve never seen anything in writing from Salby at all, let alone peer-reviewed.
Salby, M. and Titova, E., 2013, April. Relationship between CO2 and Global Temperature: Simulated vs Observed. In EGU General Assembly Conference Abstracts (Vol. 15).
Physics of the Atmosphere and Climate 2nd Ed.
See preview on Page 68
Publications:
Murry L. Salby’s research while affiliated with Macquarie University and other places
ML Salby at Scholar
PS Macquarie University blocked access by Murry Salby to his research materials.
See Salby’s rebuttal/history
The EGU abstract is not a peer reviewed publication. But more important, it doesn’t set out any such theory. What you have quoted is the entire publication. What does it mean?
The textbook is also not peer-reviewed. But the section you refer to on p 68 does not expound any theory. It simply points to some past occasions where rise in temperature caused emission of CO2 (nothing new there). On the other hand, on p 21, it says:
“More recent records evidence a human contribution to the budget of CO2. Since
the dawn of the industrial era (late eighteenth-century), the combustion of fossil
fuel has steadily increased the rate at which carbon dioxide is introduced into the
atmosphere. Augmenting that source is biomass destruction, notably, in connection with the clearing of dense tropical rainforest for timber and agriculture. (This process
produces CO2 either directly, through burning of vegetation, or indirectly, through its
subsequent decomposition.) Interactions with the ocean and the biosphere make the
budget of CO2 complex. Nevertheless, the involvement of human activities is strongly
suggested by observed changes.”
Perfectly orthodox.
I do not see anything in your other lists that qualifies.
Salute!
C’mon, Nick!!!
So the holy gospel, true and true, unrefutable crapola by the brother-in-law crowd that depends on the same source of $$$ for their never-ending studies is our measure of merit? “peer review” is gonna be the end of “science” as we know it, and it all comes down to being published and then getting more of our tax $$$ or from a benefactor with an agenda.
How about looking/publishing actual data from anybody willing to go do the dirty work and then let we folks make up our minds?
Gums rants…
” is our measure of merit?”
It was the measure of merit quoted:
“Salby and others in a dozen different peer reviewed papers”
I just point out that it doesn’t meet it. In Salby’s case, he hasn’t even written a blog post.
Thanks David.
Best wishes, William Astley
Macquarie University apparently has still locked ALL 30 years of Salby’s research materials, books, data and computer, including what he brought from the USA. Any further update?
Nice try Nick. It’s not just Salby (whose research was confiscated by his Australian university).
https://mlsxmq.wixsite.com/salby-macquarie/page-1f
https://edberry.com/blog/climate-physics/agw-hypothesis/human-co2-emissions-have-little-effect-on-atmospheric-co2-discussion/
http://www.esjournal.org/article/161/10.11648.j.earth.20190803.13
These analyses are of actual observed changes of atmospheric CO2, not of make-believe data. They show conclusively that CO2 is removed from the atmosphere much too fast for man’s emissions to cause the observed increase of CO2. That explains why changes of man’s emissions have not produced any change in the growth of atmospheric CO2 – not even when man’s emissions have leveled off and remained almost constant.
https://papers.ssrn.com/sol3/papers.cfm?abstract_id=2997420
https://youtu.be/b1cGqL9y548?t=41m52s
Screaming ‘Human Emissions’ has now been exposed for what it has always been: a self indulgent exercise in barking up a wrong tree.
But where are these actual papers. The first is just a whinge about employment contracts; the second is just a blog post by Ed Berry. I don’t know what the third is; my computer blocked it saying that it bore a Trojan. The SSRN article is not a reviewed or published paper, just something placed in SSRN. And the last is a Youtube.
“…I’ve never seen anything in writing from Salby at all, let alone peer-reviewed…”
Keep imploring people from outside of Australia to help. It took a handful of seconds for me to find a list of publications, including some from peer-reviewed journals (e.g., Geophysical Research Letters).
“It took a handful of seconds for me to find a list of publications, including some from peer-reviewed journals (e.g., Geophysical Research Letters).”
Would you please supply that list? You have already accessed it. Not sayin’ it’s not there, just that I did a hard target search and couldn’t find those peer reviewed, non paywalled papers. I’ll work on my search skills…
Unfortunately, nothing about what he was talking about in his different lectures in Europa (followed one of them in the London Parliament). I had a lot of remarks on his points, but he never wrote them down for discussion, not here not elsewhere…
“We have discovered there is another CO2 drain, particulate matter is falling to the bottom of the ocean where it is sequestrated.”
It is not permanently sequestrated at the present time, since the deep ocean is well oxygenated. The organic material is ingested by deep-sea organisms, ultimately metabolized as CO2, and finally returned to the surface by upwelling, but with a 500-1000 year delay.
During hothouse climate intervals the deep ocean was periodically dysoxic or anoxic and huge amounts of organic material were sequestrated as black shales.
Are you really saying that you have spotted a correcting mechanism for keeping CO2 within limits? Or am I over simplifying your findings?
So nature in the form plants, plankton, algae, and bacteria spout-up and start to proliferate just after a little more CO2 gets into atmosphere.
And that is a crisis for some.
Quote: “The IPCC model is based on a dead concept. The recycle theory of water and CO2 which assumes the only new source of water and CO2 that is coming into the biosphere is from volcanic eruptions”. This claim is not true. Both Bern2.5CC and the Joos et al. (2013) apply real CO2 emissions and even the CO2 emissions of land-use.
Another claim. “The Bern model assumes that ocean circulation (with hundreds of years delay) is the only method for deep sequestration of CO2 in the ocean.” I think also that this assumption is not correct. The cold high-latitude seas absorb CO2 about 85-90GtC/yr, the cold ocean’s currents take this amount in the depths of 2-4 km to the tropical ocean and thereafter the warmer ocean water absolves the same amount back into the atmosphere. Humlum et al. have shown that the time delay between the ocean temperature and the atmospheric CO2 concentration is 11 months.
The main incorrect assumption of these two IPCC models is the Revelle factor limited anthropogenic CO2 sequestration rate of 2.2…2.4 GtC/yr. Because of this limitation, the anthropogenic CO2 in the atmosphere is much too great.
Antero,
You do not understand.
The Bern equation has been falsified by the observations. The Bern model is incorrect at the level of assumptions.
The finding that the bomb C14 is being sequestrated in the deepest oceans falsifies the Bern equation as the Bern equations assumes zero falling particulate matter in the oceans. (See my above comment to a link)
There are a dozen peer reviewed papers that disproved the Bern equation which makes sense as it is incorrect at the level of assumptions.
This paper for example looked at how atmospheric CO2 is changing on a yearly basis comparing the Northern Hemisphere to Southern Hemisphere changes and found that atmospheric CO2 changes are tracking planetary temperature changes not anthropogenic CO2 changes.
http://www.tech-know-group.com/papers/Carbon_dioxide_Humlum_et_al.pdf
The phase relation between atmospheric carbon dioxide and global temperature
6. CO2 released from anthropogene sources apparently have little influence on the observed changes in atmospheric CO2, and changes in atmospheric CO2 are not tracking changes in human emissions.
Analyses of a pole-to-pole transect of atmospheric CO2 records suggest that changes in atmospheric CO2 are initiated south of the Equator, but probably not far from the Equator, and from there spreads towards the two poles within a year or so (Fig. 13).
This observation specifically points towards the oceans at or south of the Equator as an important source area for observed changes in atmospheric CO2.
The major release of anthropogene CO2 is taking place at midlatitudes in the Northern Hemisphere (Fig. 12), but the north-south transect investigated show no indication of the main change signal in atmospheric CO2 originating here.
The main signal must therefore be caused by something else.
A similar conclusion, but based on studies of the residence time of anthropogenic CO2 in the atmosphere, was reached by Segalstad (1996) and Essenhigh (2009).
It’s about time. 🙂
My January 2008 paper predates Humlum et al 2013 by five years. The cause of the ~9 month lag of atmospheric CO2 changes after atmospheric temperature changes results from the close relationship of the velocity dCO2/dt vs atm. temperature.
CARBON DIOXIDE IS NOT THE PRIMARY CAUSE OF GLOBAL WARMING, THE FUTURE CAN NOT CAUSE THE PAST
By Allan M.R. MacRae, January 2008
http://icecap.us/images/uploads/CO2vsTMacRae.pdf
My June 2019 paper explains why the lag of atm. CO2 changes after atm. temperature changes is ~9 months.
CO2, GLOBAL WARMING, CLIMATE AND ENERGY
by Allan M.R. MacRae, B.A.Sc., M.Eng., June 15, 2019
https://wattsupwiththat.com/2019/06/15/co2-global-warming-climate-and-energy-2/
Excel: https://wattsupwiththat.com/wp-content/uploads/2019/07/Rev_CO2-Global-Warming-Climate-and-Energy-June2019-FINAL.xlsx
Just goes to show how even something obvious will be virulently resisted if it would require people to rethink conclusions they settled on long ago.
Hi Bart and thank you for your Tolstoy quote – highly appropriate.
Dr Ed Berry has this important paper in preprint, with interesting discussions. I am still digesting it, but some of the smartest people I know think he’s correct.
From the Abstract:
“Human emissions through 2019 have added only 31 ppm to atmospheric CO2 while nature has added 100 ppm.”
PREPRINT: “THE PHYSICS MODEL CARBON CYCLE FOR HUMAN CO2”
by Edwin X Berry, Ph.D., Physics
https://edberry.com/blog/climate/climate-physics/human-co2-has-little-effect-on-the-carbon-cycle/
ABSTRACT
The scientific basis for the effect of human carbon dioxide on atmospheric carbon dioxide rests upon correctly calculating the human carbon cycle. This paper uses the United Nations Intergovernmental Panel on Climate Change (IPCC) carbon-cycle data and allows IPCC’s assumption that the CO2 level in 1750 was 280 ppm. It derives a framework to calculate carbon cycles. It makes minor corrections to IPCC’s time constants for the natural carbon cycle to make IPCC’s flows consistent with its levels. It shows IPCC’s human carbon cycle contains significant, obvious errors. It uses IPCC’s time constants for natural carbon to recalculate the human carbon cycle. The human and natural time constants must be the same because nature must treat human and natural carbon the same. The results show human emissions have added a negligible one percent to the carbon in the carbon cycle while nature has added 3 percent, likely due to natural warming since the Little Ice Age. Human emissions through 2019 have added only 31 ppm to atmospheric CO2 while nature has added 100 ppm. If human emissions were stopped in 2020, then by 2100 only 8 ppm of human CO2 would remain in the atmosphere.
William,
You did not point out, what I do not understand. You write like this: “The recycle theory of water and CO2 which assumes the only new source of water and CO2 that is coming into the biosphere is from volcanic eruptions”. This is a very odd claim.
I know that Bern2.5CC uses fossil emissions and land-use changes as only sources of CO2 emissions using scenarios of AR4 for simulations. The model itself – like any other model – do not depend on the amount and sources of CO2 emissions. The magnitude of emissions depend only on the selected scenario for each simulation.
Mathematical models can never work if they are incorrect at the level of concepts.
It is possible to prove concepts and kill theories using only observations (no math) by looking for paradoxes and then finding a natural explanation for the paradoxes. This is interesting for a general audience because it is non mathematical and because of the number of observations that support the concept.
The physical problem of where does the earth’s water and CO2 come from for all geological time starts with the earth getting struck by a Mars size object when it was roughly 100 million years ago.
That collision formed the moon and heated the surface of the earth to 700C and removed most of the water from the mantel.
The puzzle is where and when does the water come to cover 70% of the earth with water.
This problem is made worst as we have found large amounts of water are being dragged down into the mantel by the ocean plates as they are pushed under the lighter continental sedimentary rock.
The impact also caused the earth’s heavy metals to sink to the core of the planet. Why do we find concentrations of heavy metals that are million times more concentrated than the mantel. Why are there heavy metals in oil and bituminous coal?
The IPCC assumes the only natural ‘new’ source of CO2 and water that is coming into the atmosphere is from volcanic eruptions. That assumption has been proven incorrect based on hundreds of observations.
For example, as noted in my above quote C14 from the bomb test has made it to the deep ocean which disproves the IPCC assumption that there is zero particulate matter that is being sequestrated in the deep ocean
This is another paper that looks at the C12/C13 ratio in the atmosphere and finds that there is a large source of low C12 that is entering the atmosphere at the same time as El Ninos.
The data indicates the same as the phase analysis (see my comment above) that the entire anthropogenic CO2 emissions are absorbed in the same year they are emitted.
http://ruby.fgcu.edu/courses/twimberley/EnviroPhilo/SourcesAndSinks.pdf
SOURCES AND SINKS OF CARBON DIOXIDE by Tom Quirk
ABSTRACT
The conventional representation of the impact on the atmosphere of the use of fossil fuels is to state that the annual increases in concentration of CO2 come from fossil fuels and the balance of some 50% of fossil fuel CO2 is absorbed in the oceans or on land by physical and chemical processes. An examination of the data from:
i) measurements of the fractionation of CO2 by way of Carbon-12 and Carbon-13 isotopes,
ii) the seasonal variations of the concentration of CO2 in the Northern Hemisphere and
iii) the time delay between Northern and Southern Hemisphere variations in CO2, raises questions about the conventional explanation of the source of increased atmospheric CO2.
The results suggest that El Nino and the Southern Oscillation events produce major changes in the carbon isotope ratio in the atmosphere.
This does not favour the continuous increase of CO2 from the use of fossil fuels as the source of isotope ratio changes.
The constancy of seasonal variations in CO2 and the lack of time delays between the hemispheres suggest that fossil fuel derived CO2 is almost totally absorbed locally in the year it is emitted.
This implies that natural variability of the climate is the prime cause of increasing CO2, not the emissions of CO2 from the use of fossil fuels.
Antero Ollila,
The Revelle/buffer factor that is used by the IPCC is right and proven for the ocean surface.
If you look at the growth of DIC (dissolved inorganic carbon) in the ocean surface and compare that to the increase of CO2 in the atmosphere, the increase in the surface is only about 10% of the increase in the atmosphere. See Fig. 3 in Bates e.a.:
https://tos.org/oceanography/assets/docs/27-1_bates.pdf
For the sink places near the poles, the Revelle factor is not important at all, as the pCO2 difference between atmosphere (~410 microatm) and cold waters (~150 microatm) still is enormous and only the slow uptake of CO2 by the sinking waters is the limiting factor…
But I thought positive feedback loops were meant to increase co2 faster due to melting permafrost.
Is Greta wrong? Or is a qualified climate scientist wrong?
Man: Dangerous CO2.
Nature: Free food? Yummm.
Mann: Dangerous CO2