Guest Post by Willis Eschenbach [See update at the end]
I started out as a true believer that sunspots (or something that changes in sync with sunspots, like heliomagnetism, cosmic rays, solar wind, etc.) had a strong effect on the weather. When I was a kid I read that the great British astronomer William Hershel had said that British wheat prices were affected by the sunspot cycle. Made sense to me …
So when I started looking into the question, I figured it would be a piece of cake to find evidence supporting the connection … but nothing in climate science is simple. I started by looking into Hershel’s claim, and I was going to write it up … but then I found a scientific paper entitled “On the insignificance of Herschel’s sunspot correlation“. I hadn’t put much time into my research, and it was much better than my poor attempt. It clearly showed that Herschel was … well … not to put too fine a point on it, completely wrong.
Undaunted, I continued to look for correlations, and I’ve done so from time to time ever since. At this point I’ve looked in more than 20 places, and found no correlation. I append these studies at the end of this post.
Yesterday, a chance comment about sea surface temperature (SST) gave me a new thought about how to look for the signal. In general, I’ve looked at various time-series records of some parameter—river levels, lake levels, cloud amounts, volcanoes, and the like. I’ve analyzed them either with Fourier Analysis or CEEMD analysis.
Anyhow, the idea I had was to divide monthly gridded temperature datasets into months where the sunspots were higher than the median sunspot number for the period, and months where sunspots were lower than that median. Then, I’d subtract the gridcell-by-gridcell average of the low-sunspot months from that of the high-sunspot months. If the theory that low sunspot cycles were associated with low temperatures were true, I’d expect to find a positive difference between the two.
Since the original idea was about sea surface temperature (SST), I thought I’d start with that. The best gridded SST dataset I know of is the Reynolds OI dataset. It starts in 1981, and uses a mixture of satellite and surface data. From the NOAA site:
The NOAA 1/4° daily Optimum Interpolation Sea Surface Temperature (or daily OISST) is an analysis constructed by combining observations from different platforms (satellites, ships, buoys) on a regular global grid. A spatially complete SST map is produced by interpolating to fill in gaps.
It’s available here as a NetCDF document. Figure 1 shows the result of the analysis.

Figure 1. Average of high-sunspot-number months minus the average of low-sunspot-number months, Reynolds Optimally Interpolated Sea Surface Temperature. “High-sunspot” months averaged 135 sunspots; “low-sunspot” months averaged 26 sunspots.
As you can see, not only is the difference very tiny, it has the wrong sign. If low sunspot numbers actually lead to low temperatures, then high minus low should give a positive result. But in this case, it’s a negative result, and it’s only four-hundredths of one degree. In other words … no sign of sunspots affecting the SST.
Next, I thought I’d take a look at a global dataset. I used the Berkeley Earth gridded land and ocean data. I picked an arbitrary cutoff date of 1950, because observations before that start getting sparse. The data is available here as a NetCDF document. I did the same thing, dividing it into high-sunspot and low-sunspot months, and subtracted the low from the high. Figure 2 shows the results.

Figure 2. As in Figure 1, but with the Berkeley Earth global temperature data. Over this period, “High-sunspot” months averaged 155 sunspots; “low-sunspot” months averaged 33 sunspots.
Once again … same result. Wrong sign, tiny difference, no apparent effect of sunspots on the global temperature.
This finding is supported by a CEEMD analysis of the datasets. Here are the results for the Reynolds data:

You can see the sunspot peak (red line, Empirical Mode 6) at about 11.5 years. There’s nothing to match it in the Reynolds OI SST data. And here’s the corresponding chart for the Berkeley Earth data:

In this longer dataset, the sunspot period is 11 years, closer to the long-term average. And as with the Reynolds data, there is no 11-year cycle in the temperature records.
Conclusion? Once again, I’ve looked for a solar signal and found none.
Does this mean that the sunspot cycle doesn’t affect surface weather?
Nope. It just means that I haven’t been able to find one. Might be out there, but I’m up to 25 places or so that I’ve looked without finding it.
[UPDATE] In the comments, someone pointed to a study claiming that the winters in Eurasia are colder when sunspots are low. So I got the Berkeley Earth data and looked at the winter [DJF]. I used data back to 1900, although it’s less accurate, because I needed the longer period to have enough data to study just the wintertime. Once again … no joy.

Figure 3. Winter (DJF) high and low sunspot months. Over this period, “High-sunspot” months averaged 144 sunspots; “low-sunspot” months averaged 28 sunspots.
Update 2. I did the same analysis using the UAH MSU satellite-based lower troposphere temperatures.

Figure 4. As in Figure 1, but with the UAH MSU satellite lower troposphere temperature data.
12:32 AM here, my eyelids are drooping. Hang on, let me go outside … ah, great lungfuls of crisp air on a starry moonless night have me back in shape. Can’t hear the ocean, the wind is wrong. It’s 38°F, or 3°C, the forest is quiet, life is good. I’ll leave this here and come back to trim it up for publication in the morning.
11:30 AM, next morning. Sun is out, the tiny bit of the ocean I can see from our house is shining in the sunshine …

Ah, dear friends, what a world this is!
Best to all,
w.
PS: When you comment please quote the exact words you’re discussing, so we can all understand your subject.
FURTHER READING: Here are my previous posts on the subject.
Congenital Cyclomania Redux 2013-07-23
Well, I wasn’t going to mention this paper, but it seems to be getting some play in the blogosphere. Our friend Nicola Scafetta is back again, this time with a paper called “Solar and planetary oscillation control on climate change: hind-cast, forecast and a comparison with the CMIP5 GCMs”. He’s…
Cycles Without The Mania 2013-07-29
Are there cycles in the sun and its associated electromagnetic phenomena? Assuredly. What are the lengths of the cycles? Well, there’s the question. In the process of writing my recent post about cyclomania, I came across a very interesting paper entitled “Correlation Between the Sunspot Number, the Total Solar Irradiance,…
Sunspots and Sea Level 2014-01-21
I came across a curious graph and claim today in a peer-reviewed scientific paper. Here’s the graph relating sunspots and the change in sea level: And here is the claim about the graph: Sea level change and solar activity A stronger effect related to solar cycles is seen in Fig.…
Riding A Mathemagical Solarcycle 2014-01-22
Among the papers in the Copernicus Special Issue of Pattern Recognition in Physics we find a paper from R. J. Salvador in which he says he has developed A mathematical model of the sunspot cycle for the past 1000 yr. Setting aside the difficulties of verification of sunspot numbers for…
Sunny Spots Along the Parana River 2014-01-25
In a comment on a recent post, I was pointed to a study making the following surprising claim: Here, we analyze the stream flow of one of the largest rivers in the world, the Parana ́ in southeastern South America. For the last century, we find a strong correlation with…
Usoskin Et Al. Discover A New Class of Sunspots 2014-02-22
There’s a new post up by Usoskin et al. entitled “Evidence for distinct modes of solar activity”. To their credit, they’ve archived their data, it’s available here. Figure 1 shows their reconstructed decadal averages of sunspot numbers for the last three thousand years, from their paper: Figure 1. The results…
Solar Periodicity 2014-04-10
I was pointed to a 2010 post by Dr. Roy Spencer over at his always interesting blog. In it, he says that he can show a relationship between total solar irradiance (TSI) and the HadCRUT3 global surface temperature anomalies. TSI is the strength of the sun’s energy at a specified distance…
Cosmic Rays, Sunspots, and Beryllium 2014-04-13
In investigations of the past history of cosmic rays, the deposition rates (flux rates) of the beryllium isotope 10Be are often used as a proxy for the amount of cosmic rays. This is because 10Be is produced, inter alia, by cosmic rays in the atmosphere. Being a congenitally inquisitive type…
The Tip of the Gleissberg 2014-05-17
A look at Gleissberg’s famous solar cycle reveals that it is constructed from some dubious signal analysis methods. This purported 80-year “Gleissberg cycle” in the sunspot numbers has excited much interest since Gleissberg’s original work. However, the claimed length of the cycle has varied widely.
The Effect of Gleissberg’s “Secular Smoothing” 2014-05-19
ABSTRACT: Slow Fourier Transform (SFT) periodograms reveal the strength of the cycles in the full sunspot dataset (n=314), in the sunspot cycle maxima data alone (n=28), and the sunspot cycle maxima after they have been “secularly smoothed” using the method of Gleissberg (n = 24). In all three datasets, there…
It’s The Evidence, Stupid! 2014-05-24
I hear a lot of folks give the following explanation for the vagaries of the climate, viz: It’s the sun, stupid. And in fact, when I first started looking at the climate I thought the very same thing. How could it not be the sun, I reasoned, since obviously that’s…
Sunspots and Sea Surface Temperature 2014-06-06
I thought I was done with sunspots … but as the well-known climate scientist Michael Corleone once remarked, “Just when I thought I was out … they pull me back in”. In this case Marcel Crok, the well-known Dutch climate writer, asked me if I’d seen the paper from Nir…
Maunder and Dalton Sunspot Minima 2014-06-23
In a recent interchange over at Joanne Nova’s always interesting blog, I’d said that the slow changes in the sun have little effect on temperature. Someone asked me, well, what about the cold temperatures during the Maunder and Dalton sunspot minima? And I thought … hey, what about them? I…
Changes in Total Solar Irradiance 2014-10-25
Total solar irradiance, also called “TSI”, is the total amount of energy coming from the sun at all frequencies. It is measured in watts per square metre (W/m2). Lots of folks claim that the small ~ 11-year variations in TSI are amplified by some unspecified mechanism, and thus these small changes in TSI make an…
Splicing Clouds 2014-11-01
So once again, I have donned my Don Quijote armor and continued my quest for a ~11-year sunspot-related solar signal in some surface weather dataset. My plan for the quest has been simple. It is based on the fact that all of the phenomena commonly credited with affecting the temperature,…
Volcanoes and Sunspots 2015-02-09
I keep reading how sunspots are supposed to affect volcanoes. In the comments to my last post, Tides, Earthquakes, and Volcanoes, someone approvingly quoted a volcano researcher who had looked at eleven eruptions of a particular type and stated: …. Nine of the 11 events occurred during the solar inactive phase…
Early Sunspots and Volcanoes 2015-02-10
Well, as often happens I started out in one direction and then I got sidetractored … I wanted to respond to Michele Casati’s claim in the comments of my last post. His claim was that if we include the Maunder Minimum in the 1600’s, it’s clear that volcanoes with a…
Sunspots and Norwegian Child Mortality 2015-03-07
In January there was a study published by The Royal Society entitled “Solar activity at birth predicted infant survival and women’s fertility in historical Norway”, available here. It claimed that in Norway in the 1700s and 1800s the solar activity at birth affected a child’s survival chances. As you might imagine, this…
The New Sunspot Data And Satellite Sea Levels 2015-08-13
[UPDATE:”Upon reading Dr. Shaviv’s reply to this post, I have withdrawn any mention of “deceptive” from this post. This term was over the top, as it ascribed motive to the authors. I have replaced the term with “misleading”. This is more accurate…
My Thanks Apologies And Reply To Dr Nir Shaviv 2015-08-17
Dr. Nir Shaviv has kindly replied in the comments to my previous post. There, he says: Nir Shaviv” August 15, 2015 at 2:51 pm There is very little truth about any of the points raised by Eschenbach in this article. In particular, his analysis excludes the fact that the o…
Is The Signal Detectable 2015-08-19
[UPDATE] In the comments, Nick Stokes pointed out that although I thought that Dr. Shaviv’s harmonic solar component was a 12.6 year sine wave with a standard deviation of 1.7 centimetres, it is actually a 12.6 year sine wave with a standard deviation of 1.7 millime…
The Missing 11 Year Signal 2015-08-19
Dr. Nir Shaviv and others strongly believe that there is an ~ 11-year solar signal visible in the sea level height data. I don’t think such a signal is visible. So I decided to look for it another way, one I’d not seen used before. One of the more sensitive …
23 New Papers 2015-09-22
Over at Pierre Gosselin’s site, NoTricksZone, he’s trumpeting the fact that there are a bunch of new papers showing a solar effect on the climate. The headline is Already 23 Papers Supporting Sun As Major Climate Factor In 2015 “Burgeoning Evidence No Longer Dismissible!…
The Cosmic Problem With Rays 2016-10-17
Normal carbon has six neutrons and six protons, for an atomic weight of twelve. However, there is a slightly different form of carbon which has two extra neutrons. That form of carbon, called carbon-14 or ’14C’, has an atomic weight of fourteen. It is known to be formed by the …
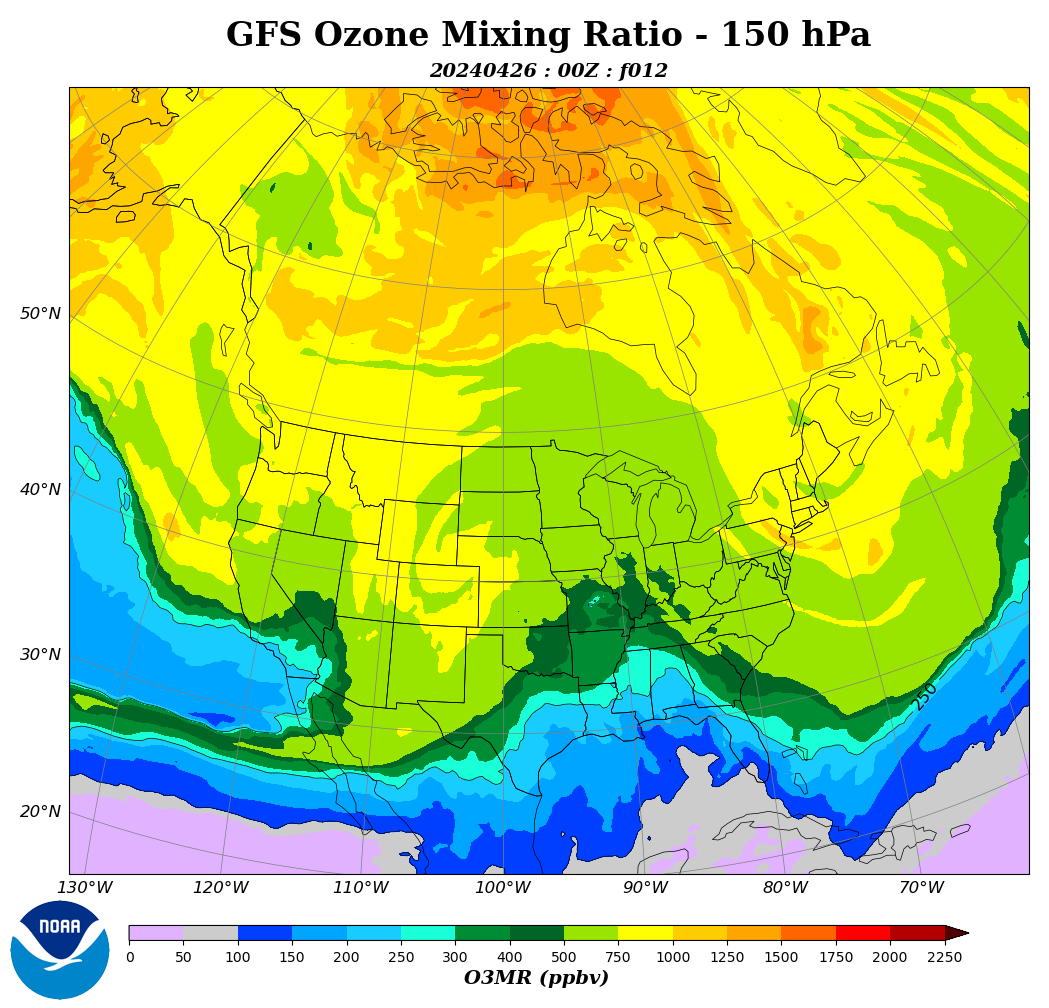
Tomorrow the stratosphere will hit West US at full power.
Hi Willis
I posted a response to your reply to my post.
Conclusion was:
No offense offered nor taken.
B
Bob, many thanks, you are a gentleman indeed.
w.
Willis
While Sun Tsu said “My enemy’s enemy is my friend,” it doesn’t always work out that way. I wish all here could be a little more congenial and diplomatic. But, I can appreciate that you get tired of being attacked for presenting evidence. You don’t deserve it.
I appreciate your creativity and hard work. Please keep it up and don’t let the petty sniping wear you down.
During the solar minimum , the rate of mixing layers in the equatorial Pacific is low.

 ?time=1578334801000

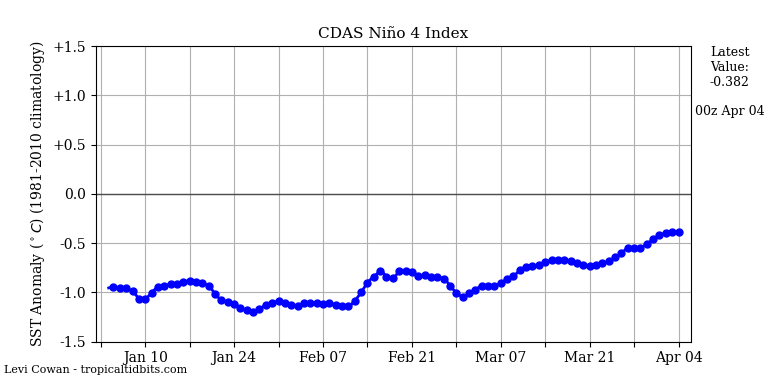
Niño 4 varies in a small range from July 2018.
Very weak solar wind. Niño 4 index remains high.
A Dr. Rob Baker of The University of New England insists that the Indian Ocean Dipole is correlated with sunspots.
I download a 2009 paper that characterises IOD behaviour since 1846 using a proxy. https://www.ncdc.noaa.gov/paleo-search/study/8607
But still haven’t got around to looking for a correlation.
Willis,
Great post!
I’m not ready to give up the ghost just yet that the ball of blazing fire is still hiding some secrets from us… 😉
We may yet discover a correlation between temperature changes and changes in the magnetic fields of the Earth, the Sun, and/or the Milky Way (per your “heliomagentism” above). It would not be all that surprising to discover, for example, that cycles of those electromagnetic fields periodically combine and amplify (or diminish) cosmic/solar radiation over the course of the galactic year (or during one or more periods of the sun’s oscillation across the galactic plane). Those amplified forces may alter our atmosphere or SST more significantly than our limited observations currently imply. No?
“…may alter our atmosphere or SST more significantly than our limited observations currently imply. No?”
Willis: “Does this mean that the sunspot cycle doesn’t affect surface weather?
Nope. It just means that I haven’t been able to find one. Might be out there, but I’m up to 25 places or so that I’ve looked without finding it.”
He could check another 25 but it seems even that would not disolve the calcified opinion of some people. One thing is pretty clear: the affect of solar variation on modern warming is highly likely to be negligble and those who persists in blaming it for causing modern warming are clutching at straws.
“Charged particles and magnetic fields influence each other. So when the solar wind, which is made up of charged particles, blows past Earth’s magnetosphere, the shape of the magnetic field changes from the dipole magnetic field – shown on Earth’s Magnetosphere page – to a plasma-swept magnetosphere that looks more like someone’s hair got blown in the wind. This interaction between the Sun’s plasma wind and Earth’s magnetosphere is known as the Sun-Earth Connection”
https://www.nasa.gov/mission_pages/themis/auroras/sun_earth_connect.html
@John Finn
‘SSN Climate connection is a very well-established branch in climate science.’
Evidence for a connection is stronger – and getting steadily stronger day by day.
But it does not want to be quoted.
Mark February 4, 2020 at 3:47 pm
ENOUGH WITH THE HANDWAVING AND UNSUPPORTED CLAIMS!!!
Figure out which of those papers you think demonstrates the sunspot-related connection most strongly, clearly, and irrefutably. Then post up TWO links here, one to that study and the other to the data as used in the study, and I’m happy to take a look at it.
Caveats:
• No reanalysis “data”. It’s not data as we commonly understand the term, it is the output of a climate model.
• Surface datasets only. The effects of the sun on the ionosphere are well known … however, they don’t seem to translate to the surface.
I await your TWO links.
w.
On a lighter note, some may enjoy reading the story “Solar Constant” by Murray Leinster about sunspots, climate change, and climate engineering: http://baencd.freedoors.org/Books/Planets%20of%20Adventure/0743471628__13.htm.
Oh, yes, in case you didn’t recognize the author…it doesn’t take place on Earth.
Willis, Another very un-Mannly effort.
How Dare You?
Willis, a thought-provoking article. Thanks!
Since you mention your (un)affection for typos, perhaps you might fix the one in the middle of your fifth paragraph: ‘where sunspots were lower than that media. ‘ … should have been ‘where sunspots were lower than that median.’
Regards
Thanks, Steven, fixed. We know that it’s a typo because in 2020, there’s nothing lower than the media …
w.
Who should I believe? Willis or this story from the UK Express?
“ warning: Earth could be hit by MINI ICE-AGE as Sun ‘hibernates’“
Willis, sorry you didn’t find a correlation. Perhaps you need to torture the data like AGW people. You can’t believe the results they get. What you can’t get by persuasion might be got with brute force. Just trying to be helpful 🙂
@Willis
There are numerous papers showing the solar influence on surface data!!
This is a very well-written review and heavily cited.
Gray, L.J., J. Beer and M. Geller, et al. (2010), Solar influences on climate. Rev. Geophys., 48, RG4001, doi: 10.1029/2009RG000282.
Mark February 4, 2020 at 7:38 pm
I love folks saying this as if I didn’t know it. I just haven’t found one that stands up to close examination.
The bizarre part is that folks like you are well aware that there are even more numerous papers claiming that CO2 is the secret control knob that rules the temperature … and you don’t believe them.
But bring out any solar paper, and you fall over in adoration. Look, if most of the CO2 papers are nonsense, and they are, then why is it so hard for y’all to believe that most of the solar papers are the same?
So let me make you the offer I’ve made many times. Figure out which one of the papers in that “well-written review” you think demonstrates the sunspot-related effect most strongly, clearly, and irrefutably. Then post up TWO links here, one to that study and the other to the data as used in the study, and I’m happy to take a look at it.
Caveats:
• No reanalysis “data”. It’s not data as we commonly understand the term, it is the output of a climate model.
• Surface datasets only. The effects of the sun on the ionosphere are well known … however, they don’t seem to translate to the surface.
I await your TWO links.
w.
Willis
It is interesting that no one has taken you up on your challenge! Perhaps because they can’t?
Thanks, Clyde. You say:
Nope, no way. It’s because of [insert your favorite excuse here, today’s favorite seem to be “Because Willis is a bad man”]
w.
Wow… and you’re not even orange. 😉
This is a very well-written review and heavily cited. ….
… but provides very little support for a significant global effect on surface temperatures. You should, perhaps, read it yourself.
@Willis
There are so many papers about the solar influence on surface climate. It is a surprise that you have not gone through any of those. To name a few: Dr Harry van Loon published many papers on Sea Level Pressure and Sea Surface temperature observation data. Dr White (1997) published one of the great paper on Sea Surface Temperature. Most of the solar climate scientists are aware of their pioneering work those used surface data.
Mark, is there something about providing two links to the paper you think is the best that is mystifying to you?
w.
Willis, I must admit I find your faith in the Berkeley dataset very naive. In Australia, it is well known the BOM have cooled the past and ‘disappeared’ almost all previous high temperatures through each iteration of their so-called high-quality data. Jo Nova has published many articles about this on her website.
I doubt we are the only country to make data agree with ideology. As such, I suspect that you could not prove anything from all your effort.
Ann February 4, 2020 at 9:42 pm
Ann, I must admit that I’m tired of people ignoring my clear request to QUOTE THE EXACT WORDS YOU ARE REFERRING TO!!!
Come back when you find a quote where I said that I have “faith in the Berkeley dataset”.
I’ll wait, but since to my knowledge I’ve never said anything even remotely resembling that, it’s likely going to be a long wait … meanwhile, can I tell you how tired I am of people accusing me of saying things I never said?
w.
Willis , I know videos move a little slow for you ,but others may get a clearer picture on solar wind and Earths electromagnetic defences.
And what is your conclusion from this?
Solar forcing might explain some weather events on earth.
Does it explain the positive century- long trend in surface temperatures? – NO.
Willis,
I’d like to make you aware of something that’s been occurring to the Jetstream since late November, 2019. I’ve no sure idea if this is related to a solar influence but it may be. I’ve commented a few dozen times on this since late November. Here are some links to my earliest comments soon after I first noticed it, then a couple more recent ones.
November 28, 2019 at 3:55 pm
http://joannenova.com.au/2019/11/midweek-unthreaded-105/#comment-2230752
December 2, 2019 at 9:13 pm
http://joannenova.com.au/2019/12/abc-discovers-data-on-facebook-showing-wet-rainforest-has-not-burned-once-ever-or-at-all-in-tens-of-millions-of-years/#comment-2234995
Here’s a comment I made when I found this same effect was developed within the southern-hemisphere’s Summer Jetstream flow – only much more so:
December 4, 2019 at 3:33 pm
http://joannenova.com.au/2019/12/midweek-unthreaded-106/#comment-2235743
December 12, 2019 at 10:00 pm
http://joannenova.com.au/2019/12/midweek-unthreaded-107/#comment-2239504
Then two more recent remarks where the suspected cause becomes more tangible:
http://joannenova.com.au/2020/01/weekend-unthreaded-292/#comment-2250447
http://joannenova.com.au/2020/01/weekend-unthreaded-295/#comment-2263009
As a result I’m considering what initiating mechanism could lead to sinking stratospheric air detectably doing this within the past 3 months? I’m entertaining the view that an external influence operating over several decades may be implied. I can’t see what else could have produced it.
I’m not expecting you to buy into it – of course – this is just to show you what’s been occurring (still is, not fading in the least) and that the development is without clear mechanism to trigger sinking of such stratospheric air into the lower-troposphere. If your interested enough feel free to question, debunk, contribute, make counterfactuals, point-out other possibilities. I’d appreciate that (or anyone else).
Personally, I’ve found this recent jetstream behavior to be the most stunning emergence I’ve ever noticed, it’s begging for a mechanism which explains ultimately how this is happening, as it looks like an external process may be necessary here.
WXcycles
“Personally, I’ve found this recent jetstream behavior to be the most stunning emergence I’ve ever noticed, it’s begging for a mechanism which explains ultimately how this is happening, as it looks like an external process may be necessary here.”
“Moscow and Beijing have reportedly joined forces to carry out heating experiments above Europe and modify an important layer of the atmosphere for a possible military application, according to Chinese scientists.”
https://www.newsweek.com/china-russia-modified-atmosphere-europe-military-application-1262349
https://www.globalresearch.ca/does-the-us-military-own-the-weather-weaponizing-the-weather-as-an-instrument-of-modern-warfare/5608728
gimme a break
Did you know that in the Southern Hemisphere we are 3% closer to the sun in our summer than the Northern Hemisphere summer. Of course that makes us 3% further away from the sun in our winter than the Northern Hemisphere winter. There is a climate story in there somewhere.
The southern hemisphere (SH) perihelion – along with maximum obliquity and the large expanse of SH ocean area – explain the interglacial periods (Holocene, Eemian, etc) but does not explain the global temperature variations during the interglacial. Global temperature long term trend is downwards – as is the obliquity angle.
refer
https://wattsupwiththat.com/2017/08/04/paleoclimate-cycles-are-key-analogs-for-present-day-h………… 2019/04/26
Willis, or you not noticed that during the solar minimum, circulation of the Eastern Pacific is like during La Niña, and on the West Pacific as during the El Niño?


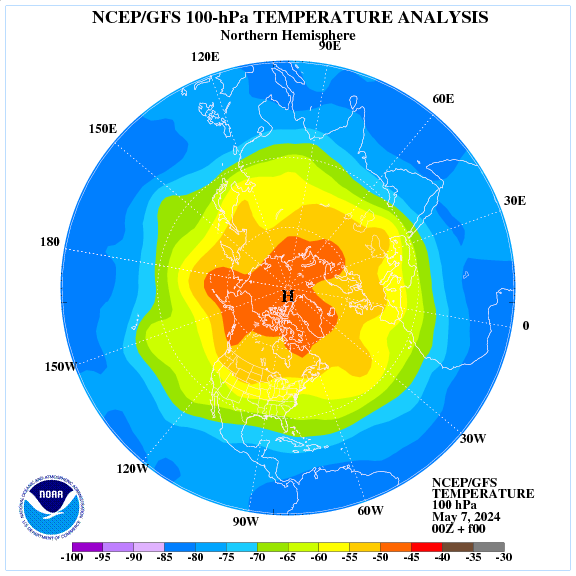
Waves in the stratosphere play a major role in winter weather, and the temperature in the stratosphere depends only on high-energy radiation.

A massive stratospheric hit in the west of the US.
http://tropic.ssec.wisc.edu/real-time/mtpw2/webAnims/tpw_nrl_colors/namer/mimictpw_namer_latest.gif
@Willis
Further to your comments relating to solar influence on climate using observational data:
1. Gray et al (2010) mentioned many papers that used observational data. Anyone can figure it out. All those papers are published in peer-reviewed top international journals. Hope you would have been one of those peer-reviewers. Gray et al is cited 921 times and I believe you are not in that list. There are many (repeat many) papers that used observational data. Even recent time, I saw many solar related papers those used HadSLP data and HadSST data, NOAA SST data etc. Anyone can publish papers refuting those work and you are very welcome! We are eagerly waiting for that. Commenting is easy but to publish you need to convince referees. Here is the full reference to those two papers I mentioned earlier.
1. van Loon, H., G.A. Meehl, and D.J. Shea, (2007), Coupled air-sea response to solar forcing in the Pacific region during northern winter, J Geophys. Res.-Atmos., 112, D02108, doi: 10.1029/2006JD007378.
2. White, W. B., J. Lean, D. R. Cayan, et al. (1997), Response of global upper ocean temperature to changing solar irradiance, J. Geophys. Res.-Oceans, 102(C2), 3255-3266.
Anyone can question anything but for questioning a well-establish branch of science you need to have a certain basis. There should be one specific chapter in IPCC report about all solar direct and indirect influence.
The Gray paper does not support a significant relationship between solar activity and recent climate change.
For example, this from Section 6.3
[160] The most obvious mechanism for solar variations affecting the Earth’s climate is due to the change in heating of the Earth system associated with varying TSI.
and this from Section 6.3
A value of 0.24 W m−2 solar radiative forcing difference from Maunder Minimum to the present is currently considered to be more appropriate. Despite these uncertainties in solar radiative forcing, they are nevertheless much smaller than the estimated radiative forcing due to anthropogenic changes, and the predicted SC‐related surface temperature change is small relative to anthropogenic changes.
There is absolutely nothing in the paper, or presumably any of the references cited in the paper, which can explain 20th century climate change.
This article and the subsequent string of comments sent me back to look at Herschel’s original paper, which deserves a second look.
My trigger was the comment above that his data was pre-1701, a century before the paper was published. In the relevant part of the paper he draws on observation across five periods during 1650-1713 when contemporary observers recorded low numbers of sun spots. Hershel recognises the limitations of their observations, both with regard to the equipment available to them and the regularity with which they made observations. Regarding wheat prices, he is clear that these can be influenced by more factors than the size of the year’s harvest, and also that more weather factors (e.g. winds and rain) influence the harvest than the strength of the sun alone. The prices he noted during these low sunspot periods ranged from 37s 1d to 63s 3d the bushel (for simplicity I give the prices in shillings and pence only, rather than in £sd).
I could not see where he concluded from this analysis that he had found any evidence of a correlation between solar activity and grain prices.
It is only at the end of the paper that he notes that, having recorded (by regular observations using his own, state-of-the-art equipment) very little sunspot activity during 1795-1800, there had been a marked increase in numbers between then and his writing this paper of 1801, and that he hoped that this would be lasting and would lead to greater warmth and better crop yields.
So, where was he wrong?
Thanks Willis — your usual good work. Agree w/your inclinations on the subject.
@John
As you mentioned the most obvious mechanism of solar influence as TSI is mentioned in Gray et al. That contribution is nominal and surprisingly only that nominal contribution of the sun is included in the IPCC document!
Gray et al. discussed a lot about mechanism involving UV variability. It changes 6-8% in solar min to max years. It is one of the main mechanism through which the sun influences the earth. There are large dynamical variability, circulation change, jet movement, the strength of polar vortex, all are shown to be linked with UV variability in the upper stratosphere. All those papers are referred/discussed in Gray et al.
Other indirect influences of the sun also come via modulating AMO, PDO, ENSO, NAO etc.. Many papers discovered and analysed those links. As expected it would not be very simple and linear. How that solar climate link was modified in the recent period is also attended in many recent papers. Those indirect influence of the sun gave additional global warming in recent periods. e.g. Sun NAO has a very strong positive connection in recent periods in all observational data. It was not present in the earlier period. All those indirect influences of the sun and the impact on recent temperature rise should be considered in detail.
Also, the sun via modulating Galactic Cosmic Ray influences cloud formation. It has a huge impact on global temperature.
Now you see, the sun is not only causing day and night, seasons, Indian Summer Monsoon, etc. but it is the main controller of our climate. How little we know about it!
That is the reason I mentioned including a new chapter in IPCC report on solar direct/ indirect influence on climate. Its indirect contribution to recent global temperature rise is much much higher than mentioned in that report. More and more study is required to address that important area of climate science.
Gray et al. discussed a lot about mechanism involving UV variability. It changes 6-8% in solar min to max years. It is one of the main mechanism through which the sun influences the earth.
Right – and the temperature change between solar min and solar max is ~0.07 deg C.
Willis has used sunspots as a proxy which encompasses all solar parameters – TSI, UV, etc. It really doesn’t matter what the mechanism is – the TOTAL effect is clearly small. Solar variability may be responsible for some regional weather events but there is nothing which indicates that it has anything to do with 20th century warming.
We went through all this in 2008 when it became clear that SC24 was going to be a weak cycle. Numerous posts and comments on this blog included predictions of imminent cooling which never materialised.
Forget solar variability . The only issue up for debate now is Climate Sensitivity to 2xCO2. It’s quite probable that climate scientists have over-estimated future warming.