Guest Post By Renee Hannon
Abstract
Detailed pattern correlation of Earth’s temperature changes during the past 450 kyrs reveals observations about several cyclic climate patterns. The past four glacial cycles are increasing in duration from 89 kyrs to 119 kyrs. Within these glacial cycles, two warm periods occur about 200 kyrs apart and have strikingly similar temperature characteristics. These two warm patterns suggest processes modifying Earth’s temperature could be repeatable and predictable. In contrast, two other warm periods have different and distinct characteristics. These two warm periods occur during a predominantly elliptical orbit and a predominantly circular orbit, respectively, and on approximately 400 kyr cycles.
Preliminary simplified models of astronomical and oceanic controls on temperature variations for the past four warm periods have been developed. Although process interactions are very complex, separating out predominate causes and effects on global temperature should help improve future climate mathematical simulation models. Climate models need to include astronomical as well as oceanic and atmospheric forcing to reliably predict the duration and temperature changes of the future Holocene interglacial Warm period.
Introduction
The Holocene Warm Period was compared to four interglacial warm periods and their glacial cycles during the past 450,000 years using EPICA Dome C isotope ratios and temperature estimates to identify pattern similarities and trends. Interestingly, a hierarchy of correlative events and common patterns occur amongst the glacial cycles and warm periods.
Warm periods are anomalous events referred to as interglacial periods within a glacial cycle. Glacial cycles last for approximately 100 kyrs and warm periods range from 10 to 30 kyrs. For simplicity, these glacial cycles and warm periods are referred to as I through V, with I being present day and V being the oldest as defined in Figure 1. Glacial/interglacial transitions known as Terminations (I-V) and common usage names from literature, marine isotope stages(“MIS”), and approximate age are also noted in Figure 1.

Figure 1: EPICA Dome C isotope temperature estimates over the past 450 kyrs show four warm periods prior to the present-day Holocene warm. Warm periods last approximately 10-30 kyrs.
Calculated temperatures from the Antarctica Dome C data are multiplied by 0.5 to correct to approximate global temperatures rather than polar temperatures. Uncorrected, the magnitude of the delta degree C would be double than what is shown in the figure.
Correlation of Glacial Cycles
Figure 2 is a traverse which displays the four past glacial cycles. The temperature curves for each cycle are turned sideways with time plotted on the vertical axis. This technique is similar to creating a geologic cross section and enables correlation of events between the past glacial cycles. The key repeating event for each cycle is the rapid onset of warming following abrupt terminations of glacial periods. This significant event was used as a datum for each glacial cycle. Datuming is a useful tool that allows recognition of relative changes between cycles. Very cold is highlighted in blue and warm periods in red. The blue, yellow and green lines are an interpretation of internal correlations within each cycle bounded by bold red lines.

Figure 2: A traverse of the past five interglacial-glacial cycles. Cycles are datumed on the Terminations/Onsets. EPICA Dome C isotope temperature estimates are plotted as curves in 1 degree C increments on the horizontal scale (cold to left and warm to right). The vertical scale is time in 20 ka increments. Actual age is plotted on each cycle. Interglacial warm periods are highlighted in red and the coldest portion of the glacial period in blue. Dark red is calculated ratios of warm:cycle.
These glacial cycle patterns are what geologists call bottom-loaded sequences. They are well-behaved cycles with the warmest interglacial period, shaded in red, always following the termination of the previous glacial period. The green line within the warm period highlights a brief cooling event that approximately correlates to the 8.2 kyr event in the present-day Holocene. The blue correlation line is the base of the coldest full glacial period shaded in blue which occurs at the end of each cycle. The full glacial period ranges in duration from 35 to 60 kyrs in Cycle V to Cycle II, respectively. In the middle of each cycle there is a mild glacial period consisting of smaller cold stadials and warm interstadials (Dansgaard-Oeschger cycles). The yellow lines attempt to correlate these minor stadial events.
While there is uncertainty of +/- 3 kyrs in picking the exact timing of events this is not enough to change the main trends and observations. Although these curves are not stretched, stretching would likely improve correlation of the higher frequency events such as the stadials and interstadials. Several observations are evident from the glacial cycle traverse:
- Duration of glacial cycles are progressively increasing from 89 kyrs in Cycle V to 119 kyrs in Cycle II. Cycle II is 34% longer in duration than Cycle V. The cycles are not spaced equally at 100 kyrs apart. Javier previously challenged the 100 ky cycle (see his Table 1 and Figure 5) over the past 800 kyrs using interglacial peak to peak duration.
- The full glacial period at the top of each cycle is also increasing in duration from past to present but not necessarily getting much colder between cycles (+/- 1 degree C).
- Cycle V has the longest warm period and Cycle III the shortest initial warm period. Maximum average warm temperatures are not that different (+/- 1 degree C).
- Cycle III stands out as having an abbreviated initial interglacial warm followed by a second warm period (MIS 7c). This has been recognized in the literature and is frequently debated as to whether the second warm period is a true interglacial or an interstadial. A similar suppressed interstadial can be correlated to Cycle II (yellow lines). Regardless, MIS 7c is considered to be part of the larger Cycle II and its onset is not as significant as the Termination event.
- There appears to be an internal event within the interglacial warm periods that correlates to the 8.2 kyr Holocene event. Stadials, or cooling events, also appear correlative within the glacial periods (yellow lines) that have similar patterns suggesting a similar natural process was repeated.
Interglacial Warm Periods Comparison
Patterns in historical temperature changes were also evaluated for the past four interglacial periods and compared to the present-day Holocene. On the largest scale as seen in Figures 1 and 2; Warm II, III, and IV have asymmetric patterns with rapid initial warming and slower cooling. Warm V has more of a symmetrical pattern, with the climate optimum occurring towards the end of its warm period. Onset of present day warm appears similar to the beginning of a symmetrical pattern and perhaps analogous to Warm V.
In the following sections, warm patterns are compared in more detail for the duration of the warm interglacial period, the warming onset and cooling period.
Warm Period Duration Patterns
The warm interglacial periods over the past 450 kyrs range from 9 kyrs to 32 kyrs in duration using a delta oC temperature cut-off of minus 1 (Figure 2, Table 1). All past warm periods have been approximately 2 degrees C warmer than the Holocene. Most interglacial durations have bimodal patterns and tend to be asymmetrical. Warm V is an exception with a more symmetrical pattern (Figure 2).
Table 1: Warm Period Durations over the past 450 kyrs (dark red on Figure 2 which corresponds to a minus 1oC delta cut-off).
| Interglacial Period | Duration (kyr) |
| Warm I | 12+ |
| Warm II (MIS 5) | 17 |
| Warm III (MIS 7e) | 9 |
| Warm IV (MIS 9) | 14 |
| Warm V (MIS 11) | 32 |
Warm periods II and IV are discussed together due to their similar patterns and Warm periods III and V are discussed separately due to their different patterns. Javier (his Figures 13 and 14) and others have also recognized that Warm periods III (MIS 7E) and V (MIS 11) have different interglacial characteristics.
Warm Periods II and IV: The Holocene warm pattern is generally bimodal and similar to Warm II (MIS 5) and IV (MIS 9) with the exception of the onset warming and a lower initial climate optimum (Figure 3). These three warm periods have an initial brief climate optimum of 2 to 3 kyrs like the early Holocene. This is followed by a brief cooling with a V-shape pattern like the Holocene 8.2 kyr event and then a longer more stable warm period lasting about 7 to 8 kyrs like the Middle Holocene warming.

Figure 3: Holocene temperatures in red overlain on Warm II and IV periods. Bottom horizontal axis corresponds to the Holocene time and top horizontal axis is the past warm time in thousands of years. Colored bar at top refers to the older warm phases. The red text corresponds to the Holocene events.
There is only one key stadial cooling event during Warm II and IV periods. This key stadial event drops temperatures by about 2 degrees C and lasts for a couple thousand years. It also appears similar in timing to the Holocene 8.2 kyr stadial (Figure 3). This intervening stadial may represent a recurring event that happens after the initial climate optimum and will be discussed later.
There are numerous oscillating events during the warm periods with minor temperature variations (<1.5 deg C) that are short duration (tens to hundreds of years). These events would be like the Holocene events that include the Roman Climate, and the Medieval warm followed by the Little Ice Age which are discussed extensively in the literature. They are difficult to see on the graphs in Figure 3 and appear more as background noise during the Holocene warm period due to the compressed scales used here.
These minor events are probably unique to each warm period and have been attributed to long term ocean cycles, Pacific and N. Atlantic multi-decadal and decadal climate cycles, orbital obliquity, solar variability, and greenhouse effects.
Additionally, the bimodal patterns for Warm Periods II and IV are strikingly similar as previously discussed by Hannon. The main difference is Warm IV is compressed by about 6 kyrs. This is demonstrated by stretching the Warm IV curve to match Warm II as shown in Figure 4. These warm periods are approximately 200 kyrs apart. The striking similarity of these two warm periods suggests that the sequence and interaction of natural causes (solar and oceanic) are comparable and repeatable.

Figure 4: Graphs with Warm II (blue) and IV (green) overlain. Horizontal axis for Warm II is in kyr and plotted at top of each graph. Warm IV horizontal axis is plotted on bottom of each graph. Vertical axis is in 1 deg C units and same for all datasets. In the second graph, Warm IV was stretched by ~6 ka.
Warm III and V Anomalous Periods:
Warm III (MIS 7e) and V (MIS 11) exhibit less well-behaved patterns during their warm period (Figure 5). Warm III has a very brief initial climate optimum lasting 2 kyrs and then begins to enter a significant cooling period with nearly coincidental timing as seen in the Holocene 8.2 kyr event (Figures 2 and 5). Then temperatures stabilize for about 4 kyrs before resuming a rapid cooling descent.
Warm V has a similar initial temperature as the Holocene. However, it quickly enters a brief cooling (Figure 5). It is not certain whether this brief stadial at 423 kyrs is equivalent to the Holocene Younger Dryas stadial or the 8.2 kyr cooling (Figure 2). Warm V is unique because it has an extended warming period that is even warmer than the initial climate optimum. Warm V’s second extended warm is almost 2 degrees C warmer than present-day (Figure 5). EPICA discusses Warm V compared to the present-day in more detail here.

Figure 5: Holocene temperatures in red overlain on Warm III and V periods. Bottom horizontal axis corresponds to the Holocene time and top horizontal axis is the past warm time in thousands of years. Colored bar at top refers to the past warm phases. The red text corresponds to the Holocene events.
Warming Onset Patterns
Warm II, IV, and V warm periods display a rapid linear warming to their climate optimum (Figure 6). Warm II and IV have a similar steep slope of m=0.89 and 0.85 respectively. Whereas Warm V has a flatter slope of m=0.67, giving it more of a symmetrical pattern (Figures 1 and 2).
The initial Holocene warming is characterized by two events; the Boiling/Alleröd (B/A) interstadial and the Younger Dryas stadial, referred to as a stair-step pattern (Figures 3 and 5). The only interglacial warm period during the past 450 kyrs that exhibits a similar behavior is Warm III. Warm III has a B/A interstadial equivalent at 248 kyr, but it is not as warm as the B/A. An onset slope calculated for Warm III immediately following this interstadial is quite steep (m=1.1). A slope was not calculated for the Holocene due to the stair-step pattern.
As previously mentioned, the climate optimums of both Warm II and IV are approximately 2 degrees C higher than the Holocene present-day. Perhaps the Younger Dryas cooling during the Holocene warming onset intervened and prevented the Holocene from reaching the initial climate optimums seen in Warm II and IV. This was also observed by Javier, his Figure 14.

Figure 6: Comparison of the onset patterns and slopes. Past warm periods have a linear increase with an excellent regression. The linear equation and R2 are presented on each chart.
Cooling Patterns
Final cooling slopes for the warm periods are more gradational than the onset warming and are similar with slopes ranging from 0.38 to 0.31 (Figure 7; Table 2). Warm II, IV, and V have a gradual cooling over 5 -10 kyr and then continue into a series of stadial and interstadial periods during the next mild glacial phase. Warm III has an initial rapid cooling, stabilizes and then a final cooling (Figure 5). Different slopes were calculated for Warm III (Figure 7). The initial rapid cooling slope is very steep (m=0.8), however the overall cooling is like the other warm periods.
If the Holocene Warm I behaves similarly to Warm IV, the cooling onset should begin very soon and within hundreds of years (Figure 3). If the Holocene Warm I behaves like Warm II, the cooling onset should begin within a few thousand years (Figure 3). If the Holocene Warm behaves more like Warm V, cooling onset is probably 10 thousand years away (Figure 5).

Figure 7: Comparison of cooling patterns and slopes. Cooling of past interglacial periods have a linear decrease with an excellent regression. The linear equation and R2 are presented on each chart and slopes range from 0.40 to 0.31.
Table 2: Comparison of Onset and Cooling slopes for Warm Periods
| Warm Period | Onset Slope | Cooling Slope |
| Warm II (MIS 5) | 0.89 | 0.36 |
| Warm III (MIS 7e) | 1.10 | 0.80/0.34 |
| Warm IV (MIS 9) | 0.86 | 0.38 |
| Warm V (MIS 11) | 0.68 | 0.31 |
Hierarchy of Events and Accuracy Observations
Scientists have attributed interglacial warming and pacing to the Milankovitch cycles. The Milankovitch cycles consist of eccentricity (elliptical orbit), obliquity (axial tilt), and precession (wobble) of Earth’s orbit resulting in cyclical variation in summer insolation in the northern hemisphere. A strong case for obliquity dominance has been made by Javier and Tzedakis, and precession is favored by Ellis and Palmer. These papers provide excellent overviews of the Milankovitch processes.
It is interesting to note that scientists compare astronomical data with precise accuracy to geologic timescales with uncertainties on the order of +/- 5 kyr. Picking the exact onset age of an interglacial period, the precise peak of a climate optimum, and their durations can vary +/- 3 kyr depending on the criteria used. Precession cycles occur on an approximately a 20 kyr scale and obliquity on a 41 kyr scale. The geologic timescale and interpretation error is approximately 25% of a precession cycle and 12.5% of an obliquity cycle.
In the following analyses, Milankovitch processes (eccentricity, obliquity, and summer insolation) are correlated to different events based on degree of temperature variation and duration. These events are the longer term glacial cycle, rapid onset of interglacial warm periods, and interglacial warm duration and cooling. All references to insolation/summer insolation in this post are “Northern Hemisphere Summer Insolation at 60 degrees North” (Berger, 1992).
Glacial Cycle Control Observations
In general, the cycle of eccentricity from circular to more elliptical and back to circular takes approximately 100 kyrs. Additionally, each 100 kyr cycle can be predominately more circular or predominantly more elliptical (Figure 8).
There are five intervals of Glacial Cycles I-V over the past 450 kyrs that increased in duration from past to present (89 kyr long to 119 kyr long). They are not precisely 100 kyr events. Closer evaluation of the eccentricity cycles demonstrates that each cycle also varies in duration and are not precisely 100 kyr events.

Figure 8: Glacial cycles I – V plotted with Eccentricity (orange) and summer insolation (blue). Duration (kyr) between eccentricity cycles in orange, between summer insolation in blue, and between termination/onset cycles in gray. See Figure 2 for detailed glacial cycle correlations.
Eccentricity and precession/summer insolation appear to correlate with the duration of the glacial cycles (Figure 8). Each eccentricity cycle has become increasingly longer in duration over the past 450 kyrs. The eccentricity cycles generally correlate with the progressively longer glacial cycles. However, the duration of summer insolation cycles, which are strongly influenced by eccentricity, coincides nicely with the glacial cycle duration (Figure 8).
An interesting observation is Glacial Cycle V occurs when eccentricity cycles are predominately circular (Ecc 5). Glacial Cycle V is the shortest glacial cycle over the past 450 kyrs and lasted only 89 kyrs. Because Earth is currently in a circular orbit, the Holocene Glacial Cycle appears more likely to be analogous to Glacial Cycle V with a shorter glacial cycle.
Glacial Cycles II and IV occur when the eccentricity cycles are between circular and elliptical (Ecc 2 and Ecc 4). These cycles are 200 kyrs apart. Ecc 2 has an asymmetrical pattern because it is more elliptical initially and then continues to decrease to an almost circular orbit. Glacial Cycle II occurs during Ecc 2 and has the longest mild and full glacial period.
Glacial Cycle III occurs when the eccentricity cycle is the most elliptical (Ecc 3). Glacial Cycle III also is an exceptional cycle which has two warm periods; Warm period III (MIS 7e) and a second warm period (MIS 7c). During elliptical cycles, both obliquity and summer insolation are amplified.
Warm periods occur at the beginning of each eccentricity cycle as Earth is going from a circular orbit to elliptical. In the middle of each eccentricity cycle, as Earth’s orbit is going from elliptical back to circular, mild glacial to full glacial periods exist, except for Glacial Cycle III which has a second stunted warm period.
Warm Onset Controls
The most significant event of the interglacial/glacial cycle is the termination of the glacial period and rapid onset of the interglacial period. This has happened five times over the past 450 kyrs.
In geologic terms, the warm onset event would be described as an unconformity representing a significant geologic episode such as continental uplift or massive erosional periods. Therefore, the observed rapid onset of warm interglacial periods should be caused by powerful events such as an alignment of external astronomical forces (eccentricity, obliquity, and precession/insolation). Warm onsets only occur when three external forces are increasing: 1) eccentricity, 2) obliquity, and 3) summer insolation as shown in Figures 8 and 9. All major warm onsets have commonality of these three increasing astronomical forces escalating in combination. All three play a role although not always equally.

Figure 9: Obliquity (red) plotted with Dome C isotope/temperature data (gray). Each obliquity cycle is 41 kyrs apart. As discovered by Javier, ~a 6.5 kyrs shift demonstrates a good correlation with interglacial warm period duration.
Warm III (MIS 7e) is a good example. As Javier points out in his Figure 10, MIS 7e onset did not initiate when the obliquity cycle was increasing because insolation was decreasing. As soon as summer insolation began to increase combined with increased obliquity and increased eccentricity, then warming onset began.
Warm V (MIS 11) was also initiated by increasing summer insolation and eccentricity. However, the increase in obliquity was not far behind. Warm V has a lower onset slope possibly due to the predominance of insolation and a more circular orbit. This slower onset results in a more symmetrical pattern for the warm period. Warm periods tend have a slower onset such as Warm I and V during the time when the eccentricity cycle is predominantly circular (Table 2).
There are an additional five occurrences when obliquity increases without initiating a subsequent warm interglacial. These occur when eccentricity is changing from elliptical to circular and insolation is below 550 W/m2 (Javier, Table 5). Obliquity is only successful in initiating an interglacial warm when eccentricity transitions from circular to elliptical and summer insolation is increased. The only exception is a second stunted warm period (MIS 7c) that occurred during the most elliptical cycle. During elliptical cycles, both obliquity and summer insolation are amplified and enhanced obliquity could explain a stunted warm period.
There are approximately ten occurrences when precession/insolation increases without initiating a subsequent interglacial. During this time eccentricity was changing from elliptical to circular orbit and/or obliquity tilt was decreasing.
Steeper and stronger onsets occur when Earth’s orbit is more elliptical and more gradual onsets when the orbit is more circular (Table 2, Figure 8). Obliquity and precession/insolation are more amplified during an elliptical orbit and less pronounced during a circular orbit.
Warm Duration Controls
The past five warm periods last from approximately 10 kyr to 30 kyr (Table 1). The duration of the interglacial warm period correlates well to obliquity which appears to be a dominate control as proposed by Javier (Figure 9 and his Figures 9 and 12). Obliquity cycles are 41 kyr in duration and most of the warm cycles are less than the obliquity cycle. Obliquity increases precede the warm periods by about 6 kyrs due to Earth’s thermal inertia (Javier). Summer insolation cycles have a higher frequency of about 21 kyrs (11 kyrs for ½ cycle) and do not correlate as well as obliquity does with warm periods (compare Figures 8 and Figure 9).
Obliquity is the greatest control on duration and cooling of the warm periods. Most of the warm periods ended due to decreasing obliquity. Although it appears summer insolation frequently decreases during this time.
Warm Periods II and IV have very similar patterns as discussed in the previous section and Figure 5. These two interglacial warm periods occur during a semi-elliptical eccentricity cycle with a similar insolation and obliquity cycle (Figures 8 and 9).
Warm periods III and V are extremely different end members. Glacial Cycle III and Warm III occurs when eccentricity is the most elliptical. Glacial Cycle V and Warm V occurs when eccentricity is predominantly circular.
During the most elliptical orbit, obliquity has the greatest tilt ranging from 22.1 to 24.5 degrees and insolation is the greatest ranging from approximately 430 to 550 W/m2. When [insolation] is greater than 550 W/m2, it can result in an interglacial period (Javier, his Figure 12). Warm III has two warm periods during this elliptical orbit with amplified obliquity tilt and summer insolation cycles. This initial warm period (MIS 7e) was short lived because obliquity began to decrease and ended the Warm period prematurely (Javier). A second stunted interglacial occurs during this cycle, MIS 7c, and was initiated by amplified obliquity.
Interestingly, Warm V is the longest warm period in duration but has the shortest glacial cycle. The short Glacial Cycle V is consistent with the shortest eccentricity/insolation cycle as previously discussed in the eccentricity control. Javier has attributed the extended duration of Warm V (MIS 11) to an additional increasing insolation cycle in the middle of its period as shown in Figure 8.
2nd Order Control Observations
Several smaller warm events (interstadials) and abridged coolings (stadials) which last only thousands of years occur within each warm period. They are easily recognized in Figures 3 and 5. Many of the Holocene intermediate events have been extensively studied and named including; Boiling/Allerod warming interstadial followed by the Younger Dryas Cooling Stadial, and the intervening 8.2 kyr Stadial or cooling during Holocene optimum. Key stadial and interstadial events occur less frequently during warm periods than the Dansgaard-Oeschger cycles which occur primarily during mild glacial periods.
A cooling stadial that is equivalent to the 8.2 kyr event is present in both Warm II and IV shortly after the climate optimum causing the bimodal warming pattern. It is interesting that this event occurs 2 to 3 kyrs after the warm onset. Perhaps a decrease in precession triggered the Holocene 8.2 kyr cooling event as well as in Warm II and IV. The result was a meltwater pulse where glacial lake melting modifies the AMOC (Atlantic Meridional Overturning Circulation) resulting in a cool period.
Cycles of precession/ summer insolation which occur more frequently than obliquity cycles may explain the occurrence of smaller stadials and interstadials within the warm periods. Insolation and obliquity have different frequency cycles. Obliquity full cycles occur every 41 kyrs and insolation varies from 18 to 23 kyrs. Insolation could be a second order modifier on obliquity and initiate an overprint creating a stadial or interstadial during or between obliquity cycles.
Conceptual Models for Warm Periods
A generalized model for Warm II and IV is proposed in Figure 10 to demonstrate the hierarchy and timing of astronomical processes and oceanic processes on these similar Interglacial Warm periods. It is simplified from the detailed science describing these processes and serves as a guide for whether astronomical or oceanic processes dominate. The model assimilates the processes discussed in the previous section for the Holocene and by Javier.

Figure 10: Summary of processes for Warm II (blue) and IV (green) warm periods. Horizontal axis is relative time for kyr. Onset occurs during increasing Eccentricity, Obliquity, and precession/insolation. Obliquity is dominant control over cooling and thus, warm duration. Higher frequency precession/insolation creates stadials and interstadials.
Warm II and Warm IV occur during a semi-elliptical eccentric cycle (Ecc 2 and 4) and are approximately 200 kyrs apart as show in Figure 8. The rapid warming onset require the Milankovitch cycles (eccentricity, obliquity, and precession/Insolation) to be increasing simultaneously or within close timing of each other. These combined cycles terminate the previous glacial period and initiate the onset of the warm interglacial period. Most warm duration culminations coincide with obliquity which subsequently controls the duration. Warm durations can be interrupted by higher frequency insolation creating either a stadial (8.2 kyr event) as in the case of Warm I, II and IV or an extended warm period as in the case of Warm V. The minor temperature fluctuations of +/- 1.5 degrees C during the flatter portion of the warm durations are dominated by oceanic processes (Javier).
A conceptual model is also proposed for the anomalous Warm III and V periods in Figure 11. Eccentricity is very small or circular for Warm V and very elliptical for Warm III. As discussed in the onset section, increasing insolation may have initiated both warming periods with obliquity increasing shortly thereafter.

Figure 11: Proposed processes for anomalous Warm III and V periods. Horizontal axis is time in Kyr. Onset occurs during increasing Eccentricity, Obliquity, and precession/insolation. Vertical axis is relative global temperatures. Curves are Dome C isotope/temperature data.
Warm III had the steepest onset and cooling slopes. The first initial warm period was short-lived. A second stunted warm period occurred approximately 40 kyrs later. The glacial cycle was also one of the longest at 113 kyrs. During the most elliptical cycle, both precession and obliquity are amplified and can initiate a stunted “interglacial” period like MIS 7c.
Interglacial warm periods and glacial cycles show the following characteristics during Elliptical orbits:
- Astronomical forces dominate during the elliptical orbits. Both Earth’s axial tilt is more extreme and Earth’s wobble is more dramatic.
- Glacial cycles tend to be longer (>100 kyrs).
- Temperature changes are dramatic and abrupt with rapid warm onsets and faster cooling slopes.
- Obliquity increases can result in a couple of interglacial periods.
- Predominantly elliptical orbits repeat approximately every 400 krys.
When Earth is in a circular orbit like Warm V and present day Warm I, Earth’s tilt and wobble are less. Subsequently, astronomical forces play a lesser role in the interglacial warm periods. Obliquity tilt and summer insolation still control the warm initiation and closure. However, onset and cooling are more gradual.
Warm V onset was primarily driven by an early increase in insolation and a second increase by obliquity. The warm period was extended by a second summer insolation pulse resulting in its optimum. The warm duration finally ended by decreasing obliquity. The quiet or more stable portions of the long warm period were probably dominated by oceanic processes.
Circular orbits show the following characteristics:
- Circular orbits have less obliquity tilt, lower precision wobble and less summer insolation.
- Glacial Cycles tend to be shorter (<90 kyrs).
- Warm onsets and cooling are more gradual resulting in more symmetrical patterns.
- Oceanic processes dominate during the warm duration creating minor temperature changes (+/- 1.5 degrees C).
-
Predominately circular orbits repeat approximately every 400 kys.
These models were an attempt to compile astronomical and oceanic processes discussed by previous authors (Javier and Ellis and Palmer) and to explain the various repeatable patterns seen in the Dome C isotope/temperature data. Although process interactions are very complex, separating out predominate causes and effects on global temperature should help improve future climate simulation models. Climate models need to include astronomical as well as oceanic and atmospheric forcing to reliably predict future temperature changes and the duration of the Holocene interglacial warm period.
Astronomical processes appear to be the key control for significant temperature changes. Oceanic and atmospheric processes create minor temperature fluctuations during warm periods. However, the culmination and eventual cooling is astronomically controlled. It is impossible for humans to control Earth’s orbit, tilt, or wobble. Since astronomical processes affecting significant climate changes are out of our control, a focus on adaptation instead of climate manipulation is a much better use of resources.
Summary and Conclusions
A Glacial Cycle traverse illustrates that the duration of interglacial/glacial cycles progressively increases from past to present over the past 450 kyrs and are not a simple 100 kyr cycle. Eccentricity and its influence on summer insolation appears to play a dominate role in the duration of glacial cycles. Circular orbits tend to have shorter cycles (<100 kyrs) and more elliptical orbits tend to be longer (>100 kyrs).
Conceptual models are proposed using astronomical and oceanic processes described in the literature to explain repeatable patterns observed in past interglacial warm periods. Prioritizing dominate processes operating in different warm periods may provide general guidelines for future climate models.
Past Warm II and IV periods are well behaved and exhibit strikingly similar warming/cooling patterns suggesting a repeatable interplay of astronomical, oceanic, and atmospheric processes. These repeatable patterns occur every 200 kyrs during semi-elliptical eccentric cycles.
On the other hand, anomalous Warm III and V periods tend to have less predictable patterns and are unique. Warm III occurred during the most elliptical orbit and Warm V during the most circular orbit. Glacial cycles during elliptical orbits tend to have rapid onset and several warm/cool periods because obliquity is amplified and summer insolation dominates. Warm periods during circular orbits tend to have slower warm onsets and are more symmetrical. Oceanic processes may play a greater role during the warm periods but play a minor role in controlling the onsets or eventual cool periods.
During the last 450 kyrs, the five major warm onsets with rapidly increasing temperatures are triggered by increases in the eccentricity, obliquity, and precession of Earth’s orbit. The nearly concurrent increase in these three astronomical forces appears a necessary component for a major warm onset. Obliquity is the dominate control for ending these major warm periods and entering a cooling phase. Higher frequency procession/summer insolation appears to play a secondary role in overprinting the duration pattern with a stadial event such as the Holocene 8.2 kyr or extending a warm period like in Warm V. Oceanic processes dominate during periods of minor temperature changes (+/- 1.5 degrees C).
Dome C isotope ratios and their associated temperature estimates in combination with astronomical data provide ample evidence that astronomical forces control warming and cooling cycles. Because the astronomical processes affecting significant climate changes are beyond human control our focus should be on adaptation rather than climate manipulation. It is not a question if cooling will occur but simply a question of when.
Acknowledgements:
Special thanks to Andy May and Donald Ince for reviewing and editing the article.
This needs to be published. I’ve read some of your articles on LinkedIn, which are also excellent.
Agreed. This is the best discussion of this topic I have ever seen.
Yep. I’ll be curious to see how this is received by the cycle-skeptics.
Superb! A really, really interesting article and a tremendous amount of work! It should definitely be published in my humble opinion. Thanks for submitting it and thanks to WUWT for providing so much interesting stuff to read. Science isn’t dead after all.
Fellow cyclomaniacs unite!
Honestly… Am I the only geo who sees cycles in just about everything I look at?
Figure 2 is really cool… A stratigraphic cross-section of glacial stages.
David, no you are not the only one. Almost all natural phenomena is cyclic. As long as there are oscillatory cyclic forcing functions the outcomes will be cyclic as well.
It’s only now with our better astronomical observations that we are beginning to determine the correlations between orbital cycling and energy flux on earth.
The issue may be in humanities inability to comprehend timescales or dimensions beyond our limited comprehension. Most cannot see the wobbling top that is earth as it orbits and precesses because it occurs over too long a time scale.
Some ten years ago I was described by Dr. S as a ‘cyclomaniac of supreme ignorance’, surely must qualify for a free life long membership.
Andy May, thank you from the humblest of layman for all your work of late editing and proofing all these wonderful posts. And your 4 part series was fascinating, particularly (for me) part 4. My big take away there was that as the northern hemisphere has cooled, the southern hemisphere has warmed. BUT, it hasn’t warmed to the same degree as the northern hemispheric cooling. That one fact, to me, is telling (and may well be the death knell for agw theory). Oddly strange, as your part 4 was perhaps one of the very best posts that i’ve yet to see here at wuwt, it only received fewer than 100 comments! (i mean, WUWT?!)…
Afonzarelli, thanks!
(you’re welcome… ☺)
Good work, but I would add a Figure 2B, restarting each series at the beginning of each cycle, when each inter-glacial begins. I’d like to see how closely the red, green, and blue lines match up. (I’m not sure why you started at the end of each book and read backwards in time.)
Figure 2 is consistent with how geologic cross sections are constructed which enable viewing the Earth as if it were cut open from the side. Therefore, youngest is at the top and oldest at the bottom. Thanks for your comments.
Thanks Dave. Figure 2 of the climate cross-section is one of my favorite figures also.
Ok next post will Datum bottom up.
Agreed.
I was agreeing with Dave that this needs to be published.
Question-How do you figure the earth’s orbit thousands of years ago?
The calculations are complex, but have been performed by many people over the last 100 years. Here is a description: http://www.indiana.edu/~geol105/images/gaia_chapter_4/milankovitch.htm
Milutin Milankovich first did the key calculations in the 1920’s: https://en.wikipedia.org/wiki/Milankovitch_cycles
This is not the first article to suggest a MIS 1 – MIS 11 analogy. Here’s an interesting paper (I think I have this link from a discussion here on WUWT a couple of years ago) that discusses this and also proposes MIS 19 as a possibly better analogy than MIS 11:
https://www.clim-past.net/6/131/2010/cp-6-131-2010.pdf
Eccentricity appears to be a control on the duration of the glacial cycle not necessarily the duration of the interglacial warm period. Since both Glacial Cylce V and I occur during a predominately circular orbit, their glacial cycle may be similar and shorter than 100 kyrs. This does not necessarily suggest that the interglacial warm periods (MIS 1 and 11) will be similar. MIS 11 warm period was extended due to an secondary summer insolation pulse. Obliquity is currently decreasing which may end MIS 1 warm period on time, consistent with other past Warm periods.
How much time before the end of the current Holocene inter-glacial? It seems that temperatures in the past fell quite abruptly leading into the next glacial period. And the trigger…Milankovich forcings only partially explain.
Hard to say as explained in the article. Either very soon or several thousand years from now.
I put a range in the article for the cooling of the current Holocene interglacial when compared to the past interglacial. The end of the Holocene warm ranges from hundreds of years to ten thousand years. However if decreasing obliquity is the key control on cooling, a more precise forecast can be made.
The CO2 “control knob” is noticeably absent.
It’s the treble dial… 😉
Yes, I hear the high-pitch squealing now…
It’s the Trenberth tremble dial. 8<)
That would be the Alarmists. They hate paleoclimatology.
I’m hoping Griff or some other alarmist will chime in to inform us as to how CO2 fits in with the changes seen during the past 450000 years.
Excellent. Apparent that research such as Javier’s and Renee’s are getting close to the true explanations of the ice-ages. Yet research of this important type seems to be ignored compared to the fake scare-mongering stuff.
Beng135:
Dont forget, none of these factors actually explain WHY we are presently in an ice age. It just addresses some of the details about the odd cyclicity imbedded into it. These M cycles have been presumably occuring for 100’s of millions of years without pushing the planet into an ice age. So the other question remains, what started the downward slide in temperatures between Miocene and now, and what will need to happen for overall downward trend to reverse itself?
Maybe we were hit with something? Or had a gravitational nudge. The solar system does move around a spiral arm of our galaxy. I would look for the big picture to explain it too. Certainly the earthly climate-ocean stuff had nothing to do with it.
Steve are you serious? You can pick up any geology text and many other books that have detailed explanations of what triggered the onset of glaciation. I refer u to Canada Rocks, chapter 9 – The Ice Sheets Arrive & page 332 but I encourage u to read the entire chapter.
I suggest we look at the changes in ocean currents with separation of the continents due to tectonic plate movement.
Steve R. – Tectonic movements – sliding around to present position with land-locked north pole and sea-locked south.
Steve,
No mystery there. The posited cosmoclimatological glaciation cycle might be in play, but what clearly is important is plate tectonics and oceanic circulation derived therefrom.
The key event in triggering a cooler and drier earth was the separation of Antarctica by deep oceanic channels from South America and Australia at the Eocene-Oligocene boundary. This set up the Southern Ocean and caused rapid ice sheet formation on Antarctica. When the Southern Ocean briefly shoaled between South America and West Antarctica during the Miocene, the ice sheets waned.
The next important event was the closure of the Inter-American Seaway by the Isthmus of Panama at the Pliocene-Pleistocene boundary. The impact on oceanic circulation led to the initiation of Northern Hemisphere ice sheets. A narrower, shallower version of the Seaway briefly reopened around 1.8 Ma (the old start date for the Pleistocene), but the gap was too negligible to have much effect on oceanic circulation.
Plate tectonics has an effect, if the land masses prevent oceanic currents from mixing the polar and equatorial regions, the poles can get below freezing. If they don’t the poles will be kept warm enough to prevent ice from forming.
The opening of the Drake Passage.
“History doesn’t repeat itself, but it rhymes.”
-apocryphally attributed to Mark Twain
Very good. This is where climate science should have been focused for these past few decades. Until we can explain the big details about the current interglacial, it seems we have little chance of filling in the small details (like CO2) correctly.
Before blindly accepting that Milankovitch cycles are the cause of glaciations and interglaciations, the author ought to investigate evidence contrary to M cycles and the assumptions built into the correlation of climate with M cycles. Once you accept the M dogma, it’s easy to assign percentages of orbital parameters, but as a geologist pointed out years ago, you can find patterns in a keg of nails if you try hard enough.
I don’t think anyone is blindly accepting M-cycles. Its not like we are going to take a consensus vote so relax.
Don is right, its always wise to look in the mirror. Confirmation bias is insidious. The consensus never finds the keys to unlock the secrets to anything. Look for information that exists that you may not even be aware of as a matter of practice.
I have been crushed and blessed many times using this practice. I learned this lesson from my father to hunt deer. He said “The deer are not where you think they are. The minute you enter the woods their job is to keep track of you. Walk for a bit and then stop, be very still and the deer will walk right into you. He was right but I couldn’t shoot such a beautiful creature. I could eat them but not shoot them.
There’s a reason that an incoherent dipmeter is called “a bag of nails”… Not even geologists can find a pattern in it… LOL!
@Don- Is there some particular contrary evidence that you think bears on this concepyual framework?
Yes, there is a lot (which I’ve commented on them many times on WWUT). Some of the most significant are:
1. The N Hemisphere should be out of phase with the S Hemisphere but glacials and interglacials are almost exactly synchronous between hemisphere.
2. M cycles are far to slow to explain the rapidity with which major climate changes occur.
3. Younger Dryas climate changes from full glacial to full interglacial, back to full glacial, and back to full interglacial occurred in less than a century, far to quickly to have been caused by M cycles.
4. The basis for correlation of orbital changes to climate were originally made by ‘stretching’ and ‘compressing’ curves until they fit, then claiming that the correlation ‘proves’ M cycles as the cause of glaciations and interglaciations.
5. And a bunch more.
The point 1 above about n/s hemisphere being out of synch is not entirely correct. Eccentricity drives total annual insolation, globally, unlike the other two orbital parameters.
Don, I was not trying to imply that M cycles are the only cause of glacial and interglacial cycles. I am proposing a conceptual model to highlight when astronomical forces were more dominant influences versus oceanic influences. And I do appreciate the fact that dust and other factors play a partial role in the onset of interglacial periods. I would appreciate your thoughts on other key forces to evaluate for glacial cycle duration, interglacial onset and eventual cooling.
Exiting new data now show excellent correlation between sun spots, total solar irradiance, influx of cosmic radiation, cloud production from ionization by incoming radiation, and global temperatures. These correlations are summarized in a paper I wrote for the Elsevier volume, “Evidence-based climate science.”
Don, how is it that insolation variations can explain a cooling northern hemisphere, and a warming southern hemisphere over the past 7k years of the holocene? (thank you in advance)…
“Winter is Coming”
-Ned Stark
There, someone had to say it.
Yes, but if we are in a cycle similar to V, then it’s quite a while off, if I read this correctly
The duration of glacial cycle may be similar during circular orbits, not necessarily the duration of the interglacial warm period. The cooling and ending of the warm period corresponds more to decreasing tilt, obliquity.
“There will be growth in the Spring”.
-Chauncey Gardiner
And ALGORE is making a pact with the White Walkers.
It would be hilarious if it wasn’t completely tragic. Humanity bands together to fight Global warming when in fact it is actually cooling on just a slightly longer time frame. The trillions spent on reducing meaningless CO2 could buy us a massive orbiting reflector or moon based reflectors to increase insolation and save us all from being buried in ice.
Perhaps such a device could also be used to fry grasping, self indulgent politicians and actors.
Every time I hear some proposal for geo-engineering using reflective mirrors in space or sticking stuff into orbit to “control the weather”‘ I get really worried. We don’t have enough knowledge to risk messing about in this kind of way and could create a real catastrophe. At the very least we risk damaging astronomical research and satellite communication systems.
Ironically there is some Hollywood scare fest about to hit cinemas in which some satellite climate control system goes haywire and starts frying up the Earth’s surface, presumably because some bad guys hack the controls. Vaguely plausible, the most scary part is that the part of the President of the USA is played by an Al Gore lookalike (good casting I suppose).
I don’t think I could sit through another climageddon film starring Al Gore without starting to either laugh or scream hysterically so I guess I won’t be going to watch this.
But life often follows fiction so please discourage the grossly irresponsible ideas to use orbital debris as a means of experimenting with climate.
Perhaps it really is Al Gore in the film !
I prefer Jethro Tull, Something’s on the Move:
Apropos too.
Excellent analysis. Would you please read my link and study the graphics and logic? It might fit as the mechanism for your cycles. My investigation quits where yours begins. https://www.harrytodd.org Thanks!
Wow, even I understood this….Well written !
Thank you.
Good, if dense, review of ice age cycling. Looks a lot more like astronomy than Fred Flintstone’s SUV.
Thank you very much for the citations, Renée. Without trying to be an interested party, it is a very good article that goes quite in depth into the main issues that play a role in the glacial-interglacial cycle, and very well written and educative for the non initiated.
I’d like to abound just on a couple of points.
Regarding the duration of the present interglacial, the astronomical disposition of precession, and more importantly obliquity, clearly classifies the Holocene as a standard interglacial. This means that it won’t last more than 4k years, but it could be less. My personal bet is 2k years, but I don’t expect to be around to collect. That is unless the CO2-maniacs turn out to be correct and both climate sensitivity is really high and CO2 is really stable in the atmosphere. I consider each very unlikely and the probability of both being correct exceedingly small.
Already the Little Ice Age was a time when the world was very close to glacial inception, and glaciers grew to their maximum extent. But the rebound at the end that still continues probably bought us several millennia. Instead of freaking out over the warming we should be celebrating.
Once this interglacial ends it will be ~ 70,000 years until the next, unless we learn to control the orbit of the planet or the climate, also very unlikely. During this time temperatures will not suffer a collapse but will be decreasing at a rate that is slower on average than the rate we have seen during global warming. The problem is that agriculture will become progressively handicapped. We should have more success dealing with that problem. We can move to greenhouse, high yield hydroponics on a CO2 rich atmosphere. We could also try to ameliorate the glaciation by playing with albedo, or a number of solutions that we cannot even imagine. It shouldn’t be the end of the world.
The Younger Dryas appears to have been a freakish event that affected greatly the Northern Hemisphere, not so much the Southern Hemisphere, and almost nothing the oceans (barely noticeable in LR04 benthic core). It coincided with a time of low solar activity, but that doesn’t seem sufficient. There is some evidence (not enough) that a meteorite could have also hit at the time. Other unknown factors might have contributed, perhaps an abrupt change in the Atlantic Meridional Overturning Circulation, or a Heinrich event producing huge amounts of icebergs. There is evidence for all of them. Perhaps a cosmic coincidence.
It shouldn’t be the end of the world.
A comment editor is sorely missed by those of us that hit the button without reviewing.
[Reply: Fixed it for you. ModE ]
Thanks Javier. I very much enjoyed reading your articles. And I agree that the Holocene interglacial warm will be similar to Warm II and IV (MIS 5 and 9), but with a shorter overall glacial cycle.
Think you mean “expound” rather than “abound”.
There is nothing the least bit unusual about the Younger Dryas or the Dryas events that preceded it during the last termination. Every termination is marked by such cooling events, as major meltwater pulses enter the oceans.
The odds against a celestial impact are literally astronomical. There is no physical evidence of such a highly improbably event, and no reason to suppose such a thing. The latest stag in the dark du jour is an alleged platinum anomaly in Greenland ice and at some sites in North America.
https://www.earthmagazine.org/article/platinum-may-point-impact-theory-younger-dryas
I’m with Mark Boslough, an impact physicist at Sandia National Laboratories in Albuquerque, NM, quoted by Earth Magazine, who (with the vast majority of geologists) remains unconvinced that a large impact occurred at the beginning of the Younger Dryas. “The working hypothesis [for the impact theory] is always changing. Sometimes it’s an airburst, sometimes it’s an exploding comet that struck many different places, sometimes it’s a single impact that hit ice or water,” Boslough says. “I am all for having multiple working hypotheses but you need to limit them to those that are physically possible and consistent with the evidence,” he says. In short, he says it’s unlikely that an impact that left no crater could have had climate consequences globally, but if something big did hit ice or water — explaining why there is no crater — it would have produced copious steam, but not the shocked minerals or nanodiamonds that previous studies have claimed as evidence for an impact. Regarding the newly described platinum anomalies across the US, Boslough says he’s awaiting independent confirmation of the results by other researchers.
It should be obvious that whatever slightly elevated platinum might actually exist, it can’t be of ET origin, since none of the other element markers or other indicators of an impact have been found. Just more of the same from the same crew who have tried to eke out a career from this evidence-free, ludicrous, false on its face assertion.
Gloateus, that is why I said that the impact evidence is not enough. Without a crater and/or a proper signature the impact hypothesis will remain not sufficiently supported by evidence.
I disagree that every glacial termination is marked by a YD type of event, or at least I have not seen that evidence myself. Renée has been so kind as to provide a figure 6 above with terminations II, III, IV, and V, and none of them shows a YD event. If termination I was there you would see a clear difference with the rest. YD in the middle of the warming shoot, that probably sabotaged the interglacial maximum temperature, remains a unique event as far as we know.
Regarding the Pt spike, its magnitude is very rare in the ice core, and its temporal coincidence absolute. And the chance for that is small. It is clear to me that this spike has to be related to the YD. The Pt origin can be due to terrestrial or extraterrestrial causes, and in my opinion finding a terrestrial cause might prove more difficult. Pt mining was not well developed in the Paleolithic.
Regarding the absence of a crater, absence of evidence does not constitute evidence of absence.
While I remain skeptical of the impact theory because of, as I said in the above message, insufficient evidence, I also think that the hypothesis cannot be dismissed summarily as Mark Boslough does.
Javier,
Please see Renee Hannon August 4, 2017 at 1:23 pm
She mentions the YD event for Termination V.
Just as other interglacials have 8.2 Ka-style events.
Javier
I’m a great fan of your writings but here I agree with Gloateus that the YD is normal glacial period instability and does not require special explanation. You yourself have shown how the greater equator-pole temperature gradient during glaciation gives more climatic “potential energy” and ultimately instability. In fact for me it is the Bolling-Allerod that is a real phenomenon rather than the YD which is just the interval between the BA and the Holocene. Is not the BA just the last of the many D-O events or “micro-interglacials” that occurred during the last glacial interval. Probably brief self-terminating excursions of the AMOC.
I don’t believe 4 cycles is enough to tell you anything about something as chaotic as glacial cycles.
Except that they are not chaotic but deterministic. Milankovitch predicted that their spacing should be according to orbital cycles. It was found later that it is.
MarkW,
Javier is absolutely correct. The ebb and flow of ice ages is completely deterministic from orbital variability (see the plot I posted on a previous comment). The next ice age is inevitable and no amount of atmospheric CO2 will prevent it from happening again. If alarmists want something to worry about that we know with absolute certainty will occur, they should worry about a km thick glacier bearing down on the East Coast of the US, much of Europe and most of Russia. This will displace 100’s of millions of people, cause trillions in economic harm, precipitate global famine and result in widespread disease, just as it has in the past. During the last ice age, rather than displacing 100’s of millions, the regions impacted were largely unpopulated by man. This inevitable consequences will be a whole lot more inconvenient than a few cm of ocean level rise or a phantom temperature trend.
I think this is real science, with a derived hypothesis put forth for consideration and supporting evidence or refutation. Completely unlike the AGW hypothesis which uses contrived and/or utterly false narratives and appeals to emotion. Anyone is free to pose challenges or data which provide a superior explanation. There is probably a lot of room for questions regarding the exact mechanisms or triggers as well as a great deal more detail on shorter time frames. This is honest to G correlation with actual events which can be verified. If instances can be found where the correlation doesn’t exist, that would be fair criticism and require satisfactory explanation. Likewise, one would hope that the detailed mechanisms within the broad cycles can be identified to flesh out exactly how these events transpire. That information would be potentially very valuable to the human race. Hopefully before the polar bears become the dominant species.
Mark,
The cyclic record goes all the way back to the start of the Pleistocene, at least. The difference is that from ~2.6 Ma to ~1.0 Ma, the cycles are 41,000 years.
So, lots and lots of cycles: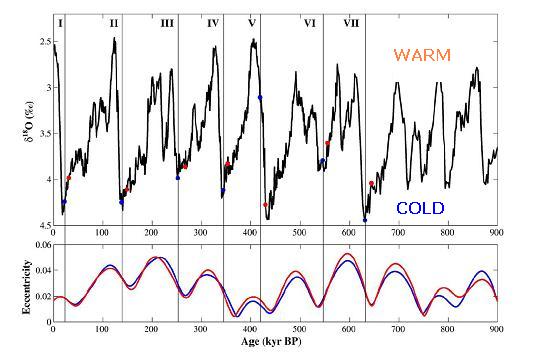
After the Mid-Pleistocene Transition:
Before and after:
http://ice-age-ahead-iaa.ca/small/ice_age15.jpg
Examining ice cores was one of the first steps of due diligence I applied to climate science and there’s absolutely no doubt that the primary influence is orbital and axial variability.
The precession of perihelion has a large effect owing to the asymmetries between hemispheres, where the S is mostly water and the N is mostly land, moreover; the snow belt in the S is mostly over water, thus snow doesn’t have as much of a chance to accumulate. As the orbit gets more elliptical this effect is amplified. One thing that the consensus fails to recognize is the importance of hemispheric asymmetry relative to how orbital and axial variability drives climate change.
The axial tilt affects the relative strength of the seasons. At low tilt angles, cold is concentrated towards the poles and heat is concentrated in the tropics and polar seasonal variability increases. As the tilt increases, the isotherm of 0C migrates towards the tropics as tropical conditions migrate towards the poles and polar seasonal variability is reduced.
I’ve also noticed that the 3 orbital and axial variabilities act independently and when the peaks align, we hit the min and max temperature extremes with changes in axial tilt driving transitions. If they don’t align exactly, interglacial and glacial periods will be longer, but less intense, as has been the case for the current interglacial period which has been both longer and cooler than the last one.
Here’s an interesting plot of ice core data (DomeC and Vostok) smoothed to 22K years in order to cancel out the effects of the precession or perihelion. The effects of axial tilt and ellipticity are clearly evident. It also looks like the temporal alignment of the two cores is quite different as we go further back into the past.
http://www.palisad.com/co2/ic/orbit.png
While we may not be able to control earth’s orbit, it is not actually the position of the earth and sun that is the forcing (god I hate that word). It is the variation in strength and uniformity of solar energy (insolation?) that results from those cycles.
Instead of bemoaning something we cannot control like orbits, seems to me we should be looking into methods for increasing (cause I like warmer) the solar energy to compensate and make more comfortable the planet on which we live.
Although I realize the stress on lack of control is to combat alarmist taxation fantasies. And of course unexpected consequences may be worse than the cycles we have hehe.
I skimmed a lot and will go back to this very interesting post. Thank you Renee. It has been my view (and that of many others) that a bottom up approach favored by the proponents of CAGW IS simply, totally unworkable. Proponents have kindly falsified the approach themselves for us by their preoccupation with jiggering the data to try to fit model performances to observations and missing the mark by 200-300%. I’ve argued that top down from the big geological changes are the only way to frame modelling.
I don’t subscribe to the chaos view of climate change that most sceptics do when they pooh pooh the CAGW folks’ “It’s physics, don’t you know”. The path of an air molecule has no self will or mysteriousness. It does go where it is ordered to go by the physics. However, it is metaphysics to think you can corral and bin all this into a predictive model of any use, and, attractive as it may seem with it’s pretty patterns and things, chaos and it’s “strange attractors” is really a metaphor for too tough a problem to solve.
An engineer has no problem with PV=nRT without being concerned about the details of what’s happening inside the package. The large view of climate is a similar integration. The biggest warming occurs in the big picture and the short term ocean based effects will have brackets on variability imposed by the ocean. Net feedbacks will be negative, period, as long as we have an ocean.
Is this work or anything related published in a peer-reviewed journal?
JV,
Try Science magazine back in the mid to late-’70s, which is where I first saw a Fourier analysis of the cycles, giving credence to the Milankovitch claims.
Warmists hate paleoclimate data as there is very little evidence of the co2 control knob. Very good post!
Yeah too bad in all of eternity, the earth hasn’t had the opportunity to reveal how it would respond to this much CO2 increase in this short of time. We just have to assume there would have been no effect on top of the existing cycles, and go with that then.
My link, https://www.harrytodd.org , shows how the interglacial cycles can be explained by paramagnetic oxygen and wandering magnetic poles. This is not nutcase stuff, no pyramids etc. The paper takes a long time to study, but it is a promising theory. Let’s discuss the possibilities.
Just another nail in the coffin of AGW, good science hopefully will prevail. Can anybody (Geos) suggest an explanation for what started the cycles such as the closing off of the central american isthmus and the Pacific/Atlanta currents?
Wow. Origional approach. Great work. Why the journals as they currently operate are dead.
Piltdown Mann will really get his knickers in a twist when he reads this.
OK so we’re on a Tilt-a-Whirl ride around the Solar System. What’s all this CO2 crap about?
Political power, self enrichment, career building and Eco-loony Socialism!
Maybe the ride has a fog machine adding to the total experience.
What is a bit concerning is that the LIA (Little Ice Age) began 300 years before the long term solar minimums. Perhaps volcanoes had something to do with the onset of Global Cooling. But, that raises more questions. Did ENSO become less of a climate driver? Orbital mechanics cannot account for the onslaught of cooling, which began in the NH sometime before 1315.
I think the orbital mechanics are presented as the driver of the major modal shifts while events like the LIA may be a big deal for humans but don’t really register as important events in the larger scheme of things. If the overall pattern can withstand scrutiny then the next task will be to look for evidence of what smaller phenomena cause or contribute to these smaller events. Until we get rid of the notion that CO2 is responsible for every frosty morning or ruined picnic, no real science can or will be done. The fact that it takes real courage for someone to publish such obvious information is pretty telling as to the intellectual environment Renee is to be applauded for this work.