Guest post by Paul Dorian
*Potential role of low solar activity this winter as solar minimum deepens and the wide-ranging impacts of increasing cosmic rays*

The sun is blank again today and for the 200th day in 2019 as the solar minimum deepens; image courtesy NASA
Overview
The sun continues to be very quiet and it has been without sunspots on 200 days during 2019 or 72% of the time which is the highest percentage since 2009. We have entered into a solar minimum phase of the solar cycle and sunspot counts suggest this could turn out to be the deepest of the past century. Low solar activity has been well correlated with an atmospheric phenomenon known as “high-latitude blocking” and this could play an important role in the upcoming winter season; especially, across the eastern US. In addition, one of the natural impacts of decreasing solar activity is the weakening of the ambient solar wind and its magnetic field which, in turn, allows more cosmic rays to penetrate the solar system. The intensification of cosmic rays can have important consequences on such things as Earth’s cloud cover and climate, the safety of air travelers, and as a possible trigger mechanism for lightning.

Daily observations of the number of sunspots since 1 January 1900 according to Solar Influences Data Analysis Center (SIDC). The thin blue line indicates the daily sunspot number, while the dark blue line indicates the running annual average. The recent low sunspot activity is clearly reflected in the recent low values for the total solar irradiance. Data source: WDC-SILSO, Royal Observatory of Belgium, Brussels. Last day shown: 30 September 2019. Plot courtesy “climate4you.com”.
Background
Solar cycle 24 was the weakest sunspot cycle with the fewest sunspots since cycle 14 peaked in February 1906. Solar cycle 24 continued a recent trend of weakening solar cycles which began with solar cycle 21 that peaked around 1980. The sun is blank again today for the 200th day this year and the last time the sun was this spotless in a given year on a percentage basis was 2009 during the last solar minimum when 71% of the days were without visible sunspots. That last solar minimum actually reached a nadir in 2008 when an astounding 73% of the year featured a spotless sun – the most spotless days in a given year since 1913 – and this year has a chance to match or exceed that quietest of years in more than a century.

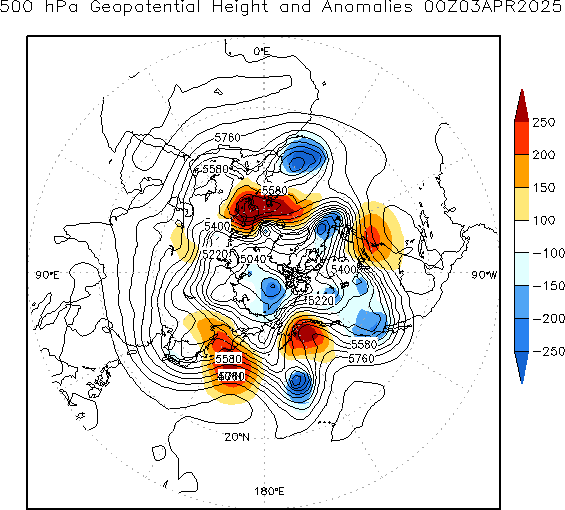
Low solar activity years are well correlated with abnormally high geopotential height anomalies at 500 millibars over high-latitude regions such as Greenland and Iceland (shown in red, orange, yellow); data courtesy NOAA/NCAR
Low solar activity and “high-latitude blocking”
As any snow lover and weather enthusiast knows living in the I-95 corridor, it takes many ingredients to fall into place for a snowstorm to actually take place; especially, in the urban areas of DC, Philly, New York City and Boston. One requirement for accumulating snow is, of course, cold air near or below freezing, but it can be a little more complicated than that. It is one thing to have cold air around at the beginning of a potential storm, but the best chance for significant snow comes when there is sustained cold air; otherwise, you could end up with a snow-changing-to-rain type of event; especially, in the big cities and areas closer to the coast. One of the ways to sustain a cold air mass in the Mid-Atlantic/NE US is to have “high-latitude blocking” and that type of weather phenomenon is well correlated with low solar activity.
“High-latitude blocking” during the winter season is characterized by persistent high pressure in northern latitude areas such as Greenland, northeastern Canada, and Iceland. If you look back at years with low solar activity, the upper-level geopotential height anomaly pattern is dominated by high pressure over these high-latitude regions during the winter season (December-to-February). Without this type of blocking pattern in the upper atmosphere, it is more difficult to get sustained cold air masses in the eastern US during the winter season.
In addition to the increased chance of sustained cold air during low solar activity years, “high-latitude blocking” in the upper atmosphere tends to slow down the movement and departure of storms along the Mid-Atlantic/NE US coastlines and this too increases the chances for significant snowfall as long as there is entrenched cold air. In fact, some of the greatest snowstorms in the Mid-Atlantic/NE US regions took place in low solar activity winters including, for example, those in February 2010, December 2009, and January 1996. There are, of course, other important factors in addition to solar activity to consider in the prediction of accumulating snow along the I-95 corridor including sea surface temperatures in the western Atlantic and the positioning of polar and sub-tropical jet streaks. The 2019-2020 “Winter Outlook” by Perspecta Weather will be released shortly and low solar activity will certainly be one key factor among several.

Data source: The Sodankyla Geophysical Observatory in Oulu, Finland. Plot courtesy Spaceweather.com
Low solar activity and cosmic rays
Galactic cosmic rays are high-energy particles originating from outside the solar system that can impact the Earth’s atmosphere. Our first line of defense from cosmic rays comes from the sun as its magnetic field and the solar wind combine to create a ‘shield’ that fends off cosmic rays attempting to enter the solar system. The shielding action of the sun is strongest during Solar Maximum and weakest during Solar Minimum with the weakening magnetic field and solar wind. The intensity of cosmic rays varies naturally during the typical 11-year solar cycle with about a 15% variation because of the changes in the strength of the solar wind.
Evidence of an increase in stratospheric radiation
One way to monitor cosmic ray penetration into the Earth’s upper atmosphere is to measure stratospheric radiation over an extended period of time. “Spaceweather.com” has led an effort for nearly four years to monitor radiation levels in the stratosphere over California with frequent high-altitude helium balloon flights. These balloons contain sensors which detect X-rays and gamma-rays in the energy range 10 keV to 20 MeV and are produced by the crash of primary cosmic rays into Earth’s atmosphere. These energies span the range of medical X-ray machines and airport security scanners. The findings confirm the notion that indeed cosmic rays have been steadily increasing over California as we climb into the solar minimum.
During the last solar minimum in 2009, radiation peppering Earth from deep space reached a 50-year high at levels never before seen during the satellite era – and we’re getting very close to those same levels and a new record is certainly on the table in the near future. Ground-based neutron monitors and high-altitude cosmic ray balloons are registering the increase in cosmic rays. Neutron monitors at the Sodankyla Geophysical Observatory in Oulu, Finland show that cosmic rays are just percentages away from a new record in the satellite era which was set in 2009. Data has been measured at this observatory in Finland since 1964. When cosmic rays hit Earth’s atmosphere, they produce a spray of secondary particles that rain down on Earth’s surface. Among these particles are neutrons and the detectors at the observatory in Oulu count them as a proxy for cosmic rays.
Consequences of increasing cosmic rays
1) Cloud cover/climate
The correlation between cosmic rays and cloud cover over a solar cycle was first reported by Svensmark and Friis-Christensen in 1997. A more recent study by Svensmark published in the August 2016 issue of Journal of Geophysical Research: Space Physics continues to support the idea of an important connection between cosmic rays and clouds.
In this publication, the authors found that “the observed variation of 3–4% of the global cloud cover during the recent solar cycle is strongly correlated with the cosmic ray flux. This, in turn, is inversely correlated with the solar activity. The effect is larger at higher latitudes in agreement with the shielding effect of the Earth’s magnetic field on high-energy charged particles. The above relation between cosmic ray flux and cloud cover should also be of importance in an explanation of the correlation between solar cycle length and global temperature that has been found”.
2) Threat to air travelers
Not only can an increase of cosmic rays have an impact on Earth’s cloud cover and climate, it is of special interest to air travelers. Cosmic radiation at aviation altitudes is typically 50 times that of natural sources at sea level. Cosmic rays cause “air showers” of secondary particles when they hit Earth’s atmosphere. Indeed, this is what neutron monitors and cosmic ray balloons are measuring–the secondary spray of cosmic rays that rains down on Earth. Secondary cosmic rays penetrate the hulls of commercial aircraft, dosing passengers with the whole body equivalent of a dental X-ray even on ordinary mid-latitude flights across the USA. International travelers receive even greater doses (source). The International Commission on Radiological Protection has classified pilots as occupational radiation workers because of accumulated cosmic ray doses they receive while flying. Moreover, a recent study by researchers at the Harvard School of Public Health shows that flight attendants face an elevated risk of cancer compared to members of the general population. They listed cosmic rays as one of several risk factors.
3) Possible lightning trigger
Finally, there has been some research suggesting there is a connection between cosmic rays and lightning (paper 1, paper 2). When cosmic rays smash into molecules in our atmosphere, the collisions create showers of subatomic particles, including electrons, positrons, and other electrically charged particles. This shower of electrons would collide into still more air molecules, generating more electrons. All in all, cosmic rays could each set off an avalanche of electrons and trigger lightning.

Circled areas on plot indicate locations that experienced the northern lights during the Carrington Event of 1859.
Final Thoughts
While the frequency of solar storm activity generally lessens during periods of low solar activity (e.g., during solar minimum phases), there is actually some evidence that suggests the severity does not diminish. In fact, the most famous solar storm of all now known as “The Carrington Event” took place in 1859 during an overall weak solar cycle (#10). In addition, other solar activity, such as coronal holes that unleash streams of solar material out into space, can amplify the auroras at Earth’s poles. The bottom line, a lack of sunspots does not mean the sun’s activity stops altogether and it needs to be constantly monitored – even during periods of a blank sun.
Meteorologist Paul Dorian
Perspecta, Inc.
perspectaweather.com
I’m like a bright giant love ball, bouncing around so free
a bright giant love ball, happy to be me
I’m like a bright giant love ball, shining for all to see
I AM SPECIAL! I AM SPECIAL! I AM ME!
So let us dance, oh let us dance,
be happy, be happy let us dance,
Oh let us dance, oh let us dance,
let us dance and laugh and sing and shout for joy!
~The Rev Carey Landry, Giant Love Ball
Ive never read a statement from the climate begade, that included the solar cycles, the el nino cycles, the current north/south flip, the south Atlantic alimony. Neither have I read them mention past weather cycles, all of a sudden all weather events are “its a record sunny day” “OMG it rained for 2.7 minutes” its the wetesr day Ever! Even with all this scientific research, they dismiss it all, and stick with co2 😐
Not the case. Every piece of climate science will also include all the relevant natural/pre-existing cycles – as well as the evidence for the new, additional climate driver which is human CO2.
Ed, you don’t seem to realize that there is no empirical, observed evidence of CO2 driving climate.
It’s just a popular opinion which has gained traction as a tool of socialist reformation of the global order.
By «socialist reformation» you mean «Corporate driven capitalist globalisation», right?… «Socialism for the very rich – bankers bailout, remember – and “whatever” for the so-called “middle-classes”». And China, lets not forget China… Their leaders keep using coal and oil for their country’s development… See the logic?…
Cronyism and monopolies are a threat to free markets. Big statism, which includes Socialism-Communism, would rather deal with a few powerful companies that they can control (and get kick backs to sham charities, friends, and family members). For countries that faced economic reality that Communism is inefficient and cannot compete with free market innovation, they evolved limited state directed crony Capitalism. As the U.S. becomes increasingly Socialist and driven to central planning, so also will the cronyism ramp up.
You can’t get cronyism without corrupt government officials who use the right of violent force to enforce their laws.
When anyone claims to know “…all…” about anything, I protect my wallet.
Maybe you could provide an example that demonstrates what you say to be true. I can’t even find “Human CO2 is the primary driver of climate change” evidence in the IPCC literature. I have never received an answer to the question…What caused the climate to change BEFORE humans were here to cause the climate to change? Maybe you can provide the answer. Maybe not
That south Atlantic alimony will get you every time. It’s a good reason not to get wedded to the consensus.
LOL. I was going to ask if that was a Freudian slip 🙂
The South Atlantic alimony is a fish served in fine restaurants.
Everyone who is anyone knows that !
Y’all want grits with that?
Sunny, you are right.
We have just had ‘Short Sharp Shower Philibert’.
It has kept the dust down, but not much more.
It’s worse than they have told us – every transient bit of weather gets a name [somehow!], and it’s all to scare the millennials, who, obviously, have never seem rain – or wind, or a summer’s day – before.
Suitably scared, it is expected that they will vote in the Socialist [OK, Communist] Saviours (self-appointed) who offer themselves for election on a ‘One Man, One Vote, One Time’ basis.
Auto
I have long noted on Twitter that there are certain ones who are very close to the movers and shakers of AGW/CC. One, until he figured out it was dumb to admit it, had on his profile that he was part of Agenda 21, had met Al Gore and the, now disgraced, railroad engineer, Dr. Rajendra Pachauri, who for some reason chaired the IPCC’s climate “science” panel. Others are big in the renewable energy business (though they tried to hide it but the internet is a wondrous thing). I consider these ringleaders and their sycophants to be testers of AGW/CC memes to see if they fly or, not.
Currently, two memes have emerged. One is that “scientists say” neither clouds nor the sun have any effect on climate and the other meme that has been floated is that past climate history doesn’t matter as Earth is now in new territory because of Man’s use of fossil fuels which is adding “extreme” amounts of CO2 to the atmosphere and that has never happened before. Ergo, the past is irrelevant and we don’t need no stinkin’ geologists, paleontologists etc. to be studying the past or the climate.
That meme may explain or, be an effort to excuse this fact recently reported in this excellent article;
25 simple bullet points proving CO2 does not cause global warming: by a geologist for a change
http://bit.ly/2LDruvR
June 9, 2019
1) Geologists know climate change unrelated to atmospheric CO2 occurred throughout Earth’s 4.5-billion-year history. Yet the IPCC (United Nations Intergovernmental Panel on Climate Change) has no geologists among the hundreds of appointed authors of its Fifth Assessment Report of 2014 and its Sixth Report due in 2022 (see my Technical Note 2019-10). Thus IPCC incredibly lacks both geological input and long-term perspective.
Also, with the Sun in the Grand Solar Minimum, they may be testing excuses for why CO2 is rising but it’s getting colder. After all, it looks like they’re going to have to come up with something to explain it and soon. I doubt if flip-flopping again back to the 1970s and saying, “Oops, we were right back then, after all. CO2 causes Cooling, not Warming. Sorry about that.”
We like bold predictions. Don’t we. So, what may not happen during this deep sunspot minimum?
No sea level rise? No rise of global temperature? No shrinking glaciers?
What we don’t want to see is ad hoc hypotheses attempting to save the theory if the predictions fail.
If a significant cooling happens in the coming few years, can we expect honest reporting of this from NASA and other observers committed to AGW? How will troll farms like IPCC act.
I think we stand before conclusive times. This will test the scientific honesty in both AGW- and Svensmark believers.
There should be no “believers” in science. Belief is the realm of religion. Both AGW and Svensmark and all other theories on climate should be doubted….and then tested against data from the real world. Bold predictions are fine, especially if they are testable and falsifiable through data accurately measured.
Kwinterkorn – The problem with the left is that they ‘believe’ in science, but when it comes to religion they try to ‘fact check’ it (Mary wasn’t a virgin, the Earth was created in 4004 B.C., etc.) The left has science and religion exactly backwards.
war is peace
freedom is slavery
ignorance is strength
What «left» ?
I like your attitudes.
Cosmic ray theory doesn’t work in the real world. Cosmic ray proponents are making the same mistakes the AGW crowd make, broad generalizations without specific predictions about the all-powerful effects of the minor atmospheric component influence from CO2 or cosmic rays.
Cosmoclimatology/the Svensmark Effect is a spurious correlation.
The ocean produces the low clouds Svensmark claims for his cosmic ray theory, during increasing MEI/decreasing Central Pacific OLR conditions, as observed here featuring figure 10 from Henrik Svensmark’s Force Majeure article.
Central Pacific Outgoing Longwave Radiation [CP OLR] always goes positive when the Nino34 region cools off, and MEI drops, implying fewer clouds, according to the following empirical research.
The strong OLR-cloud empirical relationship is plotted here and here.
Cosmic rays exhibit almost no correlation with total ISCCP cloud data
Clouds (and CO2) are ultimately outcomes of solar cycle TSI variation.
The low clouds cited by Svensmark are sourced by the tropics. Warm tropical waters spread into the northern ocean while simultaneously the atmosphere cooled in the north during the solar minimum from the cumulative effect of declining/low TSI, creating perfect conditions for low-level evaporation and clouds that are mistakenly attributed to cosmic rays that are concurrently high with the low TSI. These are currently ripe conditions for major NH snowfall this winter.
These low level clouds are similar to the fog over a warm pond or lake when the air temperature is very low, same principle. The northern climate is in sync with the ocean, driven by the tropics.
For the cosmic ray climate theory to really be viable, it must control the tropics, Nino34, but how can it do that when galactic radiation doesn’t reach that far?
It’s no coincidence that cosmic rays and clouds follow the solar cycle, but to claim cosmic rays cause the clouds is a misattribution, just like attributing temperature rise to increasing CO2, wherein both theories implicitly ignore the primary role of the sun’s TSI in warming/cooling the ocean.
Bold predictions are fine, especially if they are testable and falsifiable through data accurately measured.
I’m with you all the way on that kwinterkorn. I wish the cosmic ray crowd was too.
The cosmic ray research crowd had at least a 20 to 30-year headstart on me, yet in that time they haven’t made a single noteworthy prediction, whereas I’ve made and discussed several good TSI-based predictions here at WUWT many times, which I did empirically starting five years ago, based on principles I first hypothesized, quantified, then tested with regular real-world data, not some lab experiments like the cosmic ray crowd.
My prediction from AGU Fall Meeting Dec 2018 is for hard winters until TSI rises with the next cycle, a testable and falsifiable prediction.
Bob W
Why did CERN check Svensmark’s theory in their giant low pressure atmospheric chamber and conclude that the mechanism is there (it works in practise) and that the effect was “much greater than expected”. Why would they say that if it is not true?
Yes, the old ‘climate in a lab’ trick… and don’t forget Forbush decreases.
Northern low clouds are continually built up after the solar maximum from Nino34 surges until after the minimum and the following solar cycle onset ENSO clears the air.
High cosmic rays are covariant with low TSI, like CO2 outgassing w/ocean warming.
No matter where the Nino34 based MEI starts from, any increase yields more clouds. Look closely here to see this action – increases in MEI from any level cause clouds to increase, which accumulate.
These clouds don’t dissipate immediately, they move north (and south in SH) and whatever doesn’t precipitate or move out collects in the north (and south in SH).
The solar energy the ocean absorbed through the solar max takes a nearly equal time to cool via conduction and evaporation, with an ongoing declining cycle solar activity influence, causing Nino34 to rise and fall, with increases always producing more clouds that in the low levels aren’t dissipating as fast as they’re created, allowing them to accumulate while coincidently cosmic rays increase.
The important parameter for clouds here is water vapor from evaporation, not cosmic rays. Does anyone think cosmic rays are absolutely required for evaporation or for water vapor to condense into cloud droplets? It’s like asking if CO2 is necessary for warming.
Bob, I have enough of a background and education in science (medicine) to not be totally lost but not enough to be anywhere near confident that I can correctly interpret the CC studies. I am really interested in your thoughts about cosmic rays. Do you have an opinion on galactic rays?
I’ve read these studies that do differ from your opinion. Do we have enough data and info. to know with certitude about these things?
NO EXPERIMENTAL EVIDENCE FOR THE SIGNIFICANT ANTHROPOGENIC CLIMATE CHANGE
6/29/19
https://arxiv.org/pdf/1907.00165.pdf
Kobe University
New evidence suggests that high-energy particles from space known as galactic cosmic rays affect the Earth’s climate by increasing cloud cover, causing an ‘umbrella effect’.
http://bit.ly/2KH9aAg
If you have time to respond, I do appreciate it.
https://wattsupwiththat.com/2019/09/28/global-climate-intelligence-group-founded/#comment-2808876
[excerpts]
The current climate hysteria is a well-funded global campaign, conducted by the wolves to stampede the sheep. Why now? Because the global warming scam will soon come tumbling down, where even the most stupid warmist acolytes will realize they have been duped. How will this happen?
The failed catastrophic very-scary catastrophic global warming (CAGW) hypothesis, which ASSUMES it is caused by increasing atmospheric CO2, driven by fossil fuel combustion, will be clearly disproved because fossil fuel combustion and atmospheric CO2 will continue to increase, CO2 albeit at a slower rate, while global temperatures cool significantly.
This scenario has already happened from ~1940 to 1977, a period when fossil fuel combustion rapidly accelerated and atmospheric temperature cooled – that observation was sufficient to disprove the global warming fraud many decades ago.
Regarding Willie Soon’s recent video at
https://wattsupwiththat.com/2019/09/15/global-warming-fact-or-fiction-featuring-physicists-willie-soon-and-elliott-bloom/
Willie Soon’s best points start at 54:51, where he shows the Sun-Climate relationship and provides his conclusions.
There is a strong correlation between the Daily High Temperatures and the Solar Total Irradiance (54:51 of the video):
… in the USA (55:02),
Canada (55:16),
and Mexico (55:20).
http://woodfortrees.org/plot/pmod/offset:-1360/scale:1
Solar Total Irradiance is now close to 1360 W/m2, similar to near-lows circa 1915, 1960 and 1970. Atmospheric temperatures should be cooling in the near future – maybe they already are.
BACKGROUND INFORMATION:
We do know that the Sun is at the end Solar Cycle 24 (SC24), the weakest since the Dalton Minimum (circa 1800), and SC25 is also expected to be weak. We also know that both the Dalton Minimum and the Maunder Minimum (circa 1700) were very cold periods that caused considerable human suffering.
I wrote in an article published 1Sept2002 in the Calgary Herald that stated:
“If [as we believe] solar activity is the main driver of surface temperature rather than CO2, we should begin the next cooling period by 2020 to 2030.”
That prediction was based of the end of the Gleissberg Cycle of ~80-90 years, dated from 1940, the beginning of the previous global cooling period from ~1940 to 1977.
“Kyoto Hot Air Can’t Replace Fossil Fuels”
Calgary Herald, September 1, 2002, by Allan M.R. MacRae
https://wattsupwiththat.com/2009/01/10/polar-sea-ice-changes-are-having-a-net-cooling-effect-on-the-climate/#comment-63579
In 2003 Theodor Landscheidt’s published his famous prediction of global cooling, in which he wrote:
“… it can be seen that the Gleissberg minimum around 2030 and another one around 2200 will be of the Maunder minimum type accompanied by severe cooling on Earth.”
Within the timing accuracy of such predictions, we are essentially saying the same thing, although Landscheidt is predicting more severe cooling.
“New Little ICE Age Instead of Global Warming?”
Theodor Landscheidt First Published May 1, 2003
Energy & Environment
https://doi.org/10.1260/095830503765184646
“Abstract
Analysis of the sun’s varying activity in the last two millennia indicates that contrary to the IPCC’s speculation about man-made global warming as high as 5.8°C within the next hundred years, a long period of cool climate with its coldest phase around 2030 is to be expected. It is shown that minima in the secular Gleissberg cycle of solar activity, coinciding with periods of cool climate on Earth, are consistently linked to an 83-year cycle in the change of the rotary force driving the sun’s oscillatory motion about the centre of mass of the solar system. As the future course of this cycle and its amplitudes can be computed, it can be seen that the Gleissberg minimum around 2030 and another one around 2200 will be of the Maunder minimum type accompanied by severe cooling on Earth. This forecast should prove ‘skillful’ as other long-range forecasts of climate phenomena, based on cycles in the sun’s orbital motion, have turned out correct, as for instance the prediction of the last three El Niños years before the respective event.”
DISCUSSION AND CONCLUSION:
… there is no question that global warming alarmism is not only false, it is fraudulent, as evidenced by the Climategate emails, the Mann hockey stick (MBH98 and subsequent papers) and rational scientific analysis.
The global warming alarmists use Goebbels tactics, later adapted by Saul Alinsky in “Rules for Radicals (1971), to stampede the gullible public.
http://www.psywarrior.com/Goebbels.html
https://en.m.wikipedia.org/wiki/Rules_for_Radicals
…
Rule 7 states: “A tactic that drags on too long becomes a drag.”
That rule explains the frequent changes in the name of the false crisis – from global warming to climate change to sustainability to climate crisis to extinction – I may have missed a few others. Keep it new and exciting for the sheep – mustn’t let them get bored.
Rule 13 states: “Pick the target, freeze it, personalize it, and polarize it.”
That explains the vicious hostility that warmists display towards anyone who dares disagree with their falsehoods, and the blatant Green Big Lie “The science is settled”.
Alinsky’s rules closely describe the propaganda strategy of the global warming scam, and it has been executed with precision, with huge covert funding from extreme leftist sources.
The above scenario, of significant global cooling even as fossil fuel combustion continues, has already happened, from ~1940 to 1977, a period when fossil fuel combustion rapidly accelerated and atmospheric temperature cooled – that observation was sufficient to disprove the global warming fraud many decades ago.
I wonder what the beginning of a global cooling period will look like:
Maybe a cold weather delay of one month in the planting of the huge Midwest North American grain crop? Oh – that happened for the past two years!
Maybe cold-and-wet Spring weather such that ~30% of the huge USA corn crop did not even get planted, because the ground was too wet for farm equipment? Oh – that happened this year!
Regards, Allan
Allan M. wrote:
“The failed catastrophic very-scary catastrophic global warming (CAGW) hypothesis …”,
Unfortunately, this hypothesis has NOT failed — it is a political hypothesis accomplishing everything it was intended to accomplish in politics — scaring people into demanding that their goobermint do something now, about the (imaginary) coming climate crisis.
CAGW is the current leftist-invented boogeyman used to sell socialism.
It will be replaced by a new boogeyman when it stops scaring people,
perhaps exploding breast implants ?
Um, not “exploding breast implants.” They’ve already bankrupted Dow Corning on that boondoggle. And a number of women died as a result of it. They freaked out and had the things cut out. But it made the lawyers rich, even though it was all hogwash.
But you’re correct that they will come up with something. I don’t know how to stop this evil gravy train.
Richard, I understand what you are saying, but to clarify:
As a scientific hypothesis, CO2-driven runaway global warming was disproved decades ago – it is a deliberate scientific fraud, intended to stampede the sheep.
As a political ruse, global warming alarmism has succeeded remarkably well, which reflects the corruption and stupidity of so many people, especially our politicians.
I have heard some strategists say – “Don’t challenge the science, that battle is lost.”, to which I reply, “If you want to get in bed with scoundrels, you will soon become one of them, and ultimately everyone will know you as a fraudster.”
I suggest there is only one proper course of action, and that is to tell the scientific truth. As we wrote in 2002:
“Climate science does not support the theory of catastrophic human-made global warming – the alleged warming crisis does not exist.”
“The ultimate agenda of pro-Kyoto advocates is to eliminate fossil fuels, but this would result in a catastrophic shortfall in global energy supply – the wasteful, inefficient energy solutions proposed by Kyoto advocates simply cannot replace fossil fuels.”
Both these statements are demonstrably true to date.
Reference: APEGA’s “Debate on the Kyoto Accord”, published in the PEGG November 2002, reprinted by other professional journals, The Globe and Mail and La Presse
by Sallie Baliunas, Tim Patterson and Allan MacRae, November 2002
http://www.friendsofscience.org/assets/documents/KyotoAPEGA2002REV1.pdf
While GCRs are up, global temperatures are also way up.
Not even a correlation.
That’ll be why we’ve been breaking ‘coldest temperature EVER!’ records all around the world lately.
What I don’t understand is why such a small change in galactic cosmic rays is supposed to have such a dramatic effect? It looks like we’re talking maybe a 15% increase, which doesn’t seem that big an issue to me.
That’ll be why you should always talk about the ratio of cold to hot records. Guess where that is heading.
What effect? If you don’t have correlation you probably don’t have a lot of causation either.
Loydo – your link points to the surface temp record, which uses and homogenizes data from weather stations mostly not purposed to measure climate. More realistic temperatures are from satellites, weather balloons and a subset of weather stations purposed to measure long-term climate trends w/o land-use changes.
I worked at an engineering firm in the 1990s and we were upgrading the FAA’s infrastructure. Most of the money went into Com, Nav, and Surveilance systems. Weather stations – mostly AWOS and ASOS – were a lower priority and poorly maintained. When we learned Climate modelers were using data from these systems we were horrified!
raw data shows the same as homogenized when it comes to the ratios of hot to cold
ITS GETTING WARMER.
duh,
Now, you MIGHT want to argue about the WHY
you MIGHT want to dig into code and find an actual problem with homogenization
but
1. the raw record shows warming ( actually MORE WARMING)
2. the global ice amounts are shrinking
3. sea level is increasing
4. Animal ranges are changing
5. Plant ranges are changing.
IT IS GETTING WARMER, even as the solar output has decreased from 1980
IT IS GETTING WARMER.
there was an LIA
As we plunge into the depths of a solar minimum, the world gets warmer and warmer.
Who would have thunk that?
When does the stadium wave start? Where are all the cooling clouds caused by the GCRs? Where is the LIA 2?
I’m not sure whether I need to have my AC or the furnace serviced for the winter.
Steven: I have no doubt that it is warmer now than in the LIA, something for which I am very thankful. However, items 2-5 on your list only reflect that it is now currently warmer. They are not evidence that the warming is continuing. If temperatures ‘flat-lined’ from now through eternity, ice would continue to melt, seas would rise because of it, and plants and animals would continue changing their habitats until everything adjusted to the new norm.
But if we are lucky, we WILL continue to warm. If future generations cannot cope with a gradual sea-level rise, then it will be time to hit the reset button on this civilization. Perhaps it will give them something to fight instead of each other.
Re Mosher”
here is how we get warming today:
https://realclimatescience.com/2019/10/smoking-gun-of-fraud-in-ushcn-adjustments/
Mosher – there was a WUWT posting earlier this year which presented U.S. temperatures from a subset of weather stations purposed for long-term climate monitoring. I recall no significant trend. Could someone post a link??
USCRN. Basically flat, maybe a tad of cooling, since 2006.
Steve belongs to the crowd that has convinced itself that natural change stopped the minute man started releasing CO2 into the atmosphere. All change from that point on is due to CO2 and nothing else.
It appears that there is latency between solar minimums and effect on the climate. Latency is a time interval between the stimulation and response, or, from a more general point of view, a time delay between the cause and the effect of some physical event. Complex chaotic systems (e.g. the climate) often exhibit latency. It’s been slowly warming since 1850. No one is sure when or if a cooling period will begin. Paul Dorian suggests that we may be entering a change from warming to cooling based on solar radiation.
Unless you belong to some climate alarmist religion, you might consider that he could be correct.
Love the way the troll desperately searches for a metric that supports what he believes, then declares that this metric is the only one that matters.
Of course lets ignore the many well documented problems with ground based sensors.
“coldest temperature ever” is one way to summarise Dr. Spencer’s recent post that September
was the warmest September on record according to satellite measurements. Similarly it was
the warmest summer on record in the Northern Hemisphere. Not sure where these “coldest
temperature ever” records are from but they are no representative of the globe.
The ‘coldest temperature ever’ records are coming from surface thermometers all around the planet. Many places in North America just saw that happen, and North America has had one of the worst growing seasons in decades during the ‘warmest summer on record’.
Not to mention breaking snowfall records and earliest snowfall records. During the ‘warmest year ever!’
And we came within two degrees of a frost in August… during the ‘warmest summer on record.’ Which is one of the reason I broke the ‘earliest fitment of winter tires on my car’ record this year.
Record Low Temperatures Across European Russia
August 8, 2019
http://bit.ly/2OO4wEt
Don’t Tell Anyone, But We Just Had Two Years Of Record-Breaking Global Cooling
http://bit.ly/2IBiEue
Writing in Real Clear Markets, Aaron Brown looked at the official NASA global temperature data and noticed something surprising. From February 2016 to February 2018, “global average temperatures dropped by 0.56 degrees Celsius.” That, he notes, is the biggest two-year drop in the past century…
Then, there is this;
Don’t Tell Anyone, But We Just Had Two Years Of Record-Breaking Global Cooling
http://bit.ly/2IBiEue
Writing in Real Clear Markets, Aaron Brown looked at the official NASA global temperature data and noticed something surprising. From February 2016 to February 2018, “global average temperatures dropped by 0.56 degrees Celsius.” That, he notes, is the biggest two-year drop in the past century.
Then, there is this quite remarkable statement from NASA.
Carbon Dioxide is a Cooling Gas According to NASA
http://bit.ly/2yDcsxt
…One part of NASA is now in conflict with its climatologists after new NASA measurements prove that carbon dioxide acts as a coolant in Earth’s atmosphere.
We are stupid idiots with one dead scenario ignoring paradoxes.
Obviously there is a missing variable that is controlling stuff (including temperature, other physical things changed at the same time) on our planet.
That physical variable suddenly changed in 1994 to cause:
1) planetary cloud cover started to reduce and continue to reduce no longer correlating with GCR (Palle)
2), There was a sudden and paradox large, 300% increase in mid-ocean earthquake frequency worldwide that started in 1994 which continued a the paradoxical high rate up until recently when it started to drop again. (Temperature changes in the period are strongly correlated with changes in the earthquake frequency where change in earthquake freq. leads by two years the temperature change)
3)The north geomagnetic pole suddenly accelerated by a factor of five.
In old school science there is a physical explanation for everything. There is and must be a physical force that suddenly increased to cause the 300% increase in mid-ocean earthquakes. The missing variable effects are powerful.
What we are waiting for is manifestation of unexplained phenomena that is large enough to get our attention.
A drop in temperature in the south indicates something else. An increase in ionization over the polar vortex in winter causes blockages in the polar vortex.

I cannot believe someone posted a link to ‘skepticalscience’ here.
Do you expect to be taken seriously?
Leo Smith. It’s Loydo. The Church of Global worming’s equivalent of a Jehovah’s witness, but without the same level of credibility. Last he told us that winter ice in the Arctic was so frail Loydo could take it on in a dingy.
He could. For about 2 seconds. Which is about how long it takes to freeze to death up there. I was stationed in Point Barrow Alaska back in the 80’s, and I guarantee you that even if it’s warmed up a few degrees it won’t matter. Instant Loydo-cycle.
Source of their data? No indication of that on the graph other than Sks, which is proven bogus.
Loydo, …… and just what year during the last 100 …… was NASA’s temperatures not “hotter”?
Your chart ends in 2012. Earth to Loydo, it’s 2019 (almost 2012) and I end in 11 years.
Scissor,
Say what?
Are you off your meds.
Try a re-write, please.
[I, too, expect to end in about 11 years, maybe 12, or possibly 15.]
Way up? Really? A few tenths of a degree following a weak El Nino?
Is that the best you got?
Loydo, I have seen you use the despicable desmogblog as a reference which is funded by a convicted felon (fraud) and run by a PR guy who represents a number of “green companies”. Neither of them has any background in science. Zero, nada, zilch.
Now, you quote Skeptical Science. Why do you not go to real science sites?
Are you unaware of this;
The Truth about Skeptical Science
http://www.populartechnology.net/2012/03/truth-about-skeptical-science.html
Skeptical Science is a climate alarmist website created by a self-employed cartoonist, John Cook (who apparently pretends to be a Nazi). It is moderated by zealots who ruthlessly censor any and all form of dissent from their alarmist position. This way they can pretend to win arguments, when in reality they have all been refuted. The abuse and censorship does not pertain to simply any dissenting commentator there but to highly credentialed and respected climate scientists as well; Dr. Pielke Sr. has unsuccessfully attempted to engage in discussions there only to be childishly taunted and censored, while Dr. Michaels has been dishonestly quoted and smeared. The irony of the site’s oxymoronic name “Skeptical Science” is that the site is not skeptical of even the most extreme alarmist positions.
John Cook is now desperately trying to cover up his background that he was employed as a cartoonist for over a decade with no prior employment history in academia or climate science.
Thanks to the Wayback Machine we can reveal what his website originally said,
“I’m not a climatologist or a scientist but a self employed cartoonist” – John Cook, Skeptical Science
You make no atempt to refute the argument. Here is yet another fatal blow:
http://hyperphysics.phy-astr.gsu.edu/hbase/thermo/imgheat/solactm.gif
The fact is that the “Potential role of low solar activity this winter as solar minimum deepens and the wide-ranging impacts of increasing cosmic rays” is neglible.
What are the figures for the flight crew of high flying
aircraft suffering cancer as compared to the persons not
frequently flaying.
Ary figures on females either in the crew or pilots wives
in having difficulty in conceiving children.
Is there any way to protect such flight crew from
such radiation ?
MJE VK5ELL
Just retired after 28 years international airline flying Asia-based. All I can contribute is, our rostering system ‘supposedly’ took into account radiation exposure, and would alert Scheduling if the supposed limit was reached. I never heard of this happening to any of us, and I forget the figures they used. As an aside, solar activity could cause problems with High Frequency radio comms at times.
I was told that dosages were higher on high-latitude sectors and with higher cruising levels.
I was more concerned health wise about a career’s worth of airline food, dehydrated cabin air, sleepless nights, jet lag and cr@ppy hotels! Ended up with gut aches which I put down to the aforementioned food but was actually bowel cancer (all good now after surgery).
Lucky Lucky man,. Two people I knew are dead from it.
“Sir Lands-a-lot October 5, 2019 at 11:29 pm
I was told that dosages were higher on high-latitude sectors and with higher cruising levels.”
I understand flying at 35,000-40,000ft exposes you to the same ground based levels of radiation at Chernobyl, of it you had a chest x-ray that day.
Sir Lands-a-lot, here’s my experience: in late 2009 I and another geologist, both of us officers in a uranium exploration company, were flying commercial from southern Argentina to mid Argentina, when out pocket personal dosimeters went off, that is, the overdose audible alarm activated. The airline crew asked us to stop the noise as it was alarming, so to speak, some of the passengers and we explained it could not be turned off, it was a radiation monitoring safety issue. The compromise was to wrap them in coats and store them in the overhead bin where you could not hear the alarm. These were charged quartz needle types of dosimeters where a recharge bends the needle, then each ionizing radiation strike discharges the needle somewhat and it straightens out. One of our prospects also had sufficient uranium at the surface to trigger the alarm. I brought this issue up with a fellow golfer, an airline First Officer, and he dismissed the risk. Personally, I think flight crews need dosimeter monitors, especially for flights at high latitudes and during weakening magnetic field events, such as we are currently witnessing.
I traveled back and forth 2-3 times a month to Europe for 2 years. The jet lag had all kinds of bad effects on my health. If you haven’t already read “The Circadian Code by Satchin Panda” you should.
spaceweather.com has an airline flight risk level down their page now for american flights only so far
it lists airports and to n froms
URL: https://spaceweather.com/ look for Daily Hot Flights: October 5, 2019
Dose rates range from about 16X sea level at 24,000 feet to 72X at 45,000 feet!
They also have information on upcoming Near Earth Asteroid passes and auroral conditions.
Very useful site.
Is there any way to protect flight crew from X-Rays?–lead shielding, same as that vest they lay over your chest when getting a dental X-ray. Generally not a desired material in aircraft hull design. cf ‘lead balloon’.
BTW, VE7CWA
Re: lead apron for dental X Rays. No longer recommended.
Some ideas as to what drives the solar cycles. https://landscheidt.wordpress.com/
The author reports:1) Cloud cover/climate
The correlation between cosmic rays and cloud cover over a solar cycle was first reported by Svensmark and Friis-Christensen in 1997.. (and again in 2016) the relation between cosmic ray flux and cloud cover should also be of importance in an explanation of the correlation between solar cycle length and global temperature that has been found”.
Note 1: Meanwhile in the early 2000’s, Al Gore and the IPCC’s scientific working group were being honored with the Nobel Peace prize. Their efforts resulted in demoting The Sun and the solar system to having 7% of the effect on global warming compared to CO2 (Svensmark, The Chilling Stars, 2008 p. 241).
Note 2: Is the scientific community finally going to admit that the sun and cosmic rays have more effect on global temperature than CO2? Maybe 7% C02 instead of 7% “solar system”?
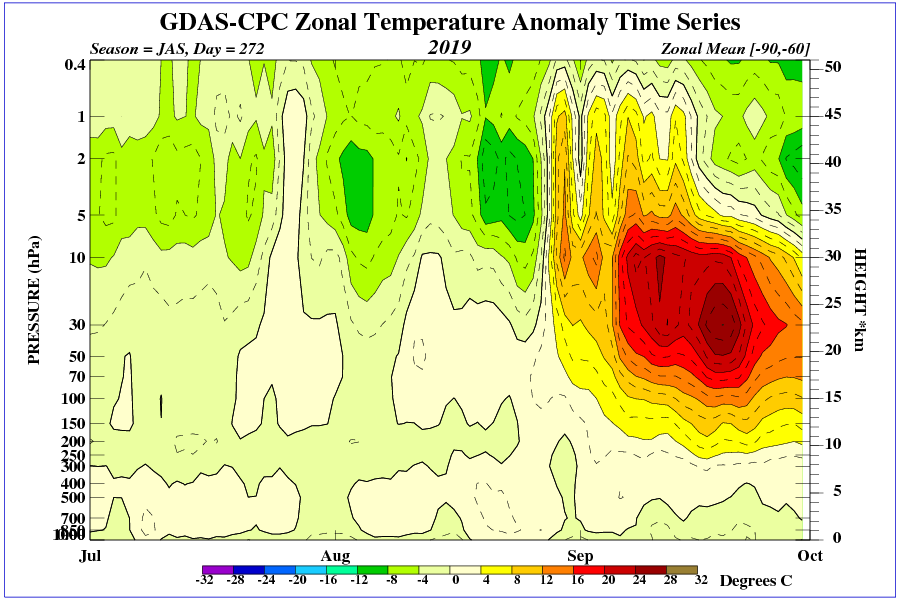
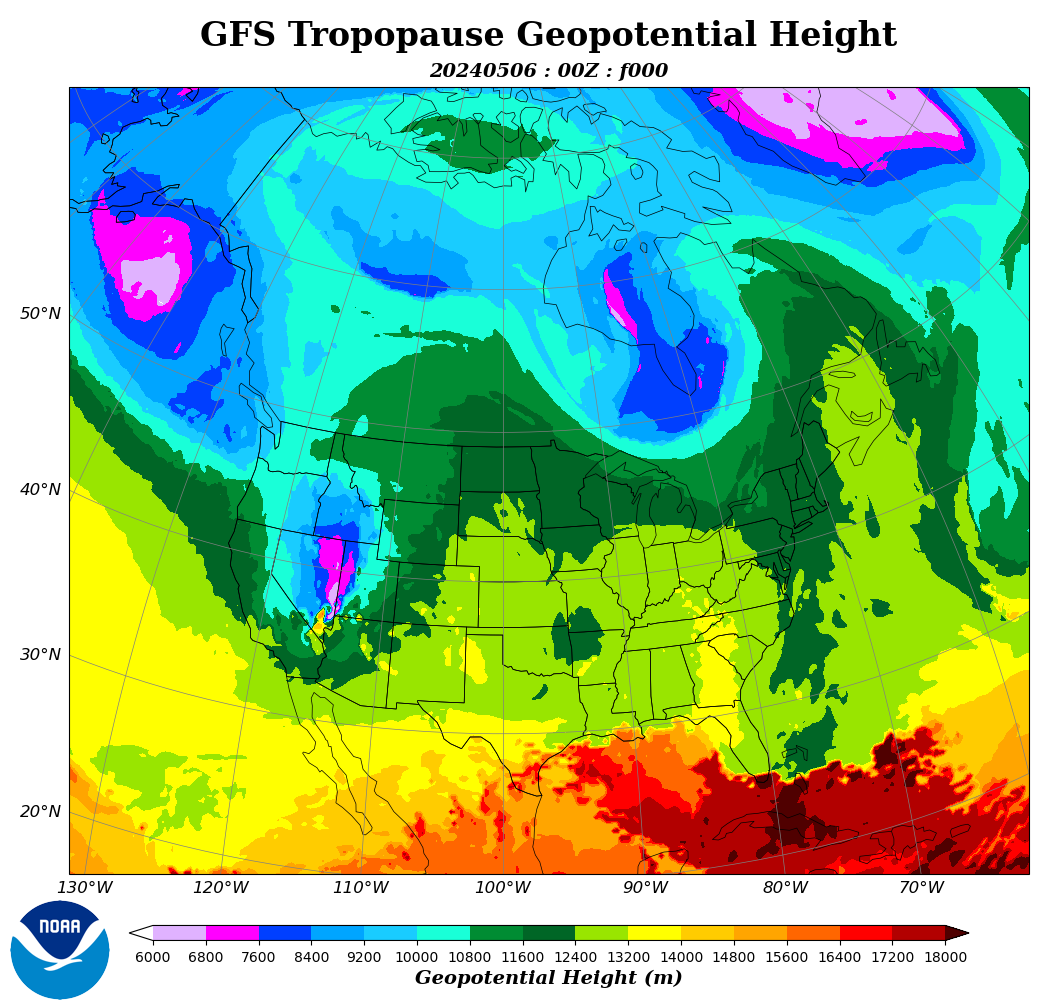
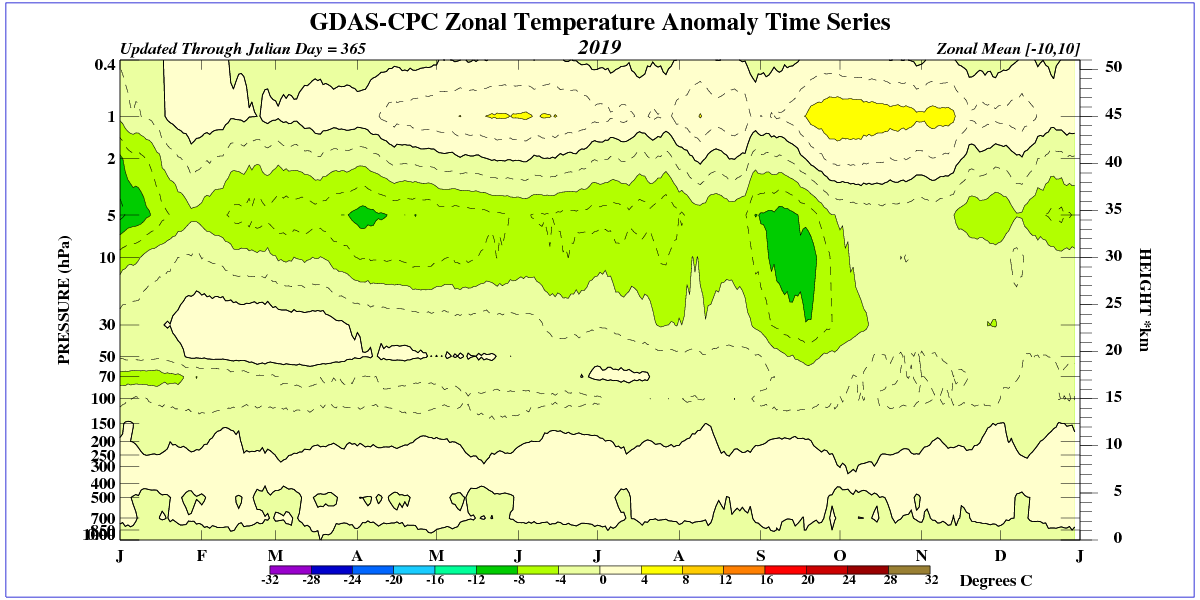
A wave of dry air that falls from the stratosphere causes a large drop in surface temperature. In this area, the vertical temperature gradient is maximum. The tropopause height drops. Explained below.
https://www.cpc.ncep.noaa.gov/products/stratosphere/strat_int/
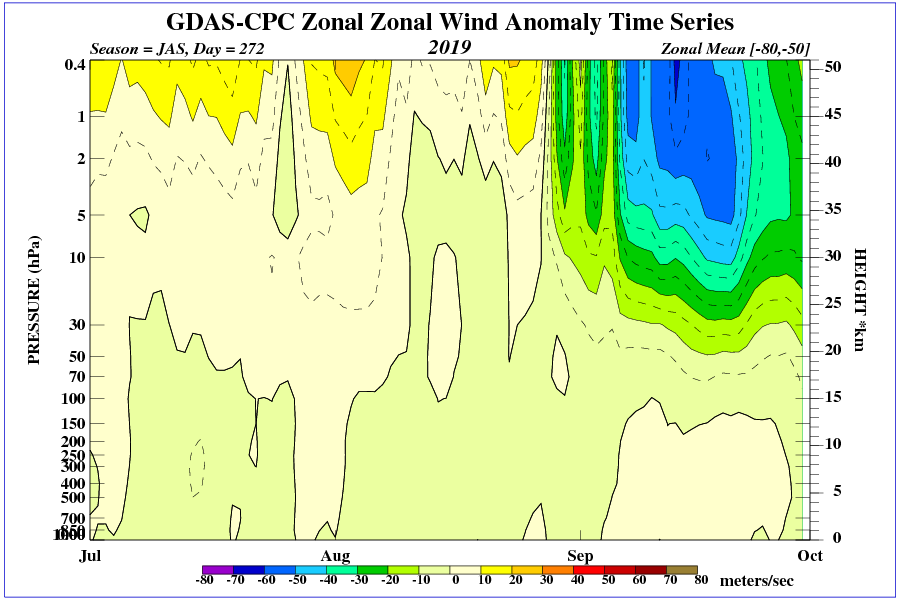
Frequent stratospheric intrusions are the effect of a weak polar vortex during very low solar activity. The role of air ionization in the middle and lower stratosphere by galactic radiation increases.
A weak polar vortex is likely to be the result of warming in the arctic
I object to the phrase “Solar Activity.” Incident Solar Radiation varies within a very narrow range. Sunspots are a far different thing than “Solar Activity.” I would love to see proof of the Svensmark theory that the sun produces more, or less, clouds, as a result of sunspots. Could be true!
Records of clouds just are not that good. Records of sunspots are excellent, going back 400 years. Solar wind affects galactic cosmic rays, which affect cloud nucleation particles, but it is all a little tenuous, not compelling proof.
I think Viskell actually has it, this would have been noticed…
“Solar Activity” implies that the Sun produces more energy sometimes, and less energy sometimes. This is far from true, Incident Solar Radiation varies within a very narrow range. Wavelengths of UV radiation vary more, but this is all very tenuous.
Just how cloudy was it during the Little Ice Age, and just how cloudy was it during the Medieval Warm Period? Nobody knows.
We cannot create patterns from non-existent data, yes I am talking to you Stokes and Mosher…
@Michael Moon
“Sunspots are a far different thing than “Solar Activity.””
That is not correct. The term “solar activity” (aka “solar variability”), as it is currently used in solar science, is intended to include _short-term_ solar disturbances, such as sunspots, solar flares and solar wind. It is _not_ intended to include long-term processes such as solar radiation generated by thermonuclear fusion (i.e. the primary source of solar energy)
https://www.dictionary.com/browse/solar-activity
https://www.sciencedirect.com/science/article/abs/pii/0032063364900315
It should more properly be called “solar magnetic activity” because these short-term phenomena are all driven by the Sun’s dynamo, which is the mechanism which generates the solar magnetic field. A different engine generates the thermonuclear power.
” Incident Solar Radiation varies within a very narrow range. Wavelengths of UV radiation vary more, but this is all very tenuous.”
That is correct. Total solar irradiance (TSI) includes all electromagnetic radiation (radio waves, light, x-ray etc) emitted by the Sun. Overall, it is only slightly affected by solar magnetic activity, varies only 0.1% over an 11-year solar cycle.
Part of that variability is in the extreme ultra-violet (EUV) spectrum, which is tiny compared to IR-Light spectrum, but increased solar-cycle EUV radiation does have a significant ionizing effect on Earth’s ionosphere. This results in significant periodic (11-year) changes (not at all “tenuous”) in terrestrial radio communications, especially in the high-frequency (HF) band (3-30 MHz).
But there is no compelling evidence (yet) that this variance is the major driver of climate change.
https://wattsupwiththat.com/2019/02/23/study-a-solar-signature-in-many-climate-indices/
Meanwhile in the thermosphere:
https://spaceweatherarchive.com/2018/09/27/the-chill-of-solar-minimum/
Don’t sell your coat! 🙂
The thermosphere, which ranges in altitude from 55 to 600 kilometers, is essentially the same “outer space” and has no impact on terrestrial surface weather. Ask the crew of the ISS (254km) who are currently flying in the middle of the thermosphere!
https://wattsupwiththat.com/2018/09/28/nasa-the-chill-of-solar-minimum-is-being-felt-in-our-atmosphere-cooling-trend-seen/#comment-2473130
The average distance an air molecule travels before it hits another air molecule is called the “mean free path”. At sea level it is about 0.1 microns (1×10**-7 meters). In the thermosphere , at ISS level, it is about the length of a football field (100 meters).
Well, I did find a correlation with cold periods in The Netherlands with our ‘Elfstedentocht’ (eleven cities tour): skating on natural ice for almost 200km between 11 cities in Friesland, northern province in the Netherlands. (organized 15 times since 1909)
Lows in the graph in the years: 1954, 1965, 1977, 1987, 1997, 2010
Years of ’11 Cities Tour” on ice: 1954, 1956, 1963, 1985, 1986, 1997.
The tour of 2012 was cancelled at the very last moment.
The 70’s no tour(s) probable explanation: warm cooling water of industry and energy plants
I really do see a correlation. Not 100% matched but still very close to lows in the graph.
We will see what happens. I expect a tour in 2020. Remember, you read it here first! 🙂
(For more info on the tour, please see: https://en.wikipedia.org/wiki/Elfstedentocht )
I think your point is that your skating tour dates are selected to coincide with sufficiently cold weather.
Perhaps. These researchers found a statistically significant correlation (10 out of 14 winters) with solar minima in Europe.
Frank Sirocko, Heiko Brunck, and Stephan Pfahl2;
“Solar influence on winter severity in central Europe” [2012]
https://agupubs.onlinelibrary.wiley.com/doi/pdf/10.1029/2012GL052412
But proof of correlation is not proof of causation. Also this does not appear to be a global phenomenon, as would be expected of solar activity.
Again, the thermosphere plays no role here. Even though the correlation above applies to thermosphere temperature, only because thermosphere temperature is almost perfectly correlated to solar sunspot activity. In other words, I could swap plots of thermosphere temperature and sunspot activity, and you would likely not notice any difference.
True, but still, low solar activity is then the factor that drives both. So, the sun did it.
Something I tell everyone who thinks CO2 drives climate.
The Mother of all Tours (well, for The Netherlands that is) needs a lot of cold in a relatively short period of time. We do have a sea climate over here. If you listen to the news over here we have a carbon climate, but I don’t buy that.
The correlation keeps me expecting a very cold winter this year. And a tour!
Time will tell.
Will cycle 24 be longer ?
Sunspot Number Progression
spaceweather.com today ran an article on that
their suggested date for 24 ending is now out to 2023
They link to a forecast from April 10th, what I linked was the Sepember forecast.
I routinely carry a geiger muller counter on all flights.
The radiation levels are highly variable, from 2.2mR/hr to as high as nearly 5.
The aircrews are often interested in this “gadget”, but scarcely realise they are being bombarded with an increasing number of ions and subatomic particles at 10 000m FL.
What struck me more was the levels of radiation measured in placeslike Warsaw airport – ON THE GROUND, which are only explanable by use of coal fly ash to make concrete.
Fly ash can have astonishingly large amounts of concentrated uranium and thorium deposits in it, -very noticeable in China…
.now let me think….all those concrete buildings and motorways thrown up in PRC over the last decade, then tower blocks stuffed with vast quantities of Russian Asbestos, which they can’t export anywhere else thanks to safety bans all over the western world.
Hey your carcinogens are all around you, inc the vast amounts of pesticides they throw all over your supermarket apples.
>ignorance is bliss..<
..until that is, your kids suddenly go down with mesothelioma for unexplainable reasons..from stuff she inhaled at school 20yrs ago. (happened to a friend's daughter at age 30).
Have you heard of the town called Asbest?
Patrick MJD
October 6, 2019 at 2:18 am
Do you mean Asbestos in Quebec?
I have some lovely foot long asbestos crystals from the mines there collected as a geology student in the 1960’s. I treasure them as unusual and now forbidden mineral samples (but do keep them wrapped up in plastic wrap).
If you go to the otherwise excellent Natural History Museum in London, UK they have become so PC that even gemstones of garnet from the Jeffrey Mine in Asbestos have been disappeared from the display cabinet (but they left the label for all to see their stupidity!). Unbelievable. Over recent years most of their coal samples have been removed, the radioactive ones were next and now even gem displays are tainted. All very sad.
No, I do mean Asbest in Russia where potholes in roads are filled with the stuff. I did go to the NH Museum in London in 2003, last time I was in the UK. Not sure what has changed since, but what you say would not surprise me at all.
When I was at a Navy Shipyard, the most telling document about asbestos and cancer was its relationship to cancer and smoking. If you did not smoke and were in contact with asbestos your lung cancer chances were about the same as someone who did not smoke and was never in contact with asbestos.
But if you smoked and never came in contact, you chances of lung cancer went up into the mid-range. With asbestos, it was almost a certainty.
Sticky stuff, that tobacco tar on a lung’s alveoli.
IIRC an old (1970s) article in Science News reported that asbestos lodged in lungs converted benzo-pyrenes in smoke into a potent carcinogen. Can’t find it.
This works. https://www.ncbi.nlm.nih.gov/pubmed/3618219 Abstract:
Well now, I’m shur nuff happy that they legally provided the teenagers their E-cigarettes for “smoking” instead of that deadly tobacco …… because it only takes 1 or 2 years before the E-cig smoking teenager dies from lung problems, …….. whereas with the tobacco smoking teenagers it may take 50, 70 or 80+ years fore their cigarette “smoking” kills them.
But their teeth fall out and their legs drop off, before they die.
On fly ash: There was a fascinating report from ORNL about that. My usual reference disappeared, but manage to make a copy, see http://wermenh.com/climate/ornl/ORNLReview/rev26-34/text/colmain.html
Economist Julian Simon busted the Myth of Asbestos in the ’90s. See “The Ultimate Resource 2.” Simon famously did follow-up research into the supposed cancer link and found that it was based on faulty research hyped by tort lawyers.
In the Canadian town where most asbestos was stripmined, epidemiological studies found no increased cancer incidence despite asbestos’ high concentration in the environment. There was one clear exception: asbestos workers who smoked tobacco were 70% more likely to develop cancer than the general Canadian population. Inhaling asbestos with your cigarette, it is true, is extremely dangerous. … A late ’80s study also found in schools that were remediated following the scare, asbestos levels in the air inside the buildings were higher than before remediation (trapped asbestos was liberated from paint); researchers finally determined also that air in the pre-remediated schools had lower asbestos levels than the air outside, which no one had ever thought to measure.
Simon once challenged a high-profile Malthusian to a bet over the future price of commodities. The Malthusian predicted in a book global shortages would lead to worldwide famine and resource wars by the mid-1980s. Simon predicted lower prices by 1990 and was correct.
I call your bollox you just posted.
“Julian Simon busted the Myth of Asbestos”
Myth?? WTF?
Go tell your stories to all the French that died of cancer directly related to asbestos exposure.
One famous example was a technical school in the Vosges where nearly ALL the tutors died one after another of exposure to it in their place of work.
In fact the kind of thing you just wrote makes me want to throw up it’s just so plain WRONG, especially as after years of litigation, the boss of a major polluter was let off.
read a bit:- asbestos is deadly as inhaled dust, and public buildings were/are full of it in France, schools, hospitals, colleges….
Thank goodness for one guy:- PEZERAT.
https://fr.wikipedia.org/wiki/Henri_P%C3%A9zerat
http://www.victimes-amiante.org/proprietes-utilisation-amiante.php
http://www.victimes-amiante.org/
oh yes,- and the case of ABEST this town in Russia that thanks to Putin’s government is exporting death to the Chinese and Indians in ever increasing quantities, even in new buildings in Russia today,- 1000s and 1000s of tonnes of it per year.
Yea right! STOP the trade in industrial death to the innocent & naive building trade.
I have been to France perhaps a dozen times. I met very few French who did not smoke. Given the link of the combination if smoking and asbestos to lung cancer, I am not surprised by your observations.
The myth seems to be that asbestos produces cancer in non-smokers, although I suspect data is sparse on the effect of asbestos on those subject to constant second-hand smoke (which essentially would be the entire non-smoking French population at the turn of this century).
You have no idea what you are on about.
I lived in France for more than 2 decades and your observations of smoking are complete crap.
There is NO MYTH, and I personally am not observant of the kind of smoking culture you claim. (it’s now banned in all public places).
Asbestos caused cancer in garage staff who used to be exposed to it in brake and clutch dust on a daily basis.
It has caused deaths all over France to innocent children who were exposed to it in their primary schools and colleges without knowing they were.
The case against AMISOL was PROVEN and a film made of it.
https://www.telerama.fr/cinema/films/les-sentinelles,n5180220.php
You clearly never read anything (link above) about the pioneering work of Henri Pezerat to prove staff exposed to toxic elements at work died from them and became the basis of modern medicine at work.
The sickening crap I just read here, would like to put the clock back to the 19th century, not least because spurious claims are made, that exposure to risk such as high levels of radiation are “beneficial” to the body…(WTF!)
Here’s a little in French from Henri’s bio.
The guy deserver a medal, instead of almost universal industrial flaming over decades, until finally he got decisive proof that many governments allow policies which poison or shorten the lives of their workers.
The next will be the airline industry with daily exposure to high radiation doses over decades, and farm workers exposed to very high levels of pesticides doing banal jobs like picking apples……
“Henri Pézerat croyait en l’importance capitale de la toxicologie en médecine du travail, comme précurseur de la toxicologie de l’environnement.
En 1999, il lance l’Affaire des cancers pédiatriques de Vincennes, en alertant le Directeur Général de la Santé par une lettre où il décrit un agrégat spatio-temporel (cluster) de cancers d’enfants à l’école maternelle Franklin Roosevelt, construite sur l’ancienne friche industrielle laissée par les usines Kodak.
Soutenant les parents du Collectif Vigilance-Franklin11 dont l’association, après avoir obtenu une étude épidémiologique et un suivi du site pollué, en demande toujours la dépollution, il représente les victimes au Comité scientifique, puis en désaccord avec le comité, il en démissionne
En 2000, il met en garde contre la toxicité du fioul lourd s’échappant du bateau échoué, l’Erika
Ses derniers combats concerneront le désamiantage du porte-avion Clemenceau et la détermination du rôle délétère de l’aluminium dans la genèse de la maladie d’Alzheimer.
Il pensait que les travailleurs étaient les sentinelles du risque toxicologique tant professionnel qu’environnemental, en tant que premiers, et souvent les plus touchés par des polluants, les mêmes dans les deux cas.
Son combat est poursuivi par l’Association Henri Pézerat Santé-Travail-Environnement”:
Shur nuff, ….. pigs_in_space, ……. I believe, ….. I believe, ….. I believe.
I believe: Cigarette smoking is responsible for more than 480,000 deaths per year in the United States, including more than 41,000 deaths resulting from secondhand smoke exposure ….. even though autopsies are seldom if ever performed on the cadavers to prove and/or justify said ”tobacco smoke cause”, …. nor has there ever been an obituary “printed” that listed ”tobacco smoke” as the cause of death.
I believe: Round-Up weed killer is a cause of cancer deaths …… because a Jury of 12 people said so.
I believe: DDT killed tens of millions of “songbirds” ……. because one (1) person claimed it was a “scientific fact” in the book they authored, titled “Silent Spring”.
I believe: The release of Freon into the air was destroying atmospheric Ozone, resulting in the Ozone Hole, thus permitting dastardly dangerous UV radiation to kill millions of people …….. because Dupont’s patent on Freon was about to expire.
I believe: The government is subsidizing the production of methanol to prevent CO2 caused AGW that will kill hundreds of millions of people ……. because the methanol producers should be earning tens-of-million$ of dollars each and every year in order to be great “political donors”.
I believe: That like 50+% of the American public is either “trying to acquire” … or “trying to improve” their eating/seating arrangement at the “government trough”.
Smoking kills alright, through emphysema if nothing else. I don’t know how to acquire the statistics on that, though, the focus has always been on “lung cancer deaths”. My father died of smoking induced COPD (I think that’s what’s on his death certificate, but I haven’t seen it) after smoking for 40 years of his life. But where are the statistics on COPD and how many of them were smokers?
Red94ViperRT10, …… EVERYTHING is “smoking induced”.
EXCEPT all the things that are CAGW “global warming” induced.
Red94ViperRT10, …… you should as yourself the question of, …… if tobacco use has been steadily DECREASING during the past 30 years, …… then why is the diagnosis of COPD drastically increasing and is now rated as “the fourth most common cause of death in the USA”.
I smoked for nigh onto 60 years without any lung/breathing problems ….. then I was diagnosed with RA in 1995, which not only severely affected my neck, shoulder, hand, hip and ankle joints but it its later stages it caused me severe lung problems, …. aka: COPD diagnosis.
“the kind of thing you just wrote makes me want to throw up it’s just so plain WRONG, especially as after years of litigation…”
Litigation cannot be considered an arbiter of truth.
Mr. Simon’s book was fact-checked, the way responsible publishers used to do, so I doubt this professor made it all up. Cancer rates at the Ontario stripmining site should have been thru the roof, if you are correct. But they were not. They were not significantly elevated. IMHO, this one “ugly” fact falsifies the theory of asbestos’ virulent toxicity.
My thoughts on why the diagnosis of COPD has been drastically increasing during the past 20+ years is that the microscopic “dust particulate” in indoor air has increased exponentially ….. as a result of the “ends” of synthetic fibers used for carpeting, furniture upholstery, etc., etc., breaking off due to its wear and aging, ….. and thus becoming airborne ….. and then inhaled into one’s lungs.
One should realize they are inhaling said fabric particulate iffen the “dusting” of furniture, tables, shelves and display objects has become a daily/weekly task in some households.
But you can’t sue the manufacturers or the retailers because …………………
“The intensification of cosmic rays can have important consequences on such things as Earth’s cloud cover and climate, the safety of air travelers, and as a possible trigger mechanism for lightning.”
Don’t forget fast-earth-cooling explosive volcanic eruptions caused by excessive muon-triggered nucleation in silica-rich magmas (nucleation rate exceeds quench rate), like Mount Tambora during the Dalton minimum, which was largely responsible for the “year without a summer”.
Cycle 19 was the strongest in recorded solar history, however the solar peak occurred in the international geophysical year 1958, when the scare for a next ice ace was emerging.
If that peak was in a cooling time, how can a future solar low also be a cooling cause?
What was the cooling mechanism in 1958?
The ice age scare was primarily during lower cycle 20 when we also saw more meridional jet stream tracks as now. Also note that the thermal inertia of the oceans is substantial.
The cooling mechanism for only the lower atmosphere around that time, was the high solar activity causing an very active/strong Walker Circulation.
A strong Walker circulation promotes solar energy in the Tropical oceans, mixing with ocean upwelling very slowly warming lower depths, but cooling at and near the surface.
This is known with the ENSO as promoting La Nina’s.
This period started with a negative AMO cycle that resulted in lower global temperatures at the surface.
https://upload.wikimedia.org/wikipedia/commons/b/b4/Atlantic_Multidecadal_Oscillation.svg
It’s much more likely that the variation in UV radiation (which varies by 50% between solar cycle min and max) as a driver of atmospheric chemistry will affect climate much more than cosmic rays. For some reason there seems to be a vested interest in the cosmic ray canard that really just needs to go away.
Yes, I prefer the atmospheric chemistry solution rather than cosmic rays. Changes in the ozone creation/destruction balance at different heights and latitudes seem more plausible than cosmic rays per se.
Both change the temperature in the stratosphere. The temperature in the upper stratosphere decreases and increases in the lower (only in certain regions around geomagnetic centers). In the upper stratosphere UV works in the lower GCR.

Sudden stratospheric warming in the south in September changed satellite data throughout the southern hemisphere.
http://images.remss.com/data/msu/graphics/TLS_v40/plots/RSS_TS_channel_TLS_Southern%20Hemisphere_Land_And_Sea_v04_0.short.png
http://images.remss.com/msu/msu_time_series.html
“Potential role of low solar activity this winter as solar minimum deepens”
And then there is this!
Impeachment Investigation, ala Pelosi, is in fact a US-style prorogation (akin to BoJo and Westminster). So that data correlation is as usual, askew.
The anarchy of that “this” makes WUWT seem like a scholarly debate in an Edwardian gentleman’s club.
The modern world is truly scary, not because of any climatic effects but because the administration of government, economy and science has been handed over to the chaotic outpourings of mentally maladjusted children and their shadowy financial puppeteers.
Because Gov’t has been handed over to spooks. Even Pelosi : “I’m saying to the president and I’m saying to you, ‘You’ve come into my wheelhouse now. I have 25 years of experience in intelligence.'”
Spooks like Christopher Steele, Brennan, Clapper and now Pelosi have caused absolute chaos.
In your link someone asks how one could detect sunspots before the satellite era 🙂
your = who?
someone = who?
detect = Oh say can you see …?
Please make comments with enough info that those of us with lower IQs can follow.
They looked at the sun and counted them. Even then they had telescopes with dark filters. But they projected the image onto a screen.
However, Nixon was not impeached and the impeachment of Trump is still in doubt. For our non-American friends (and perhaps many Americans too), removing the President is a two part process. Impeachment is voted on by the House of Representatives and if passed represents official charges against the President. The trial for removal based on those charges is done by the Senate with the Chief Justice of the Supreme Court presiding. It takes approval of 2/3 of the Senate (67 votes yes) to remove the President.
So impeachment is just step one. You will see the less informed zealots scream victory if the House does pass impeachment articles until they realize that in itself does not remove the President. They will then demand the Constitution be changed.
along with drivers license ID’s to illegals…doing away with the Electoral College
The deep sun-spot minimum is setting up a test for – well let’s for convenience call it Svensmark-s theory. According to theory the Earth ought to be cooling. If it happens it is an evidence in support of Svensmark’s theory. If it does not, it falsifies it. Right? It also falsifies AGW-theory. That’s to say it diminishes the role of man generated carbon dioxide.
What might spoil the experiment could be mayor volcanic eruptions, a heavy asteroid collison or full scale nuclear war. All of that should cause cooling not due to solar activity.
A nearby supernova, could cause a disturbance to the test. However if there occurs a global cooling on Earth, that could be considered a support for Svensmark. Right?
Well, let’s see and hope fore a clean experiment of nature that can move science forward!
Svensmark’s theory does not “falsify AGW-theory“. AGW-theory cannot be falsified because it’s unscientific. There’s no scientific definition of what AGW theory is. AGW supporters never proposed falsification criteria, and would not accept contra evidence to AGW.
— Wolfgang Pauli
Check Svensmark on Forbush decreases – no need to wait for a supernova…
little to no effect and the increases in Forbush decreases are huge.
This is the flaw in thinking by the public on Sven’s theory.
Increased cloudiness will not result in an immediate global cooling. Clouds play two roles, and the cooling role is associated with charging the ocean with heat. But the ocean releases heat on its own schedule independent of cosmic rays. That’s why we have high temps today, the release of heat by the El Niño, and the tailing off of that heat releasing event.
The cooling you will see from the minimum will be delayed, and will occur on the oceans own schedule, not the suns, not some preset delay, or any other nonsense. I’ve noted before, the incoming solar rad is on the Oder of 10^21 kloules, whereas the ocean holds over 1000 times that amount of energy at 10^24 kjoules. Diurnal temperature of the ocean surface is barely even measurable in a range of 0.1-0.05C.
Thus, you aren’t going to see some immediate change in temperature due to Sven’s theory, but you will see it over l9nger periods of time, as the ocean surface temps begin to lose more heat than they bringing in ….. very slow process.
Noting Svensmark’s GCR work in relation to Nir Shaviv’s work on galactic climate – the timescales are vast.
Forbush decreases are an experiment nature readily provides on much shorter timescales, as Svensmark pointed out.
It seems to be difficult during the entire “climate epoch!, to appreciate relativistic protons – they are so tiny! None of my friends can see one!
As even CERN reassures hysterical locals recently yet again, not to worry, nature bombards us with protons CERN cannot even dream of matching.
Oh come on now! The Sun has no effect on planetary warming.
Shhhhhh! The sun is hunting “wabbits”.
“Temperatures 15 to 30 degrees below average across much of Northwest”
“Now snowing in 8 states and 5 provinces – In September’
https://www.iceagenow.info/page/2/
I”m interested in how this will affect the weather. Winter weather is really more important than summer because increased snow volumes will feed into the water table, once the snow melts. Some of it will go downstream as it melts, yes. But a great deal will sink right into the water table and that means I won’t have to water my lawn in the summer.
Also, when snow melt sinks into the ground instead of entering streams and rivers, it increases the amount of water available for surface use. I know it takes more than one season for it to reach the water table level, but if you’re on a well (I’m not), it does make a difference. In my area, there are many, many open spaces set aside by the DNR as overflow receptacles to reduce flooding going south. There has been massive flooding from the state line to far south of my area because of excessive rain, and that runs south and southwest toward the Mississippi River.
Remember all that flooding and related damage last spring from excessive snow melt plus rain? Are we really prepared to deal with that on a recurring basis?
Sara
The AGW crowd goes on about how low Arctic sea ice extents will lead to runaway warming.
Well l believe that’s a utterly misplaced worry. l now think that low sea ice extent and warmer water in the Arctic helps to set up increased snow amounts and extent across the NH in winter. Due to the increased jet stream jet activity in and out of the Arctic circle. That combined with the risk of increased northern blocking maybe caused by low sun activity. Can lead to cold and snowy winters even in a so called warming climate.
Taxed: – It IS utterly misplaced, based on their utter ignorance of the real world and how it works. I’m quite convinced now that they have no real contact with the world outside their cocoon, and if they were dropped in the middle of a real wilderness, they’d freak into mass hysteria, on the spot.
I am so glad now that I decided against the tablet (scam) and did not replaced my old TV when it died.
Blocking is already visible. The polar vortex pattern will be similar to last year. Very strong sudden stratospheric warming and breakage of the polar vortex are possible in January or February.
https://earth.nullschool.net/#current/wind/isobaric/500hPa/orthographic=-104.00,58.23,591
Okay, ren, but can you apply that to the long term in regard to seasonal changes?
We live in a system based on the chaos factor, not a steady state. I don’t think the chaos factor is really being figured into any of this so far, that’s all.
In summer and winter temperatures will be extreme. In the summer, due to ozone depletion, more UV radiation will reach the Earth’s surface.
Mu question: Was the picture of the Sun purposely shown as reddish in an attempt to fool readers to make them subconsciously lean towards the views by the author?
My answer: I believe that image is from the HMI (Helioseismic and Magnetic Imager) instrument, see https://umbra.nascom.nasa.gov/images/ . For looking at sunspots and regions that have magnetic activity that aren’t reflected as visible sunspots, it is a reasonable choice. The sensors includes an image taken at 6173 Å.
Short answer: No.
solar minimum deepens
Not sure how it’s deepening — been at a steady minimum for months & months now.
Galactic and radio radiation are now the lowest in this cycle.
https://www.spaceweather.gc.ca/solarflux/sx-4-en.php
Sorry, of course, galactic radiation is the highest in this cycle now.
https://cosmicrays.oulu.fi/
Active solar regions
http://www.solen.info/solar/images/AR_CH_20191005.png
The 10.7 cm radio flux is a better measure than counting sunspots in part because it provides a deterministic measure instead of relying on people to count them. See – It’s not quite at the expected minimum (which is never zero).
It’s from https://www.swpc.noaa.gov/products/solar-cycle-progression . We have a copy at https://wattsupwiththat.com/solar/
Ric Werme
“It’s not quite at the expected minimum (which is never zero).”
Exactement.
On the one hand, we see that over the long range, human SSN counts fit very well to F10.7:
https://drive.google.com/file/d/1ShXgzae4Fr_fOs9kWJiSzD8yXkcewQZY/view
but on the other hand, F10.7 being never zero, shows better what happens form day to day:
https://drive.google.com/file/d/1JbUKZwfqBXCu49YoJ5sJVzU1gTSpAyo6/view
Is there any significance to the overlap of the large “red” area on the map and the reformed “blob”?